 Open Access Article
Insights into agglomeration and separation of fly-ash particles in a sound wave field
Mengshi Lu,
Mengxiang Fang ,
Mingchun He,
Shuxin Liu and
Zhongyang Luo
 *
*
State Key Laboratory of Clean Energy Utilization, Zhejiang University, Hangzhou 310027, China. E-mail: zyluo@zju.edu.cn; Tel: +86-571-87952440
First published on 12th February 2019
Abstract
The efficiency of fine particle removal by using traditional devices is relatively low. Acoustic agglomeration is an effective pretreatment method that agglomerates particles before they enter a particulate control device so that they can be easily removed. The movements of particles exposed in a sound wave field were captured using a high-speed camera in this study. Agglomeration and separation of two particles were directly observed. Photographs were analyzed frame by frame to obtain motion information. A model was constructed, and COMSOL Multiphysics software was employed to simulate their relative motions. The simulation results matched the experimental results well. The conditions under which an aggregate consisting of two particles will be separated by a sound wave were calculated. The calculated results revealed that a non-breakable region exists: when sizes of primary particles are within this region, agglomerates will not be separated into smaller particles, but outside this region, agglomerates can be separated. The observation of particle motion deepens understanding of acoustic agglomeration and separation processes taking place in the agglomeration chamber. The calculation of separation of agglomerates can guide enhancement of acoustic agglomeration processes.
1. Introduction
Fine particulate matter suspended in air has drawn worldwide attention because of its serious impact on the atmosphere and human health.1–3 Several particulate control devices, such as cyclone separators, bag filters, and electrostatic precipitators, have been widely used for particle removal.4–7 However, the efficiency of fine particle removal by using these traditional devices is relatively low,8 which means that methods must be identified to enlarge fine particles. Acoustic agglomeration is a promising pretreatment method by which fine particles agglomerate into larger ones before entering traditional devices so that they can be removed more easily.9Many studies have proved the effectiveness of using sound waves to enlarge particle sizes and reduce particle concentrations.10–14 Research has shown that the mass concentration removal efficiency was improved from 91.29% to 99.19% with the use of a bag filter and from 89.05% to 99.28% with the use of an electrostatic precipitator by using acoustic agglomeration as pretreatment.15 In addition to experimental researches, particle motions and interactions in sound wave fields have been simulated. Based on the interactions, several agglomeration mechanisms have been proposed.16–21 Orthokinetic interaction was first proposed by Mednikov and is widely considered as the main mechanism.17 Orthokinetic interaction is based on the difference in entrainments of polydispersed particles in a vibrating gas, and it therefore cannot explain agglomeration of monodispersed particles. Hydrodynamic interaction, which is based on asymmetry of flow around particles and Bernoulli's principle, has been proposed to explain the agglomeration of particles of the same size; and it includes the acoustic wake effect and mutual scattering interaction. Several studies have proved that other mechanisms, such as acoustic radiation interaction and turbulence caused by the sound, were negligible.22,23 Therefore, the critical mechanisms are orthokinetic interaction and hydrodynamic interaction. However, researchers have yet to reach a consensus. Markauskas and Zhang demonstrated that the acoustic wake effect was the major acoustic mechanism.24,25 By contrast, Fan's research showed that a combination of orthokinetic interaction and gravity sedimentation dominated the acoustic agglomeration process.26 Dong, however, indicated that the acoustic wake effect was more important at higher frequencies for all particles, whereas orthokinetic interaction dominated at low frequencies.27
Once particles collide with each other, they are likely to adhere owing to van-der-Waals and liquid bridge forces. Acoustic agglomeration increases the size of particles, resulting in a decrease in the concentration of small particles and an increase in the concentration of large particles. However, Zhang and Shen reported that high-intensity sound waves caused the concentration of particles larger than 50 μm to decrease, which indicated that large particles were later separated.28,29 Zhang's research showed that ignoring the breakage of particles may result in some discrepancy between the simulation results and experimental results at high sound pressure levels (SPLs).30 Studies on separation of agglomerates, which occurs simultaneously with acoustic agglomeration, are inadequate.
Direct observation of the relative motion of particles in a sound wave field plays crucial role in understanding the acoustic agglomeration process. A high-speed camera has previously been used to analyze particle motion.31–34 However, only the tracks of particle movements were obtained; the sizes and velocities of particles were unobtainable because of the low frame frequency and long exposure time. The rapid development of photographic equipment has now enabled the velocity to be obtained during an extremely short time interval, and this velocity can be considered equal to the instantaneous speed. Zhou used a high-speed camera to observe the movements of DEHs particles under different sound wave conditions and accurately obtained particle speeds, however, agglomeration phenomena were not detected because of the low concentration of particles.20
In the present study, microscopic visualization and high-speed photography were utilized to directly observe the dynamical relative movements of fly-ash particles during the agglomeration process. COMSOL Multiphysics software was employed to simulate the relative motion of two particles under the same condition as the experiments. The limiting condition for acoustic separation of agglomerates was calculated. This work ought to enhance understanding of acoustic agglomeration and separation processes and provide a theoretical basis for the optimization of acoustic agglomeration.
2. Experimental setup and method
2.1 Experimental setup
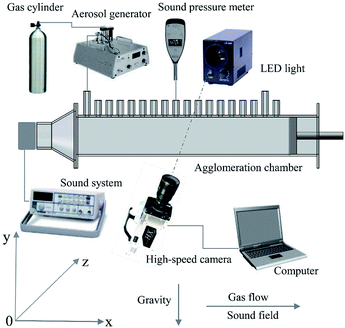
To study acoustic agglomeration and separation of particles, an experimental setup was built, which is illustrated in Fig. 1. The experimental setup comprised three parts: an aerosol generation system, an agglomeration system and, a high-speed photography system.The aerosol generation system comprised an aerosol generator and a gas cylinder. The materials used in this experiment were fly-ash particles from an electrostatic precipitator in a coal-burning power plant (Banshan Power Plant, Zhejiang, China), and they were dried at 105 °C for 10 h to remove moisture before use. Particles were continuously generated using an aerosol generator (Topas SAG 410L) and then were well mixed with the carrier gas supplied by the gas cylinder. The flow rate of the aerosol was adjusted to 1.3 m3 h−1. Size distribution and morphology of the fly-ash particles are presented in Fig. 2. Particle size distribution was measured using a Mastersizer 2000 particle size analyzer. The volume particle size distribution was mainly between 10 and 100 μm, in which the volume of PM10 accounted for 23.64% of the total volume, whereas the proportion of PM2.5 was 6.88%. Particle morphology was measured using a scanning electron microscope. Fig. 2(b) displays the shape of the particles, most of which were nearly spherical.
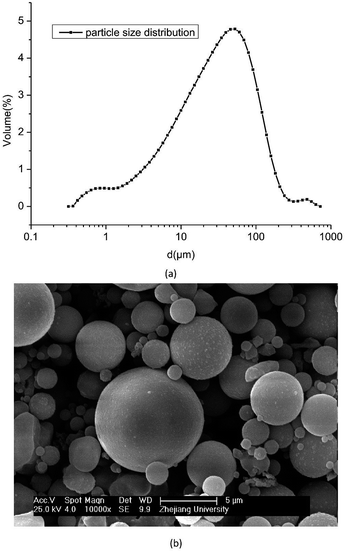 | ||
| Fig. 2 Particle size distribution and morphology characteristics. (a) Particle size distribution. (b) Particle morphology. | ||
The agglomeration system consisted of an agglomeration chamber and a sound system. The 6 cm × 6 cm transparent agglomeration chamber was made of quartz glass. An adjustable steel plate was placed at a specific position to create a stable standing wave. In this experiment, the length of the chamber was adjusted to three times the half wavelength, (i.e., 0.257 m). The side of the chamber had many holes, which were designed for the SPL to be measured using a sound level meter (AWA 5661-1C). The sound system comprised a compressor driver (YF-513), a signal generator (Goodwill SFG-1013), and a power amplifier (QSC RMX2450). The SPL and frequency were adjusted to 2000 Hz and 158 dB (at the antinode) by adjusting the power amplifier and signal generator.
The photography system consisted of a high-speed camera (NAC Merecam HX-4), a zoom lens (Navitar 12X), a high-intensity light-emitting diode (LHP-40WP), and a computer. The high-speed camera was set at the position of the antinode. The whole observation area was considered at the antinode since the area was very small compared with the agglomeration chamber. When aerosol flowed through the agglomeration chamber, particles were magnified seven times by the zoom lens and photographed by the high-speed camera. The frame frequency was 20![[thin space (1/6-em)]](https://www.rsc.org/images/entities/char_2009.gif) 000 fps, and the resolution was 640 px × 480 px. Due to the high intensity of the light, the exposure time was only 5 μs.
000 fps, and the resolution was 640 px × 480 px. Due to the high intensity of the light, the exposure time was only 5 μs.
All the experiments were conducted at 1.013 × 10⁵ Pa and at 20 °C.
2.2 Method
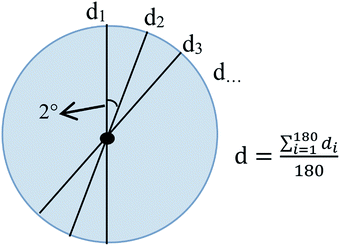
After obtaining the images, the particles were identified and matched with adjacent images using an image processing software.For a spherical particle, the measurement method of the particle diameter is shown in Fig. 3. After identifying its edge and centroid, the length of a line segment passing through the centroid and ending at the particle boundary was taken as a value of the particle diameter. The average length of diameters measured at 2 degree intervals was taken as the diameter of the particle. Particle diameters are crucial parameters controlling the relative movements of particles. To reduce errors in diameter measurement, the diameters of particles were measured in every image. The observation area was 1.92 mm × 1.44 mm, thus, a particle flowed through the area for approximately 19.2 ms, and more than 300 images could be obtained, which contained the size information. The measured diameters were then averaged to obtain accurate size estimation.
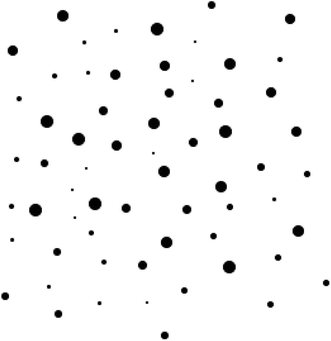
Particles were magnified seven times by the zoom lens and the size of each pixel was 3 μm in this system. The accuracy of the particle size measurement mainly depended on the recognition of particles. In order to test the accuracy of particle recognition, a computer-generated sample image was usually used.35,36 As shown in Fig. 4, the image used in this test had nine sizes of circles, ranging from 2 pixels to 10 pixels. The recognition errors are shown in Table 1.
| d | 2 pixel | 3 pixel | 4 pixel | 5 pixel | 6 pixel | 7 pixel | 8 pixel | 9 pixel |
| |Δd|/d | 8.22% | 6.83% | 4.27% | 3.6% | 2.89% | 2.16% | 2.88% | 2.01% |
In the table, |Δd| stands for the average diameter difference between the measured circles and the original circles. The relative error decreases with the increase of the particle size. In this system, particles larger than 6 μm can be measured accurately with an error within 10%, and the measurement of particles smaller than 6 μm may result in large errors. Therefore, only particles larger than 6 μm were analyzed in this experiment.
3. Theoretical models
Force calculation is fundamental and crucial for analyzing particle movement. When a particle moves in a horizontal sound wave field, the horizontal motion of it can be written as eqn (1), which has been widely applied in simulation.37–39
 | (1) |
Vertical motion is usually induced by gravity, buoyancy, and hydrodynamic drag force.40 Buoyancy is negligible compared with gravity, and thus, the movement of the particle can be written as eqn (2) and (3).
 | (2) |
 | (3) |
According to acoustic theory, when ug/c0 ≪ 1 (where c0 is the velocity of sound with c0 = 343 m s−1) and dp/2λ ≪ 1 (where λ is the wavelength), the velocity of the gas can be written as eqn (4) and (5).39
 | (4) |
| ugy = 0 | (5) |
 ), and pe is the effective value of the sound pressure, which can be obtained using eqn (6).41
 | (6) |
When particles agglomerate to form larger particles, the uncharged agglomerated solid particles are considered to be held together by the summation of liquid bridge force Fl and van-der-Waals force Fv.42 Because the concentration of water in the experiment was insufficient for a liquid bridge to form, the adhesion force was equal to the van-der-Waals force in this calculation. The van-der-Waals force between two particles can be written as eqn (7).43–45
 | (7) |
The gravity of the two particles is much smaller than the van-der-Waals force between them, which means that the separation of the primary particles is mainly caused by the horizontal relative motion. The primary particles that make up an agglomerate vibrate with the vibration of the gas medium. The horizontal motion equation of the two primary particles can be written as follows:
 | (8) |
 | (9) |
When the two particles move as an aggregate, they have the same velocity and acceleration, u1x = u2x = uax, where uax is the horizontal velocity of the agglomerate; uax can be derived from eqn (8) and (9).
 | (10) |
The solution can be written as follows:
 | (11) |
 | (12) |
 | (13) |
Under the action of the sound wave, the smaller particle has a greater acceleration than the larger one, and they remain consistent under the action of van-der-Waals force. Fvn can be derived from eqn (8) and (9)
 | (14) |
Eqn (14) shows that the force required to keep the primary particles together is time related. An agglomerate will be separated when the horizontal component of van-der-Waals force is smaller than the peak value of Fvn.
 | (15) |
 | (16) |
In this study, the gas medium was air, characterized by the density ug of 1.205 kg m−3 and the dynamic viscosity coefficient μ of 18.1 × 10⁻⁶ kg m−1 s−1 at 20 °C and at 1.013 × 10⁵ Pa. The density of the particles was computed as 2000 kg m−3.
4. Results and discussion
4.1 Observation of acoustic agglomeration and separation
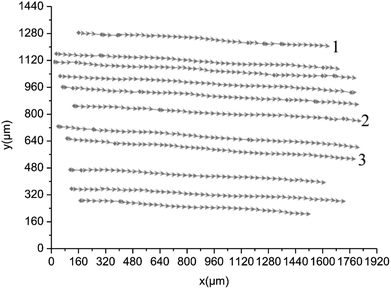
When the frame frequency was 20![[thin space (1/6-em)]](https://www.rsc.org/images/entities/char_2009.gif) 000 fps, approximately 10 images could be obtained within one period, which was sufficient to obtain the particle motion information. Particles moved to the right under the action of the gas flow. The successive photos taken by the high-speed camera were integrated into one picture and the motion tracks were obtained. The average velocities were obtained by measuring the distance between two adjacent images at an interval time of 1/20
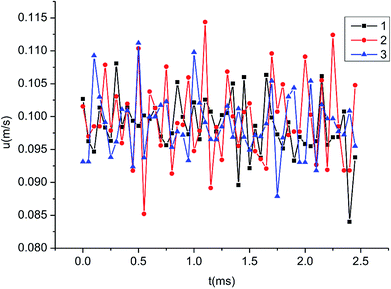
000 fps, approximately 10 images could be obtained within one period, which was sufficient to obtain the particle motion information. Particles moved to the right under the action of the gas flow. The successive photos taken by the high-speed camera were integrated into one picture and the motion tracks were obtained. The average velocities were obtained by measuring the distance between two adjacent images at an interval time of 1/20![[thin space (1/6-em)]](https://www.rsc.org/images/entities/char_2009.gif) 000 s. When the sound system was turned off, the motion tracks of particles were shown in Fig. 5. The arrows indicate the direction of particle movement. Fig. 5 shows the whole observation area, and the bottom left corner of the observation area is defined as the origin of coordinates. Fig. 6 shows the velocities of the particles 1, 2 and 3, as indicated in Fig. 5. Particles moved to the right at a speed of about 0.1 m s−1.
000 s. When the sound system was turned off, the motion tracks of particles were shown in Fig. 5. The arrows indicate the direction of particle movement. Fig. 5 shows the whole observation area, and the bottom left corner of the observation area is defined as the origin of coordinates. Fig. 6 shows the velocities of the particles 1, 2 and 3, as indicated in Fig. 5. Particles moved to the right at a speed of about 0.1 m s−1.
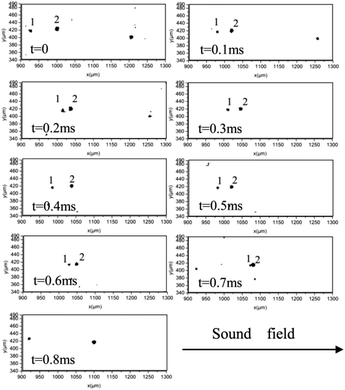
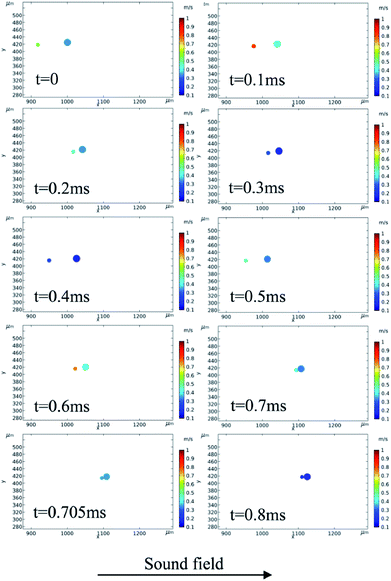
When the sound system was turned on, the relative movements were enhanced, and agglomeration and separation phenomena were observed. Fig. 7 displays the agglomeration process of two particles. The time interval between neighboring images was 0.1 ms. The larger particle had a diameter of 18.5 μm, whereas the smaller particle had a diameter of 10.3 μm. The particles vibrated back and forth under the action of the sound wave. The interparticle distance decreased when the particles moved in one direction (to the right in Fig. 7) and then increased when the particles moved back in the other direction. Eventually, the two particles collided at t = 0.7 ms and formed an agglomerate, as shown in the final image. The two particles were held together under the action of adhesion force and no rebound was observed. It should be noted that t = 0 does not mean the beginning of a period. The period of the sound wave was 0.5 ms and the observation results showed that the collision did not necessarily occur within a period.
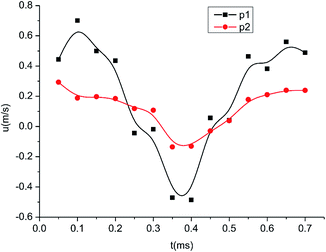
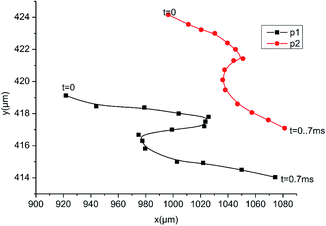
The velocities of the larger (p2) and the smaller particles (p1) are shown in Fig. 8. The smaller particle vibrated at a higher speed because its entrainment coefficient was larger. The peak velocity of p1 caused by the sound wave was approximately 0.6 m s−1 whereas that of p2 was approximately 0.2 m s−1. The positions of two particles is displayed in Fig. 9. The time interval between neighboring points was 0.05 ms. In the vertical direction, positions of the two particles decrease with time due to the effect of gravity. In the horizontal direction, the particles vibrate back and forth under the action of the sound wave and move to the right as a whole under the action of airflow. At t = 0.7 ms, the distance between the centers of the two particles was smaller than the sum of the radii of the two particles. In this condition, the two particles were considered to have collided and formed an agglomerate.
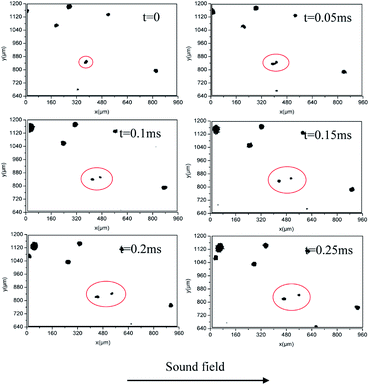
Separation of an agglomerate was also observed under the same conditions as those of the agglomeration experiment. Fig. 10 displays the separation process of an agglomerate. The two primary were moved together at first, and then the agglomerate was separated into two smaller particle groups sized approximately 22 μm and 12.1 μm. The separation occurs in the horizontal direction. No re-agglomeration of the two primary particles was observed.
Smaller particles collided to form larger ones, and agglomerates were separated into smaller particles. The observation results provided evidence that both acoustic agglomeration and separation occurred when particles vibrated under the action of a sound wave. The aforementioned phenomena were observed many times with different SPLs and frequencies. Thus, these agglomeration and separation processes are easily repeatable.
4.2 Modeling of acoustic agglomeration
COMSOL Multiphysics software was employed to simulate the relative movements of particles under the effect of a standing sound wave field. Computational fluid dynamics, acoustic, and particle-tracing modules were used in the simulation. The flow channel size was set to be the same as the experimental value. The sound pressure at the inlet was set to 2250 Pa, and the outlet and other walls were set to hard field boundaries to form a standing wave and ensure the SPL at the antinode was 158 dB. A constant frequency of 2000 Hz was used in this simulation. The particles were released from selected points with a speed, which is set according to the measured results. The time step was set as 0.001 ms to improve the calculation accuracy.Drag force and gravity were chosen as the main forces to simulate particle movements. For two moving particles, if a particle appears in a wake zone induced by the upstream particle, a hydrodynamic force will act on it. To consider the hydrodynamic interaction between particles, the fluid–particle interaction multiphysics coupling was applied. When particles are accelerated or decelerated by the drag force, a corresponding reaction force is acting on the fluid. The coupling computes the corresponding force in each mesh element. This coupling can accurately simulate the relative motion between particles. When the collision occurs, the two particles get the same speed according to the law of conservation of momentum. After the collision, they move together as an aggregate under the action of van-der-Waals force.
The SPL and sound pressure in the agglomeration channel are displayed in Fig. 11(a) and (b), respectively. The SPL and sound pressure vary with positions, reaching their maximum values of 158 dB and 2250 Pa at the antinode. The SPL and the sound pressure in the whole observation area are thought constant. Fig. 12 shows the simulated positions of two particles of diameters 18.5 μm (p1) and 10.3 μm (p2). The two particles reached the same speed after collision (at t = 0.705 ms), the change of the speed happened very quickly and was not captured by the camera. The relative positions exhibited the same trend as displayed in Fig. 7. The distance between the two particles experienced a process of decreasing – increasing – decreasing, before the two particles finally collided. The position information of this simulated results match the measured results well.
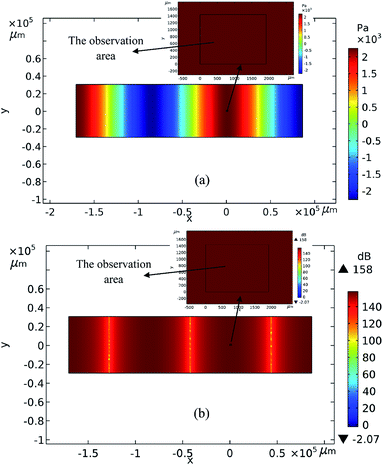 | ||
| Fig. 11 SPL distribution and sound pressure distribution in the channel. (a) Sound pressure distribution. (b) SPL distribution. | ||
The experimental and simulation results obtained are in close agreement, which indicates that the theoretical models are accurate.
4.3 Calculation of separation of agglomerates
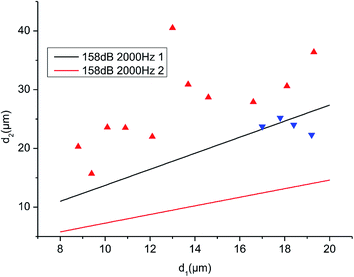
The discussion has proved that under the action of a high-intensity sound wave, particles will agglomerate, while aggregates will separate. For use in acoustic de-dusting technology, it is most desirable to let particles agglomerate to the greatest extent possible and separate to the least extent possible. Determining the conditions that will lead to the separation of primary particles is thus of great importance. Eqn (16) shows that whether an aggregate composed of two particles will be separated under a certain condition mainly depends on the sizes of the two primary particles. When d1 is fixed at a certain value and the particle size ratio varies, two critical points can be obtained where the forces needed to keep the two primary particles together is equal to the van-der-Waals force by solving eqn (17). According to the observed results, the agglomeration and separation occur in the horizontal direction. Because when particles move under the action of sound waves, they align horizontally to achieve equilibrium. Thus, the angle θ can be considered as zero. The aggregate will be separated when the size of particle 2 is greater than the larger critical point or smaller than the smaller critical point. Only when the value of d2 falls within the two critical points, will the agglomerate not be separated. When the size of particle 1 varies, the corresponding critical points will also change. Thus, two critical curves are obtained: 158 dB 2000 Hz 1 as the upper critical curve and 158 dB 2000 Hz 2 as the lower critical curve, as shown in Fig. 11.
 | (17) |
Fig. 13 plots the calculated breakable and unbreakable regions of two particles under a sound wave field of 158 dB and 2000 Hz.
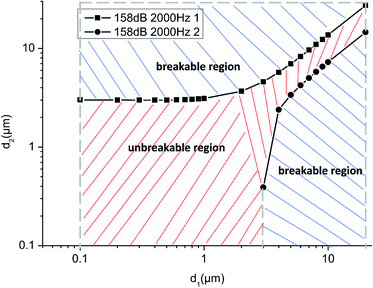 | ||
| Fig. 13 Calculated breakable and unbreakable regions of two particles. (f = 2000 Hz, SPL = 158 dB, z = 2 nm, at the antinode). | ||
When the sizes of the two primary particles fall in the area defined by these two curves, they will not separate; when the particle sizes fall outside the area, they can be separated. Smaller particles are relatively more difficult to separate. For example, when a particle with a diameter of 0.1 μm collides with a smaller particle, the agglomerate cannot be separated by the sound wave. Separation occurs when the other particle is more than 30.1 times larger than it. For a 10 μm particle, only aggregates formed by particles within particle size ratios of 0.73 and 1.37 will not be dispersed under the same conditions.
The motion characteristics of the aggregates were observed and whether they were separated into smaller ones were statistically analyzed. As shown in Fig. 14, the blue dots represent the unseparated aggregates and the red dots represent the separated ones. It can be seen that the statistical results are roughly consistent with the calculated results. The blue dots are few because the diameters of the two particles are difficult to measure before they separate. Due to the limitation of experimental conditions, submicron particles cannot be observed in this system. Therefore, the statistical results are preliminary, and further experiments will be carried out in the future to study the breakable/unbreakable regions.
According to the theory of particle agglomeration, when a large size difference exists between particles, there is obvious relative motion between them that contributes to their agglomeration. Studies have shown that adding coarse particles to fly-ash particles can increase acoustic agglomeration rate.46,47 Moreover, agglomerates with large differences in size are more easily separated according to eqn (16); thus, the size of the added particles should be controlled within a range to ensure that the particles are mainly within the unbreakable region. This finding has great significance for guiding acoustic agglomeration experiments.
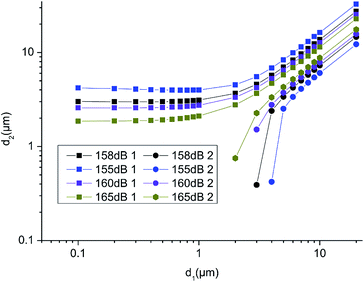 | ||
| Fig. 15 Calculated breakable and unbreakable regions of two particles under different SPLs. (f = 2000 Hz, z = 2 nm, at the antinode). | ||
Studies have shown that the agglomeration efficiency and collision efficiency of particles increases with an increase of SPL,27,48,49 because the velocity of the gas medium correspondingly increases rapidly, which leads to an increase in the relative motion speed between the particles. However, when particles collide and form aggregates under the action of a high-intensity sound wave field, the aggregates are easily separated if the SPL is too high. Therefore, for particles with a certain size distribution, an optimal SPL exists that balances between acoustic agglomeration and separation.
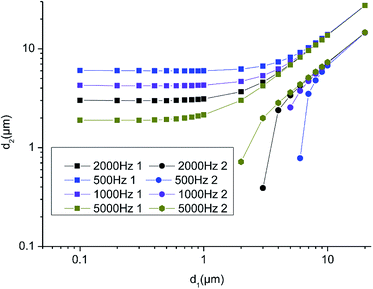 | ||
| Fig. 16 Calculated breakable and unbreakable regions of two particles under different frequencies. (SPL = 158 dB, z = 2 nm, at the antinode). | ||
Many studies have been conducted to determine the optimum frequency for acoustic agglomeration, but no agreement has been reached due to the varied experimental conditions.11,46,50,51 For fly-ash particles, Wang's experimental results revealed that low frequency (500–3000 Hz) was better than high frequency (10 and 20 kHz).46 The overall influence of frequency is attributed to the combination of acoustic agglomeration and separation, and therefore low frequency may perform more favorably for fly-ash particles.
5. Conclusions
A high-speed camera was used to observe the movement of sound-exposed particles. Particles vibrated back and forth with different velocities when they were of different sizes. The agglomeration and separation phenomena of the particles were directly observed.A computational model was established to analyze the forces on particles. COMSOL Multiphysics software was employed to simulate the relative movements and positions of two particles. The simulation results are in close agreement with the experimental results, indicating that the theoretical models are accurate.
Whether an aggregate consisting of two particles will be dispersed by a sound wave was calculated. Critical curves that separated the breakable and non-breakable regions were obtained. The findings revealed that, when the size difference of the particles is within a specified limit, the particles will not separate, otherwise, the agglomerates can be separated. The non-breakable region decreases with the increase of SPL and frequency.
Observation of the motions of particles helps to deepen understanding of acoustic agglomeration and separation processes taking place in the agglomeration chamber. Calculation of the conditions under which particles can separate can guide research designs to enhance acoustic agglomeration. Thus, the present study makes a notable contribution to research on acoustic agglomeration and separation.
Conflicts of interest
There are no conflicts to declare.References
- N. T. K. Oanh, N. Upadhyay, Y. H. Zhuang, Z. P. Hao, D. V. S. Murthy, P. Lestari, J. T. Villarin, K. Chengchua, H. X. Co, N. T. Dung and E. S. Lindgren, Atmos. Environ., 2006, 40, 3367–3380 CrossRef CAS.
- M. Kwauk, Powder Technol., 2003, 137, 2–28 CrossRef CAS.
- V. C. Srivastava, RSC Adv., 2012, 2, 759–783 RSC.
- X. Mao, Y. Si, Y. C. Chen, L. P. Yang, F. Zhao, B. Ding and J. Y. Yu, RSC Adv., 2012, 2, 12216–12223 RSC.
- L. J. Liu, X. X. Li, H. Wang, B. Xue, X. M. Zheng and M. Chen, RSC Adv., 2015, 5, 40012–40017 RSC.
- Z. Yang, C. Zheng, X. Zhang, Q. Chang, W. Weng, Y. Wang and X. Gao, RSC Adv., 2018, 8, 59–66 RSC.
- Q. Li, Y. Y. Xu, H. H. Wei and X. F. Wang, RSC Adv., 2016, 6, 65275–65281 RSC.
- A. Jaworek, A. Krupa and T. Czech, J. Electrost., 2007, 65, 133–155 CrossRef CAS.
- T. L. Hoffmann, Ultrasonics, 2000, 38, 353–357 CrossRef CAS PubMed.
- T. L. Hoffmann, W. Chen, G. H. Koopmann, A. W. Scaroni and L. Song, J. Sound Vib., 1993, 115, 232–240 Search PubMed.
- J. A. Gallego-Juárez, E. Riera-Franco De Sarabia, G. RodrÍguez-Corral, T. L. Hoffmann, J. C. Gálvez-Moraleda, J. J. RodrÍguez-Maroto, F. J. Gomez-Moreno, A. Bahillo-Ruiz, M. Martin-Espigares and M. Acha, Environ. Sci. Technol., 1999, 33, 3843–3849 CrossRef.
- J. Liu, G. Zhang, J. Zhou, J. Wang, W. Zhao and K. Cen, Powder Technol., 2009, 193, 20–25 CrossRef CAS.
- J. Liu, J. Wang, G. Zhang, J. Zhou and K. Cen, J. Environ. Sci., 2011, 23, 1845–1851 CrossRef CAS.
- H. Xu, Z. Luo, P. Wang, F. Xu and K. Cen, J. Zhejiang Univ., 2007, 41, 1168–1171 CAS.
- D. Zhou, Z. Luo, J. Jiang, H. Chen, M. Lu and M. Fang, Powder Technol., 2016, 289, 52–59 CrossRef CAS.
- L. Song, G. H. Koopmann and T. L. Hoffmann, J. Vib. Acoust., 1994, 116, 208–214 CrossRef.
- E. P. Mednikov, Acoustic Coagulation and Precipitation of Aerosols, Consultants Bureau, 1965 Search PubMed.
- G. Zhang, J. Liu, J. Wang, J. Zhou and K. Cen, Chin. Sci. Bull., 2012, 57, 2404–2412 CrossRef CAS.
- R. Kacianauskas, V. Rimsa, A. Kaceniauskas, A. Maknickas, D. Vainorius and R. Pacevic, Chem. Eng. Res. Des., 2018, 136, 548–563 CrossRef CAS.
- D. Zhou, Z. Luo, M. Fang, M. Lu, J. Jiang, H. Chen and K. Cen, Appl. Energy, 2017, 185, 2245–2250 CrossRef.
- G. Zhang, L. Zhang, J. Wang, Z. Chi and E. Hu, Powder Technol., 2018, 323, 393–402 CrossRef CAS.
- A. Maknickas, D. Markauskas and R. Kačianauskas, Part. Sci. Technol., 2016, 34, 453–460 CrossRef CAS.
- I. González, J. A. Gallego-Juárez and E. Riera, J. Aerosol Sci., 2003, 34, 1611–1631 CrossRef.
- D. Markauskas, R. Kačianauskas and A. Maknickas, Adv. Powder Technol., 2015, 26, 698–704 CrossRef.
- G. Zhang, L. Zhang, J. Wang and Z. Chi, Appl. Math. Model., 2018, 61, 124–140 CrossRef.
- F. Fan, M. Zhang, Z. Peng, J. Chen, M. Su, B. Moghtaderi and E. Doroodchi, Aerosol Air Qual. Res., 2017, 17, 1073–1083 CrossRef.
- S. Dong, B. Lipkens and T. M. Cameron, J. Aerosol Sci., 2006, 37, 540–553 CrossRef CAS.
- G. Shen, X. Huang, C. He, S. Zhang and L. An, Powder Technol., 2018, 325, 145–150 CrossRef CAS.
- G. Zhang, PhD. thesis, Zhejiang University, 2010.
- G. Zhang, J. Wang, Z. Chi and E. Hu, Chem. Eng. Sci., 2018, 187, 342–353 CrossRef CAS.
- G. Yao, PhD. thesis, Southeast University, 2006.
- T. L. Hoffmann and G. H. Koopmann, J. Acoust. Soc. Am., 1996, 99, 2130–2141 CrossRef.
- T. L. Hoffmann and G. H. Koopmann, Rev. Sci. Instrum., 1994, 65, 1527–1536 CrossRef CAS.
- I. Gonzalez, T. L. Hoffmann and J. A. Gallego, Acta Acust. Acust., 2002, 88, 19–26 Search PubMed.
- L. P. Shen, X. Q. Song, M. Iguchi and F. Yamamoto, Pattern Recognit. Lett., 2000, 21, 21–30 CrossRef.
- H. L. Zhao, C. F. You, H. Y. Qi and X. C. Xu, Atmos. Environ., 2005, 39, 3015–3021 CrossRef CAS.
- E. Riera, I. Gonzalez-Gomez, G. Rodriguez and J. A. Gallego-Juarez, Power Ultrasonics: Applications of High-Intensity Ultrasound, Woodhead Publishing, 2015 Search PubMed.
- C. A. Ho and M. Sommerfeld, Chem. Eng. Sci., 2002, 57, 3073–3084 CrossRef CAS.
- L. Song, PhD. thesis, The Pennsylvania State University, 1990.
- A. A. Zaidi, T. Tsuji and T. Tanaka, Procedia Eng., 2015, 102, 1656–1666 CrossRef.
- G. Du, Z. Zhu and X. Gong, Fundamentals of Acoustics, Nanjing University Press, 2001 Search PubMed.
- C. Knoop and U. Fritsching, Ultrasonics, 2014, 54, 763–769 CrossRef CAS PubMed.
- C. Zheng, C. Liang, S. Liu, Z. Yang, Z. Shen, Y. Gao, Y. Zhang and X. Gao, Powder Technol., 2018, 340, 543–552 CrossRef CAS.
- D. P. Debrincat, C. B. Solnordal and J. S. J. Van Deventer, Powder Technol., 2008, 182, 388–397 CrossRef CAS.
- J. Q. Feng and D. A. Hays, Powder Technol., 2003, 135–136, 65–75 CrossRef CAS.
- J. Wang, J. Liu, G. Zhang, J. Zhou and K. Cen, Powder Technol., 2011, 210, 315–322 CrossRef CAS.
- J. Wang, PhD. thesis, Zhejiang University, 2012.
- K. Zu, Y. Yao, M. Cai, F. Zhao and D. Cheng, J. Aerosol Sci., 2017, 114, 62–76 CrossRef CAS.
- M. Amiri, A. Sadighzadeh and C. Falamaki, Aerosol Air Qual. Res., 2016, 16, 3012–3025 CrossRef.
- E. R. F. de Sarabia, L. Elvira-Segura, I. Gonzalez-Gomez, J. J. Rodriguez-Maroto, R. Munoz-Bueno and J. L. Dorronsoro-Areal, Ultrasonics, 2003, 41, 277–281 CrossRef.
- R. Tiwary and G. Reethof, J. Vib. Acoust. Stress Reliab. Des., 1987, 109, 185–191 CrossRef.
| This journal is © The Royal Society of Chemistry 2019 |

