DOI:
10.1039/C8RA08916G
(Paper)
RSC Adv., 2019,
9, 5218-5223
Effects of dairy manure biochar on adsorption of sulfate onto light sierozem and its mechanisms
Received
28th October 2018
, Accepted 29th January 2019
First published on 12th February 2019
Abstract
The adsorption of nitrogen and phosphorous nutrients on biochar and even biochar–soil mixtures was investigated. However, the situation of sulfur was not very clear. Here, sulfate (SO42−) adsorption onto dairy manure biochar obtained at 700 °C (DMBC700), soil (light sierozem) and a 1![[thin space (1/6-em)]](https://www.rsc.org/images/entities/char_2009.gif) :9 (w/w) biochar–soil mixture (DMBC700-soil) was investigated using batch experiments. The contact time, sulfate concentration, and solution pH value were chosen as the main factors; their effects on sulfate adsorption were tested, and the kinetics and isotherms were also investigated. Fourier transform infrared (FTIR) and X-ray diffraction (XRD) spectroscopies were used to characterize DMBC700 and soil before and after adsorbing sulfate, respectively, and to analyze the mechanisms of adsorption. The results showed that the adsorption kinetics were well described by the pseudo-second-order model, whereas the Langmuir and Freundlich models fitted well with the equilibrium data. DMBC700 modification did not increase the adsorption capacity of light sierozem for sulfate. When the pH values of the initial solution were increased, all the adsorption capacities of sulfate onto DMBC700, light sierozem and light sierozem with DMBC700 decreased. The electrostatic interaction was the main force for the adsorption of sulfate onto DMBC700, whereas both electrostatic interaction and formation of poorly soluble CaSO4 were the main forces for adsorption of sulfate onto light sierozem. DMBC700 was found to have negative effect on sulfate adsorption onto light sierozem.
:9 (w/w) biochar–soil mixture (DMBC700-soil) was investigated using batch experiments. The contact time, sulfate concentration, and solution pH value were chosen as the main factors; their effects on sulfate adsorption were tested, and the kinetics and isotherms were also investigated. Fourier transform infrared (FTIR) and X-ray diffraction (XRD) spectroscopies were used to characterize DMBC700 and soil before and after adsorbing sulfate, respectively, and to analyze the mechanisms of adsorption. The results showed that the adsorption kinetics were well described by the pseudo-second-order model, whereas the Langmuir and Freundlich models fitted well with the equilibrium data. DMBC700 modification did not increase the adsorption capacity of light sierozem for sulfate. When the pH values of the initial solution were increased, all the adsorption capacities of sulfate onto DMBC700, light sierozem and light sierozem with DMBC700 decreased. The electrostatic interaction was the main force for the adsorption of sulfate onto DMBC700, whereas both electrostatic interaction and formation of poorly soluble CaSO4 were the main forces for adsorption of sulfate onto light sierozem. DMBC700 was found to have negative effect on sulfate adsorption onto light sierozem.
Introduction
Sulfur is an essential nutrient; although its required amount is less than those of nitrogen, phosphorous and potassium, it plays an important role in plant growth. This is because some proteins and amino acids contain sulphur, and enzymatic reactions are based on sulfur sites; moreover, syntheses of chlorophyll, sitosterone, glutathione and coenzyme need a sulfur medium, and sulfur affects plant growth regulation, detoxification, defence and resistance as well as crop yield and quality.1
Biochar is a byproduct of the biomass pyrolysis process under limited oxygen conditions.2,3 Amendment of biochar into soils is considered to be a promising alternative for carbon sequestering, soil improvement and crop yield enhancement.4 In recent years, biochar has attracted increasing attention of scientists because of its adsorption ability for chemicals including nutrients. Thus, biochar amendment into soils might influence nutrient phytoavailability.5–7 Recently, the adsorption of nitrogen and phosphorus nutrients onto biochar has been investigated.8–14 Some positive results were observed with biochar enhancing NH4+, NO3−, and PO43− ion adsorption.9,10,12 However, a few limiting and even negative effects of biochars to fix NO2−, NO3−, and PO43− were reported.13–18 Comparatively, to the best of our knowledge, there are only few reports concerning the effects of biochars on sulfur adsorption and retention in soils.19 The situation of sulfur is not very clear because the adsorptive properties of biochar are largely dependent on the biomass feed type and pyrolysis conditions.
Thus, we prepared a biochar from dairy manure at 700 °C and selected light sierozem as the tested soil. Batch experiments were conducted to investigate sulfate adsorption onto biochar, soil, and biochar–soil mixtures. We aimed to determine the effects of dairy manure biochar on the adsorption of sulfate onto light sierozem and its mechanisms.
Materials and methods
Chemicals and materials
Sodium sulfate with analytical purity was obtained from Tianjin Guangfu Fine Chemical Institute, China. Deionized water was used in all experiments.
The dairy manure was collected from a farm in Anning District, Lanzhou City, China. The manure was air-dried, crushed by a grinder and passed through an 80 mesh sieve. The sample was put into a crucible, compacted, and covered with a lid. Then, the sample was heated in a muffle furnace at 700 °C for 6 h to pyrolyze the manure. After cooling to room temperature, the obtained biochar was passed through an 80 mesh sieve and labelled as DMBC700. The pH value of DMBC700 was measured using a pH meter (PHS-3C, Shanghai Electronic and Scientific Instrument Co., China) with 1:2.5 (w/w) suspension of the biochar in deionized water. The total C, H, O, N and ash contents in biochar were determined with an elemental analyzer (Vario EL, Elementar, Germany), and the atomic ratios were calculated. Brunauer–Emmett–Teller (BET) surface area was obtained from N2 adsorption at 77 K using Quantachrome Autosorb-1 (Quantachrome, USA). The basic physical and chemical properties of biochar are as follows: pH, 10.15; element composition (%): C 45.86, H 0.52, O 12.51, N 1.08, ash 39.28; atomic ratios: O/C 0.27, H/C 0.01, (O + N)/C 0.30; and specific surface area, 73.97 m2 g−1.
The light sierozem soil was sampled from the topsoil (0–20 cm) in a farmland in Yuzhong County, Lanzhou City, Gansu Province, China. After removing the impurities, the soil was air-dried, mixed thoroughly and passed through an 80 mesh sieve. The organic matter (OM) in the soil was analysed using the potassium dichromate oxidation method by a UV-1800 spectrophotometer (Shanghai Spectrum Instrument Co. Ltd., China). The pH value of the soil was measured on the pH meter with 1:5 (w/w) suspension of soil in deionized water. Cation exchange capacity (CEC) was determined according to the calcium acetate method (China NY/T1121.5-2006). The efficient sulfur (ES) was extracted using NaHCO3 and determined using the barium sulfate turbidity method. The basic physical and chemical properties of soil are as follows: organic matter (OM), 14.12%; pH, 7.97; cation exchange capacity (CEC), 5.65 cmol kg−1; and efficient sulfur (ES), 36.7 mg kg−1.
Batch adsorption
The contact time, initial sulfate concentration and solution pH value were selected as the main factors, and batch adsorption experiments were conducted in the general process: a series of 0.1 g DMBC700, DMBC700-soil (1:9 (w/w)) or soil were weighed into 50 mL flasks containing 20 mL sodium sulfate solution. The samples were then put into a reciprocating shaker (THZ82, Jiangsu Jintan Youlian Instrument Institute, China) and equilibrated for a certain period at 25 °C. Then, the liquid–solid mixtures were filtered through a 0.45 μm membrane, and the sulfate concentration in filtrate was determined; here, the filtered single DMBC700 or light sierozem soil after adsorption in 400 mg L−1 of sodium sulfate solution for 16 h at 25 °C and pH 7 was air-dried and characterized by FTIR and XRD. The contact time, initial sulfate concentration and solution pH value were maintained as 20 h, 50 mg L−1 and 7 unless tested as a factor.
FTIR and XRD characterization
FTIR spectra were obtained in the range of 500–4000 cm−1 of wave number on an IR spectrometer (Nicolet Nexus 870, USA). XRD was conducted on an X-ray diffractometer (PANalytical X'Pert Pro) over the 2θ range of 3–90° at a rate of 1°·min−1 with a step size of 0.02°.
Analysis methods
The indirect atomic absorbance spectrometry (AAS) method20 was used to determine the sulfate concentration on an atomic absorbance spectrometer (SP-3520AAC2T1, Shanghai Spectrum Instrument Company, China). The adsorbed amount of sulfate (mg g−1) was calculated from the difference between the initial and equilibrium sulfate concentrations (mg L−1), solution volume (L) and adsorbent mass (g) in terms of the overall adsorbent mass. Nonlinear fitting was applied to obtain the regression parameters in kinetics and isotherm equations using OriginPro 8.0.
Results and discussion
Effect of contact time and adsorption kinetics
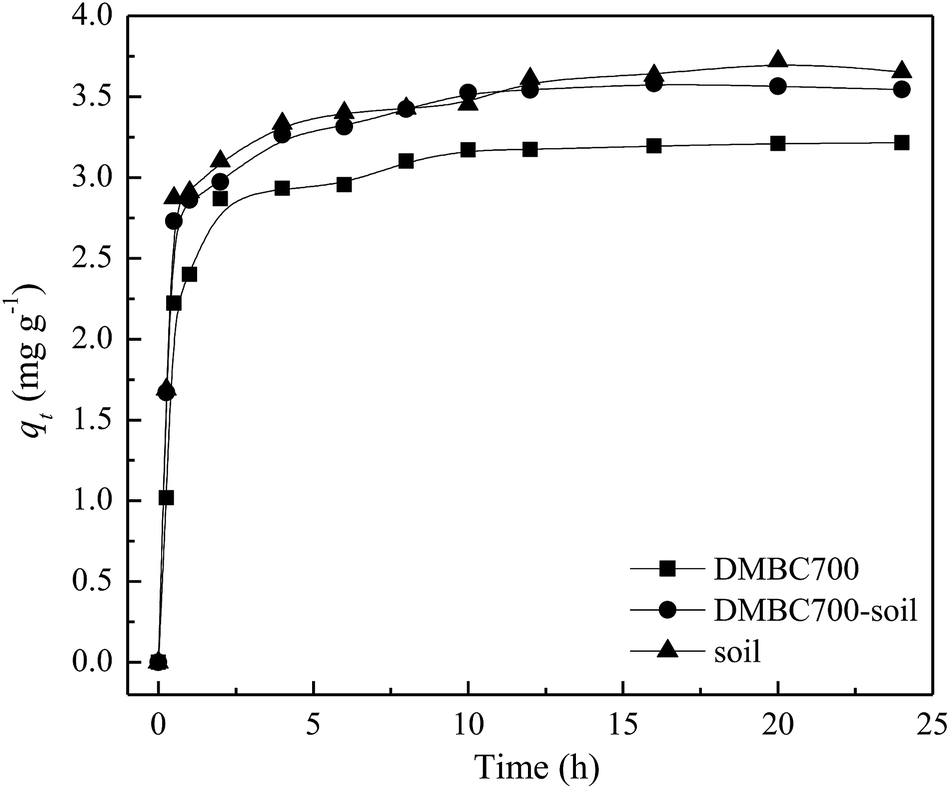
The effects of contact time on absorption amounts of sulfate onto DMBC700, soil and soil with DMBC700 are shown in Fig. 1. It can be seen from Fig. 1 that the adsorption rate is fast in the initial 2 h, at which the adsorption amounts are 89.21, 84.84 and 83.89% of the equilibrium adsorption capacity. With increase in contact time, the adsorption amounts onto DMBC700, soil and soil with DMBC700 increased slightly and levelled off at about 3.65, 3.54 and 3.21 mg g−1, respectively. It was clear that the adsorption capacity of sulfate onto soil did not improve in the presence of DMBC700, indicating that DMBC700 may play a negative role in sulfate fixation after its considerable amendment into soils. Li et al. found that switchgrass and water oak biochars and biosolid biochar have limited and negative retention for NO2− and NO3−.13 Liu et al. found that within a certain range of phosphate concentration in the equilibrium solution, the amount of phosphate adsorbed by three red soils decreased and the corresponding amount of phosphate desorbed increased with increasing amendment rate of rice straw biochar.14 The adsorption capacity of phosphate onto the engineered cow dung biochar (Mg-loaded) reached 345 mg g−1, which was significantly higher than those previously obtained under the same initial P concentrations.12 The adsorption capacities of biochars for anionic nutrients were largely different, which might be due to the biochar's surface components and properties.
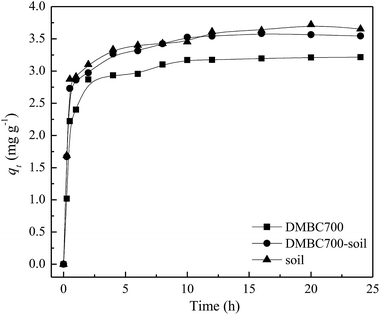 |
| | Fig. 1 Effect of time on sulfate adsorption onto DMBC700, soil and soil with DMBC700 (C0 = 50 mg L−1, pH = 7, T = 25 °C). | |
Pseudo-first-order (1), pseudo-second-order (2), and Elovich (3) models were used to simulate the experimental kinetics, which can be expressed by the following equations:
| | |
dqt/dt = k2(qe − qt)2
| (2) |
| | |
dqt/dt = αexp(−βqt)
| (3) |
Here, qt (mg g−1) and qe (mg g−1) are the adsorbed amounts of sulfate at time t (h) and at equilibrium, respectively; k1 (h−1) and k2 (g mg−1 h−1) are the adsorption rate constants of pseudo-first-order and pseudo-second-order models, respectively, α (mg g−1 h−1) is the initial sorption rate, and β (g mg−1) is the desorption constant. The fitting parameters of kinetic models are listed in Table 1. The R2 values (0.9426, 0.9343 and 0.9118) obtained from the pseudo-second-order model fitting for the adsorption of sulfate onto DMBC700, soil and soil with DMBC700 were higher than those of the pseudo-first-order and Elovich models. Moreover, the equilibrium adsorbed amounts of sulfate calculated from the pseudo-second-order model (qe,cal) were much closer to the experimental values shown in Fig. 1. This indicated that the pseudo-second-order model provides the best fit with the experimental data. Hafshejani et al. found a pseudo-second-order kinetic model, which could fit well with the experimental data for the adsorption of nitrate onto modified sugarcane bagasse biochar.8 Similar results were also reported by Takaya et al. for the adsorption of phosphate ions onto chars.10
Table 1 Kinetic parameters for sulfate adsorption onto DMBC700, soil and soil with DMBC700
| Model |
Parameter |
DMBC700 |
DMBC700-soil |
Soil |
| Pseudo-first-order |
qe,cal (mg g−1) |
3.11 |
3.40 |
3.46 |
| k1 (h−1) |
2.10 |
2.94 |
3.07 |
| R2 |
0.919 |
0.837 |
0.828 |
| Pseudo-second-order |
qe,cal (mg g−1) |
3.26 |
3.55 |
3.61 |
| k2 (g mg−1 h−1) |
0.864 |
1.21 |
1.24 |
| R2 |
0.943 |
0.934 |
0.912 |
| Elovich |
α (mg g−1 h−1) |
0.022 |
0.001 |
0.003 |
| β (g mg−1) |
0.003 |
0.004 |
0.003 |
| R2 |
0.801 |
0.841 |
0.819 |
Effect of sulfate concentration and adsorption isotherms
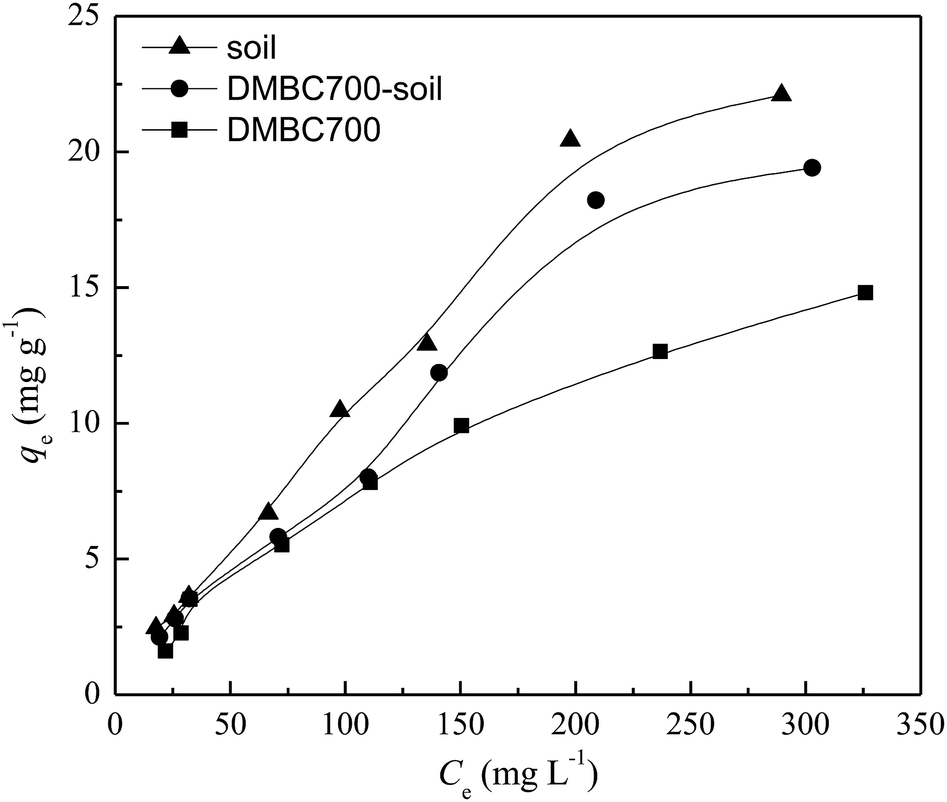
The relationships between the adsorption capacities of DMBC700, soil and soil with DMBC700 for sulfate and the equilibrium sulfate concentrations are shown in Fig. 2. The adsorption amounts of sulfate onto DMBC700, soil and soil with DMBC700 increased with the sulfate concentration. This might be due to the higher concentration gradients in the systems, which resulted in higher occupation of the reactive sorption sites.10,21 Clearly, the adsorption amounts of sulfate onto soil were larger than those onto DMBC700 and soil with DMBC700.
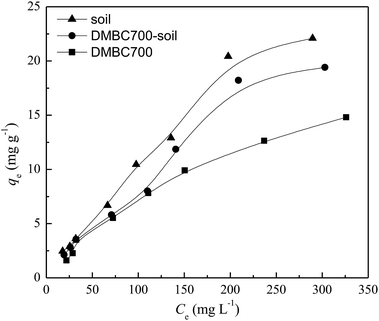 |
| | Fig. 2 Effect of equilibrium concentration on sulfate adsorption onto DMBC700, soil and soil with DMBC700 (t = 16 h, pH = 7, T = 25 °C). | |
Three models Langmuir (4), Freundlich (5), and Temkin (6) 22 were used to fit the sulfate adsorption equilibrium described in Fig. 2:
| | |
qe = qmKLCe/(1 + KLCe)
| (4) |
| | |
qe = BlnACe
| (6) |
Here,
qe is the equilibrium adsorption capacity of sulfate (mg g
−1),
Ce is the equilibrium sulfate concentration in an aqueous solution (mg L
−1),
KL is the Langmuir constant (L mg
−1),
KF (mg g
−1 L mg)
1/n is the Freundlich constant,
n (dimensionless) is the adsorption intensity factor,
qm is the maximum adsorption capacity (mg g
−1),
B is the equilibrium binding constant (L mol
−1), and
A is a constant related to heat adsorption. The regression results are listed in
Table 2. According to the obtained
R2 values, sulfate adsorption onto DMBC700, soil and soil with DMBC700 could fit well with the Freundlich and Langmuir models. In some cases, it was found that the Langmuir model was better than the Freundlich one for fitting phosphate,
9,11,21 nitrate
8 and ammonium
13 species on biochars, while the Freundlich model was more suitable for fitting the adsorption of phosphate on several chars.
10 Liu
et al. found that depending on the soil pH, the Temkin isotherms for P sorption in low-pH soils revealed high
R2 values.
14
Table 2 Isotherm parameters for sulfate adsorption onto DMBC700, soil and soil with DMBC700
| Model |
Parameter |
DMBC700 |
DMBC700-soil |
Soil |
| Langmuir |
qe,cal (mg g−1) |
78.1 |
78.4 |
83.0 |
| KL (L mg−1) |
0.00087 |
0.00088 |
0.00096 |
| R2 |
0.960 |
0.978 |
0.986 |
| Freundlich |
KF (L mg−1) |
0.219 |
0.121 |
0.144 |
| N |
1.41 |
1.17 |
1.18 |
| R2 |
0.942 |
0.975 |
0.981 |
| Temkin |
A (L mg−1) |
0.039 |
0.034 |
0.033 |
| B |
5.01 |
6.78 |
7.77 |
| R2 |
0.971 |
0.923 |
0.913 |
Effect of solution pH value and adsorption mechanisms
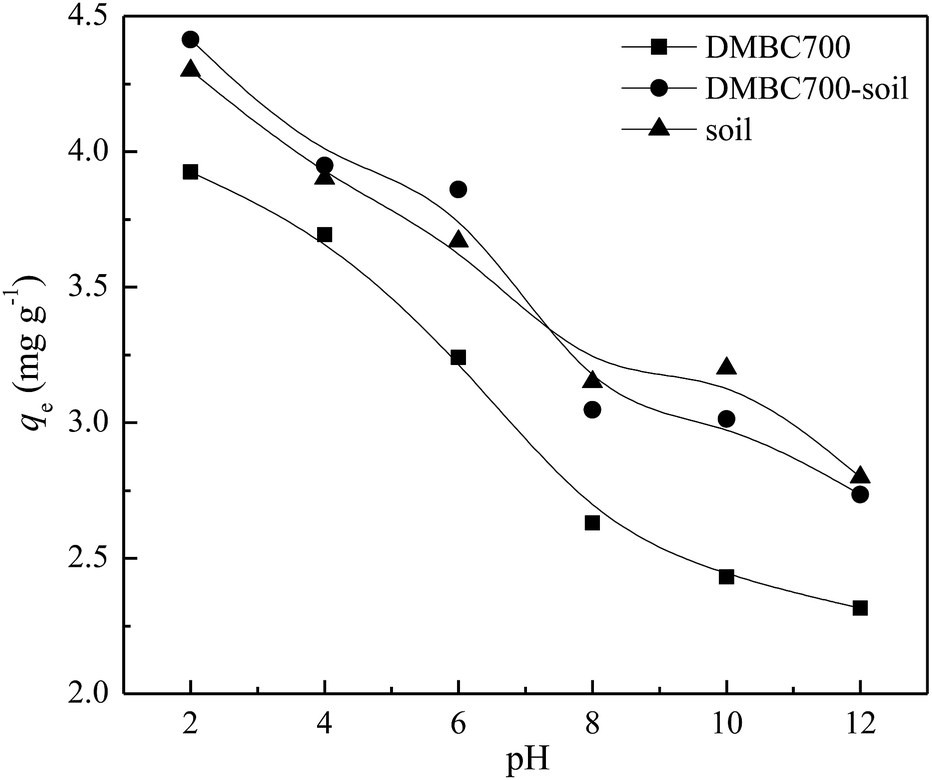
Fig. 3 shows that the sulfate adsorption amounts change with the initial solution pH values. The adsorbed amounts of sulfate onto DMBC700, soil and soil with DMBC700 decreased gradually when the pH values increased from 2 to 12. This might be attributed to the electrostatic interactions between sulfate and the charged sorbent surfaces. In general, the charges loaded on the soil particle surfaces are classified as variable and constant ones. The later derived from the isomorphous replacement in mineral formation is not affected by the change in pH. However, the former arising from organic matters, metal oxides, hydrated metal oxides, etc. changes with the solution pH value, due to which the total charge of soil particle surfaces can be positive, zero or negative.23 Various functional groups on the surfaces of biochar may influence sorption by the nature of their surface charge. Similar to that observed for oxide surfaces, the charge on the functional groups may change depending upon the pH value of the solution, thus affecting sorption behaviour.4,24 At lower pH values, more positively charged sites are present on DMBC700 and soil surfaces. Thus, more sulfate ions can be adsorbed.25,26 At pH 2, the adsorbed amounts of sulfate on DMBC700, soil and soil with DMBC700 were 3.93, 4.30 and 4.41 mg g−1, respectively. With increase in pH, the soil and DMBC700 surfaces became more negatively charged and thus, the adsorbed amounts of sulfate decreased. Meanwhile, the reduction in adsorbed amounts of sulfate was partially attributed to the competition of hydroxyl ion adsorption onto soil and DMBC700 with the increase in pH. At pH 12, the adsorbed amounts of sulfate on DMBC700, soil and soil with DMBC700 were 2.31, 2.80 and 2.73 mg g−1, respectively. A similar trend was also found in recent reports for nitrate adsorption onto sugarcane bagasse biochar8 and phosphate adsorption11 onto chars.
 |
| | Fig. 3 Effect of pH value on sulfate adsorption onto DMBC700, soil and soil with DMBC700 (C0 = 50 mg L−1, t = 16 h, T = 25 °C). | |
The FTIR spectra of DMBC700 and soil before and after adsorption of sulfate are shown in Fig. 4 and 5, respectively. It is found that the main transmittance peak intensity and the corresponding wave number did not change significantly. It was indicated that the sulfate adsorption was not due to the interaction between the surface functional groups and sulfate ions.
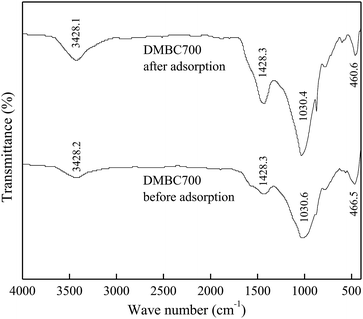 |
| | Fig. 4 FTIR spectra of DMBC700 before and after adsorption. | |
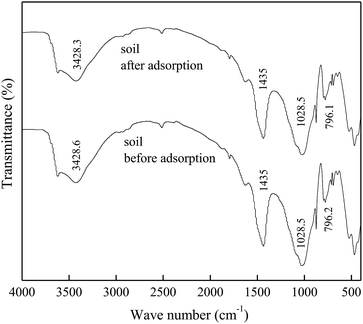 |
| | Fig. 5 FTIR spectra of soil before and after adsorption. | |
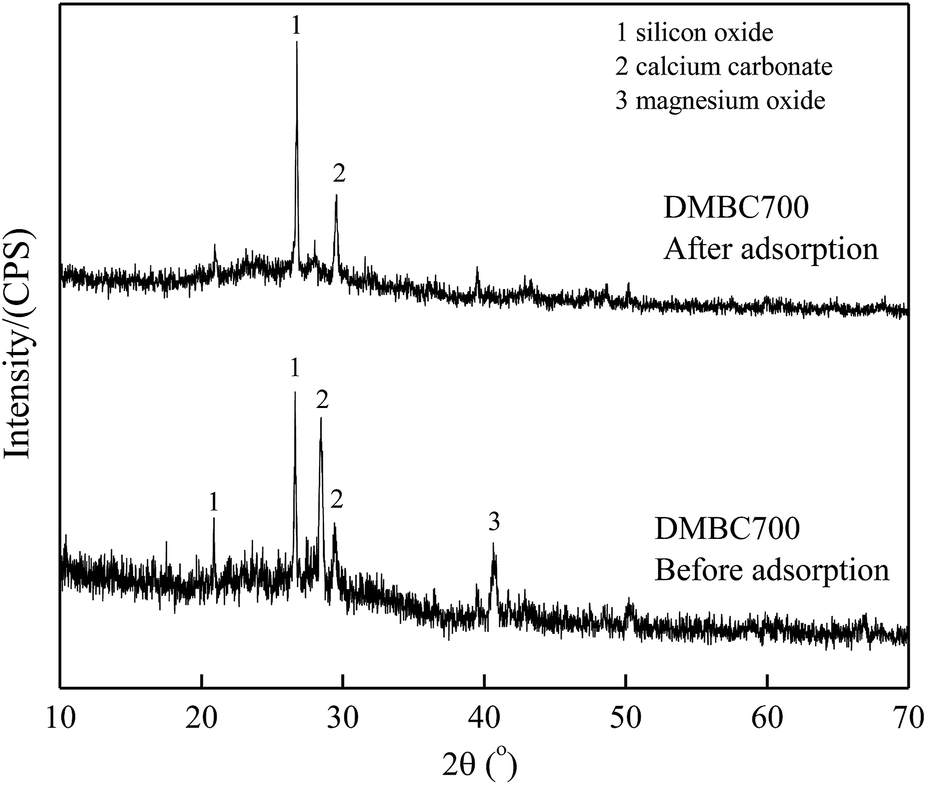
Fig. 6 and 7 show the XRD spectra of DMBC700 and soil before and after adsorbing sulfate, respectively. DMBC700 showed a somewhat crystalline structure with a higher mineral content. The presence of quartz, calcite and periclase was confirmed. However, no new mineral peak occurred in the XRD spectrum of DMBC700 after adsorbing sulfate, indicating that DMBC700 and sulfate ions did not react with the newly formed precipitates. The main mineral components of soil were quartz, calcite, kaolinite, bog iron ore and muscovite. A strong and broad peak at 2θ = 28.07° indicated the presence of sodium sulfate, which might be due to the reaction between the irregular clay mineral surface and sulfate ions. After sulfate adsorption, a strong CaSO4 peak occurred at 2θ = 20.54°. Therefore, it was concluded that one of the sulfate ion adsorptions could be attributed to the formation of poorly soluble calcium sulfate. As a calcareous soil, the carbonate content in light sierozem is high. Sulfate ions could thus react with the calcium ions in calcium carbonate to form a precipitate.23
 |
| | Fig. 6 XRD spectra of DMBC700 before and after adsorption. | |
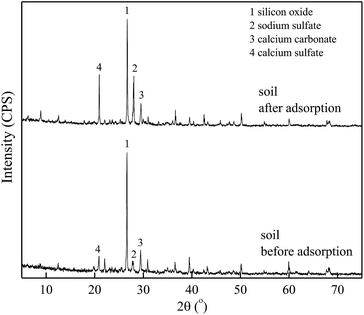 |
| | Fig. 7 XRD spectra of soil before and after adsorption. | |
Conclusions
The kinetics of sulfate adsorption onto DMBC700, soil and soil with DMBC700 could be described using a pseudo-second-order model, while the isotherms could fit well with Langmuir and Freundlich models. On the basis of the results of the effect of pH values on adsorption and FTIR and XRD analyses before and after adsorption, it was shown that the main driving force of sulfate adsorption onto DMBC700 was the electrostatic interaction; moreover, for sulfate adsorption onto light sierozem, both electrostatic interaction and formation of poorly soluble CaSO4 were the major forces. However, DMBC700 amendment did not enhance the adsorption capacity of light sierozem for sulfate ions.
Conflicts of interest
There are no conflicts to declare.
Acknowledgements
This research was financially supported by the National Natural Science Foundation of China (21467013, 21167007, 51766008).
Notes and references
- E. Frossard, E. K. Bünemann, A. Oberson and M. A. Kertesz, Phosphorus and Sulfur in Soil, CRC Press, 2012 Search PubMed.
- J. Lehmann, Nature, 2007, 447, 143–144 CrossRef CAS.
- B. Yousaf, G. Liu, Q. Abbas, M. U. Ali, R. Wang, R. Ahmed, C. Wang, M. I. Al-Wabel and A. R. A. Usman, J. Cleaner Prod., 2018, 195, 458–469 CrossRef CAS.
- J. Lehmann and S. Joseph, Biochar for Environmental Management: Science and Technology, Earthscan, London, 2009 Search PubMed.
- Z. M. Lan, C. R. Chen, M. R. Rashti, H. Yang and D. K. Zhang, Sci. Total Environ., 2017, 576, 559–571 CrossRef CAS PubMed.
- F. Reverchon, R. C. Flicker, H. Yang, G. Yan, Z. Xu, C. Chen, S. H. Bai and D. Zhang, Biol. Fertil. Soils, 2014, 50, 275–283 CrossRef CAS.
- F. Reverchon, H. Yang, T. Y. Ho, G. Yan, J. Wang, Z. Xu, C. Chen and D. Zhang, Environ. Sci. Pollut. Res., 2015, 22, 2138–2144 CrossRef CAS PubMed.
- L. D. Hafshejani, A. Hooshmand, A. A. Naseri, A. S. Mohammadi, F. Abbasi and A. Bhatnagar, Ecol. Eng., 2016, 95, 101–111 CrossRef.
- K.-W. Jung, K. Kim, T.-U. Jeong and K.-H. Ahn, Bioresour. Technol., 2016, 200, 1024–1028 CrossRef CAS PubMed.
- C. A. Takaya, L. A. Fletcher, S. Singh, K. U. Anyikude and A. B. Ross, Chemosphere, 2016, 145, 518–527 CrossRef CAS.
- P. A. Trazzi, J. J. Leahy, M. H. B. Hayes and W. Kwapinski, J. Environ. Chem. Eng., 2016, 4, 37–46 CrossRef CAS.
- Q. Chen, J. Qin, P. Sun, Z. Cheng and G. Shen, J. Cleaner Prod., 2018, 172, 2009–2018 CrossRef CAS.
- S. Li, V. Barreto, R. Li, G. Chen and Y. P. Hsieh, J. Anal. Appl. Pyrolysis, 2018, 133, 136–146 CrossRef CAS.
- Y. Liu, Z.-Q. Zhu, X.-S. He, C. Yang, Y.-Q. Du, Y.-D. Huang, P. Su, S. Wang, X.-X. Zheng and Y.-J. Xue, Chemosphere, 2018, 207, 267–277 CrossRef CAS PubMed.
- S. E. Hale, V. Alling, V. Martinsen, J. Mulder, G. D. Breedveld and G. Cornelissen, Chemosphere, 2013, 91, 1612–1619 CrossRef CAS PubMed.
- C. C. Hollister, J. J. Bisogni and J. Lehmann, J. Environ. Qual., 2013, 42, 137–144 CrossRef CAS PubMed.
- J. Jiang, M. Yuan, R. Xu and D. L. Bish, Soil Tillage Res., 2015, 146, 139–147 CrossRef.
- J. Yang, H. Li, D. Zhang, M. Wu and B. Pan, Sci. Total Environ., 2017, 592, 758–765 CrossRef CAS PubMed.
- B. Zhao, X. Nan, H. Xu, T. Zhang and F. Ma, J. Environ. Manage., 2017, 201, 309–314 CrossRef CAS PubMed.
- Z. L. Ni, F. B. Tang, M. H. Qu and R. H. Mo, Chin. J. Soil Sci., 2012, 43, 1136–1138 CAS.
- Z. Wang, E. Nie, J. Li, M. Yang, Y. Zhao, X. Luo and Z. Zheng, Environ. Sci. Pollut. Res., 2011, 19, 2908–2917 CrossRef PubMed.
- Y. Yao, B. Gao, J. Chen and L. Yang, Environ. Sci. Technol., 2013, 47, 8700–8708 CrossRef CAS PubMed.
- X. Li, Soil Chemistry, High Education Press, Beijing, 2001 Search PubMed.
- Q. Abbas, G. Liu, B. Yousaf, M. U. Ali, H. Ullah, M. A. M. Munir and R. Liu, J. Anal. Appl. Pyrolysis, 2018, 134, 281–292 CrossRef CAS.
- Z. Cao, C. Meng and Z. Hu, Sulfur in Agriculture and Environment of China, Science Press, Beijing, 2011 Search PubMed.
- F. F. Ma, B. W. Zhao, J. R. Diao, J. K. Zhong and A. B. Li, Environ. Sci., 2015, 36, 1678–1685 CAS.
|
| This journal is © The Royal Society of Chemistry 2019 |
Click here to see how this site uses Cookies. View our privacy policy here. 
 Open Access Article
 This Open Access Article is licensed under a
  *,
Huan Xu,
Fengfeng Ma,
Tao Zhang and
Xujun Nan
*,
Huan Xu,
Fengfeng Ma,
Tao Zhang and
Xujun Nan