 Open Access Article
Developing a CO2 bicarbonation absorber for promoting microalgal growth rates with an improved photosynthesis pathway
Wangbiao Guoa,
Jun Cheng *a,
Yanmei Songa,
Santosh Kumara,
Kubar Ameer Alia,
Caifeng Guob and
Zhanshan Qiaob
aState Key Laboratory of Clean Energy Utilization, Zhejiang University, Hangzhou 310027, China. E-mail: juncheng@zju.edu.cn; Fax: +86 571 87951616; Tel: +86 571 87952889
bOrdos Jiali Spirulina Co., Ltd, Ordos 016199, China
First published on 21st January 2019
Abstract
In order to solve the problems of the short residence time and low utilization efficiency of carbon dioxide (CO2) gas added directly to a raceway pond, a CO2 bicarbonation absorber (CBA) was proposed to efficiently convert CO2 gas and sodium carbonate (Na2CO3) solution to sodium bicarbonate (NaHCO3), which was dissolved easily in the culture medium and left to promote the microalgal growth rate. The CO2 gas reacted with the Na2CO3 solution (initial concentration = 200 mM L−1 and volume ratio in CBA = 60%) for 90 min at 0.3 MPa to give the optimized molar proportion (92%) of NaHCO3 product in total inorganic carbon and increase the microalgal growth rate by 5.0 times. Quantitative label-free protein analysis showed that the expression levels of the photosystem II (PSII) reaction centre protein (PsbH) and PSII cytochrome (PsbV2) in the photosynthesis pathway increased by 4.8 and 3.4 times, respectively, while that of the RuBisCO enzyme (rbcL) in the carbon fixation pathway increased by 3.5 times in Arthrospira platensis cells cultivated with the NaHCO3 product in the CBA at 0.3 MPa.
1. Introduction
Cultivating microalgal for the carbon dioxide (CO2) fixation from coal-fired power plants has been extensively studied in the past few decades. Normally, 1 ton of microalgal can consume 1.83 tons of CO2 with a carbon content of 50% in the microalgal cells. It was reported that around one-third of global CO2 fixation was attributed to the microalgal.1,2 The reason for this is because there is a CO2-concentrating mechanism (CCM) in the pyrenoid organelle of the algal cell that accelerates CO2 assimilation.3,4 According to the CCM, the HCO3− passes successively through the plasma membrane, the chloroplast envelope and the thylakoid membrane and this is mediated by the enzyme, carbonic anhydrase (CA). Then when the HCO3− reaches the thylakoid lumen, it is catalysed to CO2. Finally, the CO2 is fixed by ribulose-1,5-biphosphate carboxylase/oxygenase (RuBisCO) and channelled into the Calvin cycle.1,2 The HCO3− is therefore the dominant type of carbon to be absorbed for photosynthesis in microalgal cells.Normally, the CO2 gas is added directly into the microalgal solution by using an aerator.5–9 Researchers have proposed several aerators10–12 and baffles13–18 for use in the raceway pond (RWP) to increase the CO2 bubble residence time for improving the conversion efficiency of CO2 to HCO3− (CO2 + CO32− + H2O → 2HCO3−). However, the reaction of CO2 and CO32− requires relatively high pressure and sufficient reaction time.19,20 Because the bubble residence time is relatively low (usually several seconds) when the CO2 gas is added directly by the aerator21,22 at atmospheric pressure, and was harmful to the reaction of CO2 and CO32−, most of the CO2 bubbles were emitted to the atmosphere again, causing wastage and low CO2 utilization efficiency. It is also not beneficial for microalgal growth rate.
The CO2 bicarbonation absorber (CBA) has been generally adopted to produce sodium bicarbonate (NaHCO3) in industry.23–26 A gas distributor was needed on the bottom of the CBA to provide a uniform gas flow distribution. The CO2 gas was added to the CBA from the bottom inlet hole, while the sodium carbonate mixture flowed in from the top of the CBA. The reaction pressure and temperature were strictly controlled to produce (NaHCO3) crystals at the end of the reaction. On the basis of this technology, the CBA could be combined with the RWP so that the CO2 gas can be converted to HCO3− more efficiently, because the CO2 molecule was reacted with the HCO3− in advance, which made it easier for the algal cell to absorb it. However, the CBA could not be applied to the RWP, because the HCO3− concentration was fairly high, and even crystallized. Because the algal cells only required a limited HCO3− concentration, a higher HCO3− concentration would cause a drop in pH levels and the proton gradient. Zhang et al.27 proposed a spraying absorption tower coupled with an outdoor open RWP based on this principle to improve the CO2 utilization efficiency. The pH value was controlled by the absorption tower. The biomass productivity increased by 40.7% and CO2 fixation efficiency reached 50% compared to the conventional process where the CO2 was added through porous pipes placed at the bottom of the RWP.27 However, the use of the proposed spraying absorption tower did not take into account the CO2 exhaust gas, which was emitted directly to the atmosphere, causing a secondary emission of CO2 gas. Also, the optimized operation parameters were not given in this study. Eloka-Eboka and Inambao28 investigated the rate of sequestration of both total and dissolved carbon, and suggested that Dunaliella has a higher CO2 uptake rate. However, they did not give the specific method for improving the CO2 uptake rate in a real application, and the relationship of HCO3− concentration and biomass growth rate was not studied. Mokashi et al.29 also proved that HCO3− can be an alternative inorganic carbon source for higher microalgal production. Therefore, it is necessary to develop an apparatus to convert CO2 to HCO3− efficiently. The CO2 fixation efficiency would improve considerably if CO2 was reacted to HCO3− and fixed by the algal cell.
The main purpose of this study was to find an efficient method for CO2 fixation by microalgal. A CBA was proposed which would convert the CO2 gas to HCO3−, which can be easily utilized by the microalgal cells and dramatically enhances the CO2 fixation efficiency. The exhausted CO2 gas was recycled to the inlet gas flow, which means that the CO2 gas was completely reacted to the HCO3−, so CO2 fixation efficiency was greatly enhanced. The reaction time and pressure were optimized to regulate the molar proportion of NaHCO3 in total inorganic carbon. The initial concentration of sodium carbonate (Na2CO3) in the substrate and the volume ratio of Na2CO3 solution in the CBA were optimized to regulate the NaHCO3 product and to improve the biomass growth rate. Furthermore, the metabolism pathway of photosynthesis and CO2 fixation were determined to further understand the absorption mechanism of HCO3− by the algal cell.
2. Materials and methods
2.1 Design of CO2 bicarbonation absorber
As shown in Fig. 1, a CBA was proposed for improving the microalgal growth rate. The CBA was made of plexiglass, which gives a maximum CO2 pressure of 1.0 MPa. The dimensions of the CBA were ∅5 × 70 cm. The CBA was used for the reaction of CO2 and Na2CO3 (Na2CO3 + CO2 + H2O → 2NaHCO3). During the reaction, the CO2 gas in the storage tank was dried by a drier and then flowed into the CBA. A check valve was installed before the CO2 inlet to prevent the backward flow of gas. A pressure valve was installed before the check valve to keep the reaction pressure within 0.1 to 0.5 MPa. Simultaneously, the Na2CO3 was dissolved in water and injected to the CBA using a pump with the Na2CO3 concentration ranging from 120 to 280 mM L−1. The initial volume ratio μ of the Na2CO3 solution in CBA was defined as the ratio of solution height h1 and reactor height h2, that is, μ = h1/h2. In order to improve the CO2 utilization efficiency, the exhaust CO2 gas was dried and returned back into the CBA. For a better distribution of CO2 gas in the CBA, there was a cavity on the bottom of the reactor, above which was a gas distributor. The gas distributor was comprised of several holes which increased the CO2 resistance time and improved the reaction efficiency of CO2 and Na2CO3. The reaction time varied from 30 to 150 min. After the reaction, the solution mixture flowed into the RWP for the cultivation of microalgal.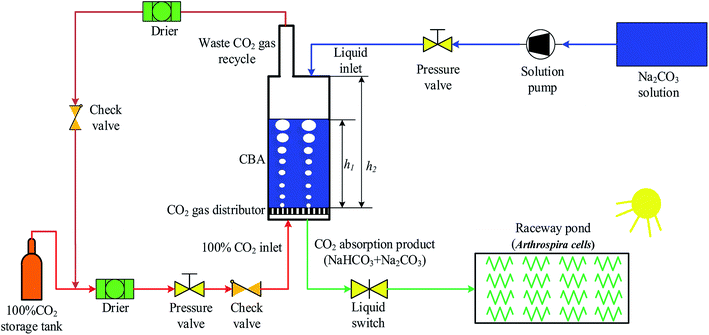 | ||
| Fig. 1 Schematic diagram of an experimental system for a CO2 bicarbonation absorber (CBA) for improving microalgal growth rate. | ||
2.2 Cultivation of Arthrospira platensis
The algal strain Arthrospira was mutated using nuclear irradiation and domestication in a high CO2 concentration environment30 to obtain hereditary stability. As well as the solution mixture of NaHCO3 and Na2CO3 from CBA, the culture medium was composed of 2.5 g L−1 sodium nitrate (NaNO3), 0.5 g L−1 dipotassium phosphate (K2HPO4), 0.2 g L−1 magnesium sulfate heptahydrate (MgSO4·7H2O), 1.0 g L−1 potassium sulfate (K2SO4), 0.01 g L−1 ferrous sulfate heptahydrate (FeSO4·7H2O), 0.08 g L−1 disodium ethylenediaminetetraacetate dihydrate (Na2EDTA), 0.04 g L−1 calcium chloride (CaCl2), 3 mL hydrochloric acid (HCl) (35% w/v) and 1 mL A5. A5 refers to the micronutrients required for the growth of the microalgal, including 2.86 g L−1 boric acid (H3BO3), 1.81 g L−1 manganese(II) chloride tetrahydrate (MnCl2·4H2O), 0.22 g L−1 zinc sulfate heptahydrate (ZnSO4·7H2O), 0.08 g L−1 copper(II) hydrate pentahydrate (CuSO4·5H2O) and 0.01 g L−1 molybdenum trihydrate (MoO3). The algal were inoculated into RWP with a solution depth of 5 cm and absorbance value of 0.3. The dimension of the RWP was 20 × 8 × 5 cm. The solution temperature was kept at 30 ± 2 °C and light intensity on the surface of the RWP was 8000 ± 500 lux. The RWP was covered with a plastic membrane to prevent evaporation of the microalgal solution. During the experiments, the algal samples were collected at 9![[thin space (1/6-em)]](https://www.rsc.org/images/entities/char_2009.gif) :
:![[thin space (1/6-em)]](https://www.rsc.org/images/entities/char_2009.gif) 00 and 21
00 and 21![[thin space (1/6-em)]](https://www.rsc.org/images/entities/char_2009.gif) :
:![[thin space (1/6-em)]](https://www.rsc.org/images/entities/char_2009.gif) 00 every day, and the solution optical density (OD) and pH were measured. The curve fitting of the OD and cell density (C) was measured as C (g L−1) = 0.505 × OD560nm − 0.034 (R2 = 0.996). All the experiments were conducted in triplicate. The solution concentration of total inorganic carbon (TIC), NaHCO3 and Na2CO3 were measured using a double-tracer method.31–34
00 every day, and the solution optical density (OD) and pH were measured. The curve fitting of the OD and cell density (C) was measured as C (g L−1) = 0.505 × OD560nm − 0.034 (R2 = 0.996). All the experiments were conducted in triplicate. The solution concentration of total inorganic carbon (TIC), NaHCO3 and Na2CO3 were measured using a double-tracer method.31–34
2.3 Quantitative label-free protein measurement
The direct mass spectrometry analysis of protein peptide segments was conducted using a label-free method.35 It was effective and efficient for quantitatively determining the protein functions. The label-free method mainly included three steps:36,37![[thin space (1/6-em)]](https://www.rsc.org/images/entities/char_2009.gif) 000 × g for 15 min at 4 °C. The supernatant was transferred to a clean tube, and the protein concentration was determined using the Bradford assay. To the supernatant, 4 volumes of 10 mM dithiothreitol (DTT) in cold acetone were added followed by placing the sample at −20 °C for 2 h to overnight for sample extraction. Samples were centrifuged and the pellet was washed twice with cold acetone. Finally, the pellet was resuspended in the dissolution buffer [Tris base (pH = 8) and 8 M urea].
000 × g for 15 min at 4 °C. The supernatant was transferred to a clean tube, and the protein concentration was determined using the Bradford assay. To the supernatant, 4 volumes of 10 mM dithiothreitol (DTT) in cold acetone were added followed by placing the sample at −20 °C for 2 h to overnight for sample extraction. Samples were centrifuged and the pellet was washed twice with cold acetone. Finally, the pellet was resuspended in the dissolution buffer [Tris base (pH = 8) and 8 M urea].![[thin space (1/6-em)]](https://www.rsc.org/images/entities/char_2009.gif) 000 with an automatic gain control target value of 3 × 10⁶ for a scan range of 350–1500 m/z. The proteins found were identified using the functional database of the KEGG Pathway.38,39
000 with an automatic gain control target value of 3 × 10⁶ for a scan range of 350–1500 m/z. The proteins found were identified using the functional database of the KEGG Pathway.38,393. Results and discussion
3.1 Optimizing operation conditions of CO2 bicarbonation absorber to improve the microalgal growth rate
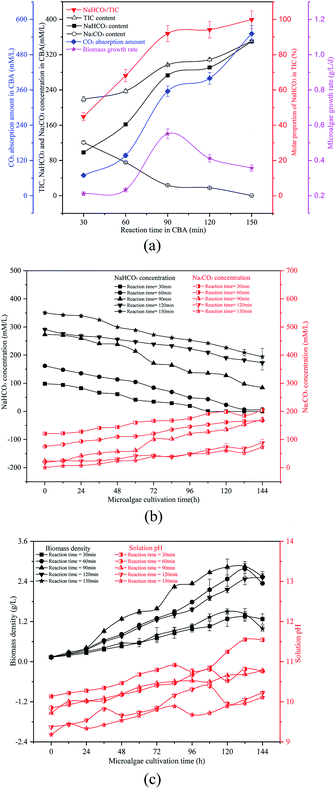
As shown in Fig. 2(b) and (c), as the reaction time increased from 30 min to 150 min, the initial solution pH decreased continually from 10.14 to 9.19. The biomass density was increased at first and then decreased, which may be a result of the ω and pH differences. When the reaction time was 90 min, the ω was 91% and the initial pH was 9.73, which was suitable for the growth of the microalgal cells. With the growth of the microalgal cells, the solution NaHCO3 in the RWP decreased gradually while the Na2CO3 concentration increased. The biomass density and pH value also increased gradually. The reaction time caused the difference in the initial NaHCO3 level in the solution, which was critical for the carbon concentrating mechanism (CCM) of the algal cells. As is known, the OH− ions were exhausted causing an increase of pH value. According to the CCM, the HCO3− passed through the plasma membrane via the translocator HLA3 and LC11, followed by passage through the chloroplast envelope via the translocator LciA and then the thylakoid membrane via the translocator LCI11. The HCO3− finally reached the thylakoid lumen, where the HCO3− was catalysed to CO2 by the CAH3 enzyme. The CO2 was fixed by the enzyme RuBisCO and was channelled into the Calvin cycle.1,2 However, some of the HCO3− was catalysed by the CA in the periplasmic space and converted to CO2, which was diffused to the stroma and captured by the RuBisCO.1 The HCO3− was transported by the CA in cellular stroma during the growth of algal cells, so the HCO3− concentration decreased gradually while the CO32− concentration increased. The HCO3− was the dominant carbon type to be absorbed by the algal cells. The presence of sufficient HCO3− promoted the Calvin cycle, and more adenosine triphosphate (ATP) was required, which in turn promoted photosynthesis to produce ATP. The HCO3− went through the cytoplasmic membrane by active transport, thereby enhancing the ion transport.
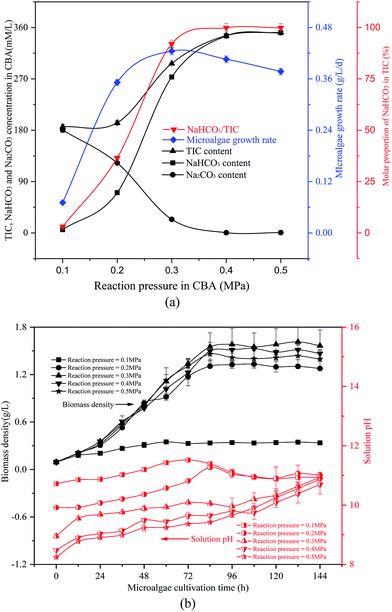 | ||
| Fig. 3 Optimizing reaction pressure in a CO2 bicarbonation absorber (CBA) to regulate the absorption of the product, NaHCO3 (a) effects of reaction pressure, (b) biomass density and pH value. | ||
The reacted NaHCO3 and Na2CO3 mixtures were used to cultivate microalgal. Microalgal growth rate first increased from 0.07 g L−1 d−1 to 0.42 g L−1 d−1 and then decreased to 0.38 g L−1 d−1. As shown in Fig. 3(b), with the growth of the algal cells, the biomass density and solution pH increased gradually. When the reaction pressure was 0.1 MPa, the microalgal nearly died, and the solution pH decreased slightly. That was because the solution NaHCO3 concentration was pretty low under these conditions, which were not sufficient for photosynthesis in the microalgal. However, if the solution only consisted of NaHCO3, the algal growth rate would also decrease. As the pH level was pretty low, it was not beneficial to the growth of the algal cells.
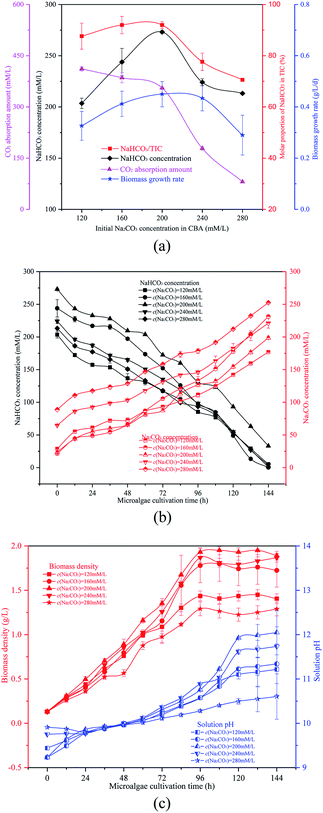
The NaHCO3 and Na2CO3 reaction mixtures were used to cultivate microalgal. Fig. 4(b) and (c) show the change in microalgal density and solution TIC. This demonstrated again that the optimized ω would promote microalgal growth. With the growth of the microalgal, the biomass density and solution pH increased gradually. In 0th, the order of the solution pH was pH280 mM L−1> pH240 mM L−1> pH120 mM L−1> pH200 mM L−1 = pH160 mM L−1. The reason behind this was that the solution pH was affected by ω which was different over the five different conditions. With the growth of algal cells, more OH− were produced and more Na2CO3 was reacted. The order of biomass density was 200 mM L−1 > 240 mM L−1 > 160 mM L−1 > 120 mM L−1 > 280 mM L−1. So the final solution pH also followed this order. Furthermore, the Na2CO3 concentration of the solution increased whereas the NaHCO3 concentration decreased (OH− + HCO3− → CO32− + H2O), as shown in Fig. 4(c).
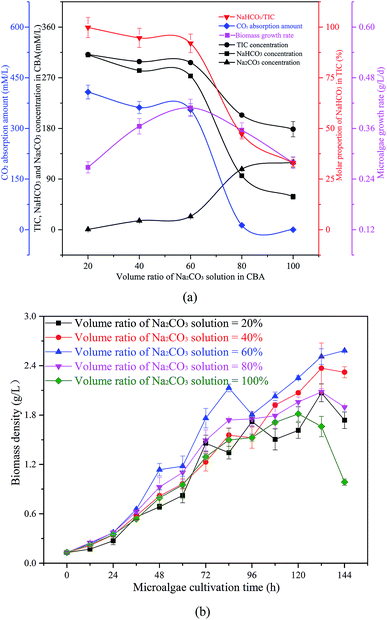 | ||
| Fig. 5 Optimization of the volume ratio of Na2CO3 solution in the CO2 bicarbonation absorber (CBA), (a) effects of volume ratio of Na2CO3 solution, (b) biomass density in microalgal growth. | ||
The reacted solution mixture was used to cultivate the microalgal, and the biomass growth rate first increased from 0.27 g L−1 d−1 to 0.41 g L−1 d−1, and then decreased to 0.28 g L−1 d−1. As shown in Fig. 5(b), the biomass growth rate was dramatically higher when the μ in the CBA was 60% when compared with other conditions. When the μ was 100%, there was no CO2 absorbed by the Na2CO3 solution, as there was no space above the solution. Therefore, almost no NaHCO3 was produced under these conditions, however, sufficient NaHCO3 is necessary for the growth of microalgae.
3.2 Promoting the photosynthesis and carbon fixation metabolism pathway
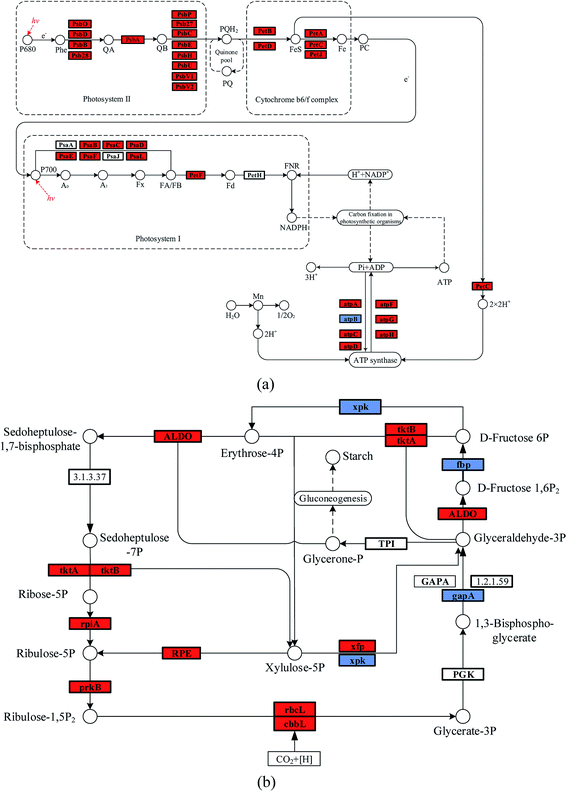
It was noticed that the reaction pressure was essential for NaHCO3 production, which further affects the biomass growth rate. The results in Fig. 3 show that the biomass growth rate under a CBA pressure of 0.3 MPa increased by 5.0 times compared with that obtained in 0.1 MPa. The ω was 92% when the reaction pressure was 0.3 MPa in CBA, which is ideal for the growth of algal cells. In order to investigate the molecular mechanism behind the improvement of microalgal growth rate under these conditions, label-free proteomics was conducted. The total number proteins identified in the Arthrospira platensis cells cultivated with the NaHCO3 product converted from Na2CO3 solution at pressure of 0.1 MPa and 0.3 MPa, separately in the CBA was 1611. Meanwhile, the up-regulated protein number was 468 (29%), the down-regulated protein number was 541 (34%), and the insignificant-regulated protein number was 602 (37%).As shown in Fig. 6(a), the enrichment pathway of the light reaction is shown along the electron transport chain. The light reaction of photosynthesis includes four stages: photosystem II (PSII), cytochrome b6/f complex (b6/f), photosystem I (PSI) and ATP synthase. The overall reaction formula is:
| H2O + ADP + Pi + [NADP] → O2 + ATP + NADPH + [H] | (1) |
In the PSII stage, an H2O molecule was disintegrated by the high light energy, and the H+ proton gradient was established along the thylakoid membrane, and a high energy electron was released to the plastoquinone (Pq). This electron was transported to the b6/f, which also produced the H+ proton and transferred it to the ATP synthase. The PSI reaction centre was P700, and the activated electron from P700 was transferred consecutively to the primary accepter (A0), secondary acceptor (A1), iron-sulfur protein and ferredoxin (Fd). The NADP reductase (FNR) then restored the NADP+ to NADPH. At the same time, the H+ produced in PSII and the b6/f was transferred to the ATP synthase, during which the phosphate ion (Pi) and ADP were consumed, and ATP was produced. As shown in Table 1, the D1 (PsbA) and D2 (PsbD) protein increased by 1.4 and 1.5 times, respectively. The PSII reaction centre proteins of CP43 (PsbC) and CP47 (PsbB) increased by 1.8 and 1.5 times, respectively. The PSI reaction centre (PsaL and PsaE) and iron-sulfur (PsaC) proteins increased by 96% and 93%, respectively. The PSI plastocyanin (PsaF) protein increased by 76%. The cytochrome proteins of b6 (PetB), f (PetA), ferredoxin (PetF) and c6 (PetJ) increased by 2.1, 1.4, 1.7 and 4.0 times, respectively. The ATP synthase subunit proteins of beta (atpD) and b (atpF) increased by 2.1 and 2.6 times, respectively, whereas the subunit a (atpB) decreased by 40%. The reason for this may be that the HCO3− concentration, at 0.3 MPa, of the CBA was higher than that at 0.1 MPa, which was beneficial for the photosynthesis of the algal cells. As is known, the HCO3− ion can cross the cell membrane through active transportation, and was then catalysed to CO2 by the inorganic carbon transporters (such as LC11 and HLA3).1,2 However, CA catalyses the extracellular HCO3− ion to CO2, the CO2 is diffused to the thylakoid membrane and fixed by the enzyme RuBisCO. Therefore, both of these methods required the participation of HCO3−. The higher HCO3− concentration required abundant ATP for the active transportation and dark reaction, the up-regulated ATP synthase subunit proteins of beta atpD, b atpF, and so on promoted the generation of ATP. In addition, the higher ATP consumption rate promoted the electron transport rate, thus, PSI and PSII were accelerated. The cytochrome complex, which was the electron carrier, was an essential protein in the electron transport chain. The up-regulated cytochrome proteins, such as b6 (PetB), f (PetA), ferredoxin (PetF) and c6 (PetJ) also contributed to the light reaction. Once again, the higher HCO3− concentration promoted the generation of ATP, which was beneficial for the electron transport chain. The up-regulated cytochrome proteins and accelerated electron transport rate co-contributed to the reaction of PSI and PSII.
| Protein name | Gene | FC | log2FC | State |
|---|---|---|---|---|
| Photosystem II D1 protein | PsbA | 2.42 | 1.28 | Up |
| Photosystem II D2 protein | PsbD | 2.45 | 1.29 | Up |
| Photosystem II CP43 reaction centre protein | PsbC | 2.75 | 1.46 | Up |
| Photosystem II lipoprotein | Psb27 | 3.27 | 1.71 | Up |
| Photosystem II CP47 reaction centre protein | PsbB | 2.50 | 1.32 | Up |
| Photosystem II CP47 reaction centre protein | Psb28 | 1.93 | 0.95 | Up |
| Cytochrome b559 subunit alpha | PsbE | 3.94 | 1.98 | Up |
| Photosystem II reaction centre protein | PsbH | 5.83 | 2.54 | Up |
| Photosystem II 12 kDa extrinsic protein | PsbU | 3.15 | 1.66 | Up |
| Cytochrome c-550 | PsbV1 | 2.21 | 1.14 | Up |
| Photosystem II cytochrome | PsbV2 | 4.36 | 2.12 | Up |
| Photosystem II manganese-stabilizing protein | PsbO | 2.49 | 1.31 | Up |
| Photosystem II oxygen evolving complex protein | PsbP | 1.80 | 0.85 | Up |
| Photosystem I P700 chlorophyll a apoprotein A2 | PsaB | 1.59 | 0.67 | Up |
| Photosystem I iron-sulfur center | PsaC | 1.93 | 0.95 | Up |
| Photosystem I protein | PsaD | 1.93 | 0.95 | Up |
| Photosystem I reaction center subunit XI | PsaL | 1.96 | 0.97 | Up |
| Photosystem I reaction center subunit IV | PsaE | 1.96 | 0.97 | Up |
| Putative plastocyanin docking protein | PsaF | 1.76 | 0.82 | Up |
| Cytochrome b6 | PetB | 3.06 | 1.61 | Up |
| Cytochrome b6-f complex subunit 4 | PetD | 3.00 | 1.58 | Up |
| Cytochrome f | PetA | 2.39 | 1.25 | Up |
| Cytochrome b6-f complex iron-sulfur subunit | PetC | 3.17 | 1.66 | Up |
| Ferredoxin | PetF | 2.66 | 1.41 | Up |
| Cytochrome c6 | PetJ | 4.98 | 2.32 | Up |
| ATP synthase subunit beta | atpD | 3.14 | 1.65 | Up |
| ATP synthase subunit alpha | atpA | 1.91 | 0.93 | Up |
| ATP synthase gamma chain gamma | atpG | 2.36 | 1.24 | Up |
| ATP synthase subunit delta | atpH | 1.82 | 0.87 | Up |
| ATP synthase epsilon chain epsilon | atpC | 2.43 | 1.28 | Up |
| ATP synthase subunit a | atpB | 0.58 | −0.79 | Down |
| ATP synthase subunit b | atpF | 3.57 | 1.84 | Up |
The enriched carbon fixation pathway is shown in Fig. 6(b). In the Calvin cycle, the CO2 was catalysed by RuBisCO and was reacted with ribulose diphosphate (RuBP) to produce phosphoglycerate (PGA). The PGA reacted with ATP and NADPH to produce G3P that was transferred to carbohydrate and RuBP. The specific reaction formula is:
| 6CO2 + 6RuBP + RuBisCO → 12PGA | (2) |
| 12PGA + 12ATP + 12NADPH + 6[H] → 12 G3P + 12[NADP] + 12Pi | (3) |
| 2 G3P → (CH2O) | (4) |
| 10 G3P + 6ATP → 6RuBP + 6ADP + 4Pi | (5) |
The higher HCO3− concentration mainly improved the expression of RuBisCO, as shown in Table 2, the RuBisCO (rbcL) and RuBisCO (cbbL) large chain increased by 3.5 and 2.4 times, respectively, improving the generation of G3P. The enzyme RuBisCO was important for the Calvin cycle, which determined the carbon assimilation rate of the photosynthesis. The up-regulated RuBisCO promoted the dark reaction of the algal cell, which accelerated the accumulation of biomass. In addition, the other proteins such as phosphoribulokinase (prkB), ribose-5-phosphate isomerase A (rpiA) and transketolase (tktA) were increased by 80%, 70% and 60%, respectively. These are helpful to the metabolism of pentose phosphate.
| Protein name | Gene | FC | log2FC | State |
|---|---|---|---|---|
| Ribulose-bisphosphate carboxylase (RuBisCO) | rbcL | 4.50 | 2.17 | Up |
| Ribulose-phosphate 3-epimerase | RPE | 4.09 | 2.03 | Up |
| Fructose-bisphosphate aldolase class II | ALDO | 3.65 | 1.87 | Up |
| RuBisCO large chain | cbbL | 3.35 | 1.74 | Up |
| Transketolase domain protein | tktB | 2.98 | 1.57 | Up |
| D-fructose 6-phosphate phosphoketolase | xfp | 2.16 | 1.11 | Up |
| Phosphoribulokinase | prkB | 1.80 | 0.85 | Up |
| Ribose-5-phosphate isomerase A | rpiA | 1.68 | 0.74 | Up |
| Transketolase | tktA | 1.59 | 0.67 | Up |
| Glyceraldehyde-3-phosphate dehydrogenase | gapA | 0.67 | −0.59 | Down |
| Probable phosphoketolase | xpk | 0.63 | −0.67 | Down |
| Fructose-1,6-bisphosphatase class 1 | fbp | 0.50 | −0.99 | Down |
3.3 Practical applications of the CO2 bicarbonation absorber and the raceway pond
The CBA-RWP has broad application prospects in engineering. The CO2 gas added directly to the RWP caused a low CO2 utilization efficiency. A huge amount of CO2 gas was wasted and released to the atmosphere, causing secondary pollution. The NaHCO3 was also used to cultivate the microalgal. However, the chemical NaHCO3 was expensive. The price of Spirulina powder was around 1000–7000 $ per ton, whereas the NaHCO3 was about 300–700 $ per ton with a consumption of 0.9–1.2 ton per ton algal powder, this accounted for a huge percentage of the operation costs. Combining CO2 gas with Na2CO3 to cultivate microalgal has the potential to save on the operation costs and to reduce the CO2 emission. Pure CO2 gas was inexpensive, about 70–100 $ per ton. The Na2CO3 was 10–20 $ per ton and which can also be found in natural alkali lakes. During the later cultivation period, the Na2CO3 solution can be replaced by the wasted algal solution, as it contained a high sodium carbonate concentration. Also, the algal cell efficiently fixed CO2 gas without any secondary pollution. Therefore, optimizing the CBA-RWP to cultivate microalgal was both economically and environmentally friendly.4. Conclusions
A CO2 bicarbonation absorber was proposed to efficiently convert CO2 gas and Na2CO3 solution to produce NaHCO3, which was easier to dissolve and remained for a longer time in the culture medium for promoting the microalgal growth rate. The CO2 gas reacted with the Na2CO3 solution (initial concentration = 200 mM L−1 and the volume ratio in the CBA = 60%) for 90 min at 0.3 MPa to give the optimized molar proportion (92%) of the NaHCO3 product in total inorganic carbon to increase the microalgal growth rate by 5.0 times. Expression levels of the PSII reaction centre protein (PsbH) and PSII cytochrome (PsbV2) in the photosynthesis pathway increased by 4.8 and 3.4 times, respectively, whereas that of the RuBisCO enzyme (rbcL) in the carbon fixation pathway increased by 3.5 times in Arthrospira platensis cells cultivated with the NaHCO3 product at 0.3 MPa in the CBA. However, development of continuous flow is needed for the NaHCO3 product, which would greatly improve the transfer efficiency, and would then be applicable for large-scale cultivation.Conflicts of interest
There are no conflicts to declare.Acknowledgements
This study was supported by the National Key Research and Development Program – China (2016YFB0601005), National Natural Science Foundation – China (51476141) and 2018 Zhejiang University Academic Award for Outstanding Doctoral Candidates.References
- L. C. M. Mackinder, C. Chen, R. D. Leib, W. Patena, S. R. Blum, M. Rodman, S. Ramundo, C. M. Adams and M. C. Jonikas, Cell, 2017, 171, 133–147 CrossRef CAS PubMed.
- E. S. Freeman Rosenzweig, B. Xu, C. L. Kuhn, A. Martinez-Sanchez, M. Schaffer, M. Strauss, H. N. Cartwright, P. Ronceray, J. M. Plitzko and F. Förster, Cell, 2017, 171, 148–162 CrossRef CAS PubMed.
- M. Giordano, J. Beardall and J. A. Raven, Annu. Rev. Plant Biol., 2005, 56, 99–131 CrossRef CAS PubMed.
- M. R. Badger, J. Exp. Bot., 2003, 54, 609–622 CrossRef CAS PubMed.
- J. Cabello, M. Morales and S. Revah, Sci. Total Environ., 2017, 584–585, 1310–1316 CrossRef CAS PubMed.
- J. Cheng, Z. Yang, Y. Huang, L. Huang, L. Hu, D. Xu, J. Zhou and K. Cen, Bioresour. Technol., 2015, 190, 235–241 CrossRef CAS PubMed.
- A. Janoska, P. P. Lamers, A. Hamhuis, Y. van Eimeren, R. H. Wijffels and M. Janssen, Chem. Eng. J., 2017, 313, 1206–1214 CrossRef CAS.
- A. Concas, M. Pisu and G. Cao, Chem. Eng. J., 2010, 157, 297–303 CrossRef CAS.
- C. Ji, J. Wang, R. Li and T. Liu, Bioprocess Biosyst. Eng., 2017, 40, 1079–1090 CrossRef CAS PubMed.
- V. Tesař, C. Hung and W. B. Zimmerman, Sens. Actuators, A, 2006, 125, 159–169 CrossRef.
- Z. Yang, J. Cheng, R. Lin, J. Zhou and K. Cen, Bioresour. Technol., 2016, 211, 429–434 CrossRef CAS PubMed.
- Y. Huang, S. Zhao, Y. Ding, Q. Liao, Y. Huang and X. Zhu, Bioresour. Technol., 2017, 233, 84–91 CrossRef CAS PubMed.
- J. Cheng, W. Guo, C. Cai, Q. Ye and J. Zhou, Bioresour. Technol., 2017, 249, 212–218 CrossRef PubMed.
- Q. Zhang, S. Xue, C. Yan, X. Wu, S. Wen and W. Cong, Bioresour. Technol., 2015, 198, 150–156 CrossRef CAS PubMed.
- J. Cheng, Z. Yang, Q. Ye, J. Zhou and K. Cen, Bioresour. Technol., 2015, 190, 29–35 CrossRef CAS PubMed.
- Z. Chen, X. Zhang, Z. Jiang, X. Chen, H. He and X. Zhang, Bioresour. Technol., 2016, 219, 387–391 CrossRef CAS PubMed.
- C. U. Ugwu, H. Aoyagi and H. Uchiyama, Bioresour. Technol., 2008, 99, 4021–4028 CrossRef CAS PubMed.
- R. N. Singh and S. Sharma, Renewable Sustainable Energy Rev., 2012, 16, 2347–2353 CrossRef CAS.
- A. Behkish, R. Lemoine, R. Oukaci and B. I. Morsi, Chem. Eng. J., 2006, 115, 157–171 CrossRef CAS.
- A. V. Kulkarni and J. B. Joshi, Chem. Eng. Res. Des., 2011, 89, 1972–1985 CAS.
- J. Cheng, J. Xu, H. Lu, Q. Ye, J. Liu and J. Zhou, Bioresour. Technol., 2018, 261, 151–157 CrossRef CAS PubMed.
- Z. Yang, J. Cheng, Q. Ye, J. Liu, J. Zhou and K. Cen, Bioresour. Technol., 2016, 220, 352–359 CrossRef CAS PubMed.
- D. G. Maharloo, A. Darvishi, R. Davand, M. Saidi and M. R. Rahimpour, J. CO2 Util., 2017, 20, 318–327 CrossRef CAS.
- B. Haut, V. Halloin, T. Cartage and A. Cockx, Chem. Eng. Sci., 2004, 59, 5687–5694 CrossRef CAS.
- N. Kantarci and B. K. O. Ulgen, Cheminform, 2005, 36, 2263–2283 CrossRef.
- R. S. Goharrizi and B. Abolpour, Res. Chem. Intermed., 2013, 41, 1459–1471 CrossRef.
- C. Zhang, W. Li, Y. Shi, Y. Li, J. Huang and H. Li, Bioresour. Technol., 2016, 209, 351–359 CrossRef CAS PubMed.
- A. C. Eloka-Eboka and F. L. Inambao, Appl. Energy, 2017, 195, 1100–1111 CrossRef CAS.
- K. Mokashi, V. Shetty, S. A. George and G. Sibi, Achievements in the Life Sciences, 2016, 10, 111–117 CrossRef.
- J. Cheng, H. Lu, H. Xin, W. Yang, J. Zhou and K. Cen, Bioresour. Technol., 2017, 238, 650–656 CrossRef CAS PubMed.
- R. Putt, M. Singh, S. Chinnasamy and K. C. Das, Bioresour. Technol., 2011, 102, 3240–3245 CrossRef CAS PubMed.
- O. Couvert, S. Guégan, B. Hézard, V. Huchet, A. Lintz, D. Thuault and V. Stahl, Food Microbiol., 2017, 68, 89–96 CrossRef CAS PubMed.
- C. Ji, J. Wang, R. Li and T. Liu, Bioprocess Biosyst. Eng., 2017, 40, 1079–1090 CrossRef CAS PubMed.
- J. Cheng, W. Guo, Y. Song, S. Kumar, K. Ameer Ali and J. Zhou, Bioresour. Technol., 2018, 269, 1–8 CrossRef CAS PubMed.
- L. J. Goeminne, K. Gevaert and L. Clement, J. Proteomics, 2017, 171, 23–26 CrossRef PubMed.
- J. Wu, Y. An, H. Pu, Y. Shan, X. Ren, M. An, Q. Wang, S. Wei and J. Ji, Anal. Biochem., 2010, 398, 34–44 CrossRef CAS PubMed.
- J. Wu, X. Xie, Y. Liu, J. He, R. Benitez, R. J. Buckanovich and D. M. Lubman, J. Proteome Res., 2012, 11, 4541–4552 CrossRef CAS PubMed.
- M. Kanehisa, S. Goto, S. Kawashima, Y. Okuno and M. Hattori, Nucleic Acids Res., 2003, 32, 277–280 CrossRef PubMed.
- M. Kanehisa, S. Goto, M. Hattori, K. F. Aokikinoshita, M. Itoh, S. Kawashima, T. Katayama, M. Araki and M. Hirakawa, Nucleic Acids Res., 2006, 34, 354–357 CrossRef PubMed.
- N. Kantarci and B. K. O. Ulgen, Cheminform, 2005, 40, 2263–2283 CAS.
- T. J. Lin, K. Tsuchiya and L. S. Fan, AIChE J., 2010, 44, 545–560 CrossRef.
- N. Kantarci, F. Borak and K. O. Ulgen, Process Biochem., 2005, 40, 2263–2283 CrossRef CAS.
- P. M. Wilkinson, A. P. Spek and L. L. V. Dierendonck, AIChE J., 1992, 38, 544–554 CrossRef CAS.
- A. Behkish, R. Lemoine, R. Oukaci and B. I. Morsi, Chem. Eng. J., 2006, 115, 157–171 CrossRef CAS.
- D. N. Miller, Ind. Eng. Chem. Process Des. Dev., 1980, 19, 371–377 CrossRef.
- H. M. Letzel, J. C. Schouten, R. Krishna and C. M. V. D. Bleek, Chem. Eng. Sci., 1999, 54, 2237–2246 CrossRef CAS.
| This journal is © The Royal Society of Chemistry 2019 |

