 Open Access Article
Efficient dehydrogenation of a formic acid–ammonium formate mixture over Au3Pd1 catalyst†
Xiao-Tong Guo,
Juan Zhang,
Jian-Chao Chi,
Zhi-Hui Li,
Yu-Chen Liu,
Xin-Ru Liu and
Shu-Yong Zhang *
*
School of Chemistry and Chemical Engineering, Shandong University, Jinan 250100, P. R. China. E-mail: syzhang@sdu.edu.cn; Tel: +86-531-88365456
First published on 18th February 2019
Abstract
A series of AuPd/C catalysts were prepared and tested for the first time for active and stable dehydrogenation of a formic acid–ammonium formate (FA–AF) mixture. The catalysts with different Au-to-Pd molar ratios were prepared using a facile simultaneous reduction method and characterized using transmission electron microscopy (TEM), high-resolution TEM, energy dispersive X-ray spectroscopy, X-ray diffraction, and X-ray photoelectron spectroscopy. It was found that the catalytic activity and stability of the Au3Pd1/C catalyst was the best. The initial turnover frequency for the dehydrogenation of the FA–AF mixture over the Au3Pd1/C catalyst can reach 407.5 h−1 at 365 K. The reaction order with respect to FA and AF is 0.25 and 0.55, respectively. The apparent activation energy of dehydrogenation is 23.3 ± 1.3 kJ mol−1. The catalytic activity of the Au3Pd1/C catalyst remains ca. 88.0% after 4 runs, which is much better than the single Pd/C catalyst. The mechanism for the dehydrogenation is also discussed.
1. Introduction
Due to its environmental friendliness and renewability, hydrogen has received extensive attention as the most promising energy carrier.1–5 However, the commercial application of hydrogen is still facing great challenges due to the lack of credible technologies for the efficient generation, safe storage and transportation of gaseous hydrogen. Compared to the traditional physical methods, chemical methods for the storage and release of hydrogen are usually less expensive, more efficient, easier to handle and much safer.6–8 However, the dehydrogenation or conversion of hydrocarbon, methanol, or ethanol can be only achieved at high temperature with several harmful by-products hard to separate.9,10 Recently, owing to its high hydrogen content of 4.4 wt%, low toxicity, safe storage, easy transportation and efficient direct dehydrogenation, formic acid (FA) has been regarded as an ideal hydrogen storage medium.11–15 FA can decompose through two competing paths: dehydrogenation/decarboxylation (1) and dehydration/decarbonylation (2).15,16| HCOOH(l) → CO2(g) + H2(g) | (1) |
| HCOOH(l) → CO(g) + H2O(l) | (2) |
CO produced through reaction (2) can poison fuel cell catalysts.17,18
Pd, one of the most active catalysts for the dehydrogenation of FA, also suffers from poisoning due to the trace amount of CO generated through reaction (2).19 For single Pd catalysts,20–27 only a few catalysts show suitable activity and stability. Recently, Au nanoparticles (NPs) or nanoclusters were found to be active for the dehydrogenation of FA.28–34 The weak adsorption of CO and H atoms on the Au surface is beneficial to the catalyst performance.35–39 Although some Au catalysts displayed excellent performances in both activity and stability, most of them showed relatively low turn-over frequencies (TOFs) and high activation energies. To improve the activity of Au catalysts and the poison tolerance of Pd catalysts, the combination of Pd and Au may be a possible choice. In fact, a number of AuPd catalysts have been reported with improved catalytic performances.40–45 The other way to improve the activity and stability of catalysts is using new fuel systems with low acidity, high formate anion concentration and catalyst enhancement agents such as formic acid–sodium formate (FA–SF) mixture or formic acid–ammonium formate (FA–AF) mixture.46–50
In a previous work, we found that the dehydrogenation performance of FA–AF mixture was even better than FA–SF mixture. The Pd/C catalyst exhibited superior catalytic activity towards FA–AF system with an initial TOF of 7959 h−1 at 323 K. However, the stability the Pd/C catalyst needs further improvement.51
In this work, we intend to take advantage of the improved stability of AuPd/C catalyst and the higher activity and catalysis enhancement of FA–AF mixture to develop a new system with improved dehydrogenation performance. A series of AuPd/C catalysts with different Au-to-Pd molar ratios were prepared and tested. The reaction order, apparent activation energy and the dehydrogenation mechanism are also discussed.
2. Experimental
2.1 Reagents
Palladium chloride (PdCl2) and tetrachloroauric(III) acid (HAuCl4·4H2O) were purchased from Sinopharm Chemical Reagent Co., Ltd. (Shanghai, China). Nessler's reagent and potassium sodium tartrate solution were purchased from Hefei Enfan Instrument Equipment Co., Ltd. (Hefei, China). All other chemicals were all of analytical grade. Ultrapure water (Millipore, 18.25 MΩ cm, Ulupure Science and Technology Co., Ltd., Chengdu, China) was used for the solution preparation. All chemicals were used as received without further purification.2.2 Preparation of the catalysts
AuPd NPs with different Au-to-Pd ratios supported on Vulcan XC-72 carbon black were prepared using a facile impregnation-NaBH4 reduction method without the addition of any stabilizer.45 For the preparation of Au3Pd1/C catalyst, 108.0 mg of Vulcan XC-72 carbon black was dispersed in 200 mL of H2O with ultrasonication for 1 h. Then, a solution containing 0.9 mmol of HAuCl4 and 0.3 mmol of H2PdCl4 was added into the Vulcan XC-72 carbon black suspension. Subsequently, 150 mL of a freshly prepared 0.16 mol L−1 NaBH4 solution was dripped into the suspension under strong stirring. After stirring for another 8 h at 30 °C, the Au3Pd1/C catalyst was filtered, washed with ultrapure water, and dried under vacuum at 25 °C overnight. The catalysts with different Au-to-Pd molar ratios of 0.5![[thin space (1/6-em)]](https://www.rsc.org/images/entities/char_2009.gif) :
:![[thin space (1/6-em)]](https://www.rsc.org/images/entities/char_2009.gif) 1, 1
1, 1![[thin space (1/6-em)]](https://www.rsc.org/images/entities/char_2009.gif) :
:![[thin space (1/6-em)]](https://www.rsc.org/images/entities/char_2009.gif) 1, 2
1, 2![[thin space (1/6-em)]](https://www.rsc.org/images/entities/char_2009.gif) :
:![[thin space (1/6-em)]](https://www.rsc.org/images/entities/char_2009.gif) 1, 4
1, 4![[thin space (1/6-em)]](https://www.rsc.org/images/entities/char_2009.gif) :
:![[thin space (1/6-em)]](https://www.rsc.org/images/entities/char_2009.gif) 1 and 5
1 and 5![[thin space (1/6-em)]](https://www.rsc.org/images/entities/char_2009.gif) :
:![[thin space (1/6-em)]](https://www.rsc.org/images/entities/char_2009.gif) 1 were prepared following the same procedure using different amounts of PdCl2 and HAuCl4. For comparison, Pd/C and Au/C catalysts were also made. The total amount of metals in each catalyst was kept constant at 1.2 mmol.
1 were prepared following the same procedure using different amounts of PdCl2 and HAuCl4. For comparison, Pd/C and Au/C catalysts were also made. The total amount of metals in each catalyst was kept constant at 1.2 mmol.
2.3 Characterization
The morphologies of the AuPd/C catalysts were characterized using a JEM-1011 transmission electron microscope (TEM, JEOL, Japan). The crystallographic information of the AuPd/C catalysts was collected using a D8 Advance X-ray diffractometer (XRD, Bruker, Germany) and a JEM-2100 high-resolution transmission electron microscope (HRTEM, JEOL, Japan), respectively. The elemental composition of the catalyst was determined with an INCA Sight X energy-dispersive spectroscope (EDX, Oxford, USA). The XPS spectra were taken with an ESCALAB 250 X-ray photoelectron spectroscope (XPS, Thermo Fisher SCIENTIFIC, UK) equipped with an Al-Kα excitation source. The Au/Pd molar ratio was analyzed with an Agilent 5110 inductively coupled plasma-optical emission spectrometer (ICP-OES, Agilent Technologies, US).2.4 Catalytic performance of the catalysts
A two-necked round-bottomed flask placed in an oil bath with a magnetic stirrer was used as the reactor. One neck of the flask was connected to a spherical condenser and then to a series of wash bottles containing 2.5 mol L−1 CuCl solution and 8 mol L−1 NaOH solution for the removal of CO and CO2, respectively. After purification, the hydrogen generated from the flask was gathered in a gas burette. Prior to the reaction, 60 mg of AuPd/C catalyst was put in the flask, heated to a pre-set temperature and maintained at that temperature for 30 min to reach thermal equilibrium. The reaction was initiated by adding 10 mL solution containing 3 mol L−1 of FA and 3 mol L−1 of AF at 365 K through a constant-pressure dropping funnel connected to the other neck of the flask. The volume of hydrogen released from the reactor was monitored using the gas burette.2.5 Kinetic study of the dehydrogenation
The effect of the FA–AF total concentration on the dehydrogenation was evaluated over 60 mg of Au3Pd1/C catalyst using 0.02 mol of FA–AF mixture with the same molar fraction of FA (xFA) = 0.5 but different solution volumes. To determine the AF reaction order, a series of tests were performed over 60 mg of catalyst in 5 mL of FA–AF mixture with 5 mol L−1 FA and AF of different concentrations (1–7.5 mol L−1) at 365 K. The reaction order of FA was determined by performing several tests in 5 mL FA–AF mixture with 5 mol L−1 AF and FA with concentration varying from 1 mol L−1 to 5 mol L−1. The apparent activation energy of the dehydrogenation was determined over 60 mg of AuPd/C catalyst at different temperatures from 325 K to 365 K with a temperature increment of 10 K.2.6 Stability of the catalyst
After each run of dehydrogenation, the catalyst was filtered from the FA–AF mixture, washed with ultrapure water and dried under vacuum at 298 K overnight. Then, the recovered catalyst was used for the subsequent runs.2.7 Purity of hydrogen
Because CO and NH3 may produce due to the dehydration of FA and the hydrolysis of AF, the purity of the hydrogen generated from the FA–AF mixture was analyzed. The CO content was analyzed using GC-7920 (GC, Beijing Zhongjiao Jinyuan Technology Co., Ltd., China) with thermal conductivity detector (TCD) and flame ionization detector (FID)-Methanator (detection limit: ∼5 ppm for CO). The NH3 content at different temperatures was monitored with an EFD-NH precision ammonia-nitrogen analyzer (Hefei Enfan Instrument Equipment Co., Ltd., China) using Nessler's reagent spectrophotometry (l = 420 nm). The NH3 detection limit is 0.02 mg L−1 (calculated by N). The instrument error is £±5%. The total volume (VH2+CO2) of CO2 and H2 was recorded after removal of NH3 with dilute H2SO4 solution. For further determination, the solution containing NH4+ was diluted to 25 mL with dilute H2SO4 solution.3. Results and discussion
3.1 Structure and morphology of the catalyst
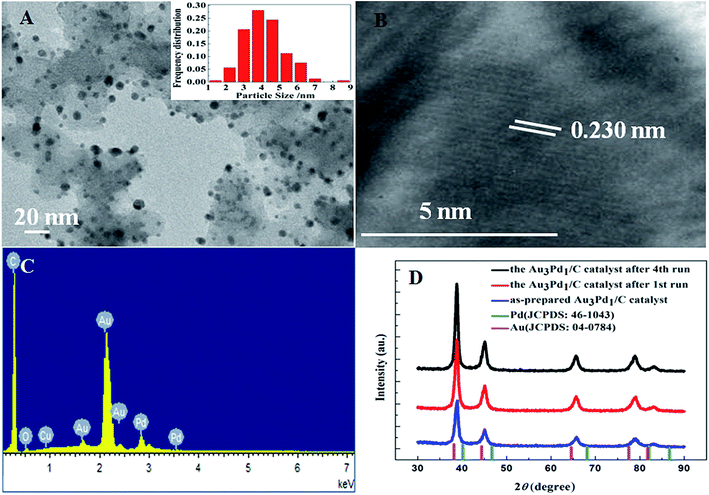
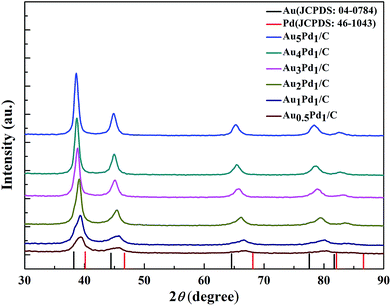
According to the TEM images of the newly prepared AuPd/C catalysts with different Au-to-Pd ratios shown in Fig. 1(A) and S1,† the mean particle sizes of Au0.5Pd1/C, Au1Pd1/C, Au2Pd1/C, Au3Pd1, Au4Pd1/C and Au5Pd1/C catalysts were 4.86, 4.29, 4.25, 4.18, 4.78 and 5.33 nm, respectively. The Au3Pd1 NPs with the least particle size were uniformly distributed on the carbon support. According to the HR-TEM image shown in Fig. 1(B), a face-centred cubic (fcc) structure with a (111) facet lattice spacing of 0.230 nm can be observed. This lattice spacing is between the (111) spacing of fcc Au (0.236 nm, JCPDS file: 04-0784) and that of fcc Pd (0.225 nm, JCPDS file: 46-1043), suggesting the formation of AuPd alloy. The EDX spectrum shown in Fig. 1(C) shows the presence of both Au and Pd in the catalyst. The ICP-OES results of each catalysts are shown in Table S1.† The discrepancy between the expected AuPd composition and the confirmed composition in the resultant catalysts is small. According to Fig. 2, the characteristic diffraction peaks in the XRD patterns appear at a position between the Au and Pd peaks, which also suggests the formation of AuPd alloy.40,45 Meanwhile, the position of the diffraction peaks shifts towards lower angles as the Au/Pd ratio increases, which is beneficial for electron transfer from Au to Pd.52The binding energies of 83.71 eV, 87.36 eV, 84.70 eV, and 88.18 eV in the high-resolution Au 4f XPS (Fig. S4(B)†) spectrum correspond to Au0 4f7/2, Au0 4f5/2, Au+ 4f7/2, and Au+ 4f5/2, respectively. The binding energy of Au 4d5/2 (335 eV) is close to that of Pd 3d5/2 (335.1 eV),53 which leads to the difficulty to separate the peak of Au 4d5/2 from the high-resolution XPS spectrum of Pd 3d (Fig. S4(C)†). The chemical states of Pd are Pd0 (Pd 3d5/2, 334.50 eV; Pd 3d3/2, 340.15 eV), Pd2+ (Pd 3d5/2, 336.55 eV, Pd 3d3/2, 341.10 eV), and Pd4+ (Pd 3d5/2, 338.30 eV; Pd 3d3/2, 342.80 eV).54,55 From the XPS results shown in Fig. 3, compared to Pd/C catalyst, it can be seen that a negative shift of the binding energy of Pd 3d in all AuPd/C catalysts, suggesting that Au may act as a cocatalyst which adjusts the electronic properties of Pd, consistent with the previous reports.43,54,56 Moreover, the difference of the work functions of Pd (5.67 eV) and Au (5.54 eV) could also lead to the electron transfer from Au to Pd in AuPd alloy.57 The low activity of single Au/C catalyst shown in Fig. S3† also backs up this conclusion. The reduced binding energy of Pd in AuPd catalyst reduces the interaction between Pd surface and CO or H atoms,35,39,56 which is beneficial for the stability of the catalyst as revealed in Fig. S3.† The surface composition of the AuPd catalyst was characterized using XPS. According to the XPS results shown in Table S2,† the surface Au content is less than the overall content, suggesting surface enrichment of Pd in the AuPd catalysts.
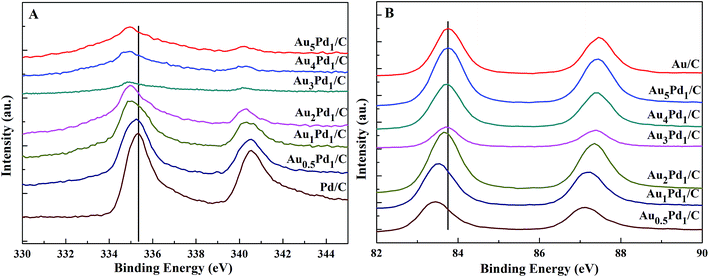 | ||
| Fig. 3 High-resolution XPS spectra of (A) Pd 3d and (B) Au 4f in the newly prepared AuPd/C catalysts with different Au/Pd molar ratios. | ||
3.2 Effect of catalyst composition
According to the catalytic performances of Pd/C, Au/C and Au3Pd1/C catalysts in the FA–AF mixture shown in Fig. S3,† both the catalytic activity and stability of the Au3Pd1/C catalyst is much better than that of the Pd/C and Au/C catalysts. The dehydrogenation rate of the Pd/C catalyst is fast at beginning but slows down rapidly, suggesting poor stability.The effect of the Au–Pd molar ratio on the dehydrogenation and the dependence of initial TOF on the molar ratio of Au–Pd are shown in Fig. 4. The Au–Pd molar ratio has a significant effect on the catalytic activity with the optimal composition of Au3Pd1. Therefore, the Au3Pd1/C catalyst was chosen for further study.
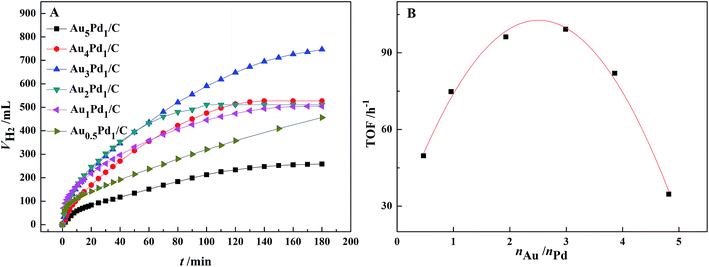 | ||
| Fig. 4 (A) Effect of the Au–Pd molar ratio on the dehydrogenation of 10 mL FA–AF mixture with 3 mol L−1 FA and 3 mol L−1 AF at 365 K; (B) the dependence of initial TOF on the Au–Pd molar ratio. | ||
For the Au3Pd1/C catalyst, the H2 volume can reach 750 mL after 3 h of reaction, corresponding to an initial TOF for the first 1 h of 99.2 h−1. 750 mL of H2 corresponds to the complete dehydrogenation of FA and 11.6% dehydrogenation of AF.51
3.3 Kinetic and mechanism study
As shown in Fig. 5, the initial rate of dehydrogenation increases with increasing the total FA–AF concentration, while the maximum hydrogen volume does not change significantly. The complete decomposition of FA and 37.1–47.3% decomposition of AF were observed. The detail information is given in Table S3.†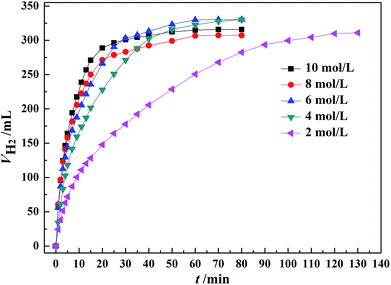 | ||
| Fig. 5 Effect of the total concentration of FA–AF mixture on the H2 generation over 60 mg of Au3Pd1/C catalyst from FA–AF mixtures with 0.01 mol FA and 0.01 mol AF at 365 K. | ||
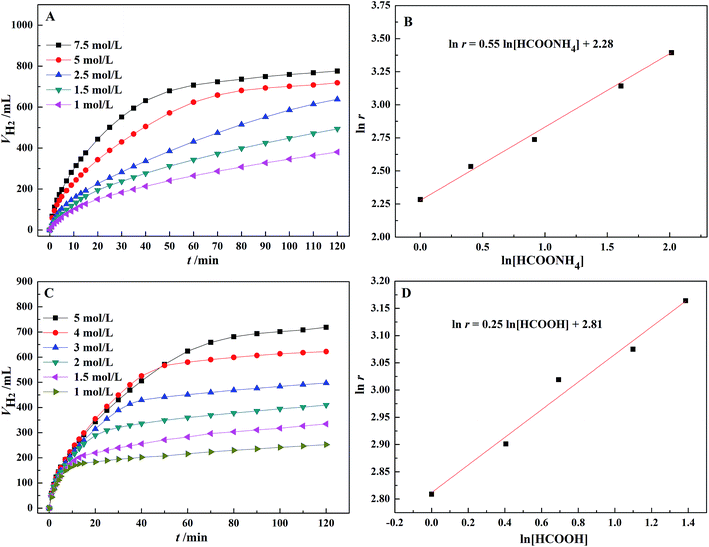
According to Fig. 6(A), the dehydrogenation rate significantly increases with an increasing concentration of AF. In Fig. 6(B), there is a linear relationship between the logarithm of the initial TOF for the first 10 min and AF concentration with a slope of 0.55 and a linear correlation coefficient, R2 = 0.99. Therefore, the reaction order with respect to AF is 0.55. Similarly, according to Fig. 6(D), a reaction order with respect to FA is 0.25. The rate equation for the dehydrogenation of FA–AF mixture over Au3Pd1/C catalyst is:
| r = k[HCOOH]0.25[HCOONH4]0.55 | (3) |
Eqn (3) suggests that the dehydrogenation rate of FA–AF mixture over Au3Pd1/C catalyst is more sensitive to the AF concentration. The fractional reaction orders of FA and AF suggest that the mechanism of dehydrogenation of the FA–AF mixture is complicated. The higher partial reaction order of AF in eqn (3) may be ascribed to three cases. For Case I, the HCOO− with a rather higher concentration is a reactive intermediate,46,58 and the existence of HCOO− is conducive for FA to form a “H-down” adsorption configuration on the catalyst surface,59,60 beneficial for the dehydrogenation of FA. For Case II, HCOO− forms an equilibrium with HCOOH:
| HCOOH ⇌ HCOO− + H+ | (4) |
Once FA is consumed, the equilibrium shifts left and replenishes FA, contradicting the decrease in the reactant concentration and reaction rate. For Case III, AF decomposes over the catalyst with a higher rate.
For Case I, AF does not take part in the reaction; for Case II, a linear response with the same reaction order as that of FA should be observed, which is not consistent with the experimental results; for Case III, AF with a higher dehydrogenation activity can indeed exhibit a higher reaction order.
For Case III, AF decomposes following eqn (5):
 | (5) |
HCO3− can react with concentrated FA according to eqn (6):
 | (6) |
Thus, the overall reaction for dehydrogenation of FA can be written as:61
 | (7) |
Eqn (7) suggests that, when there is sufficient FA, AF will not decompose. In other words, in FA–AF mixture, FA will decompose first with AF serving as a catalyst.
When FA is completely consumed, AF begins to decompose through the following reactions:62
| HCOONH4 → HCOO− + NH+4 | (8) |
 | (9) |
| HCO−3 + NH+4 ⇌ H2O + NH3↑ + CO2↑ | (10) |
Eqn (10) is a double hydrolysis reaction with the hydrolysis of HCO3− and NH4+ enhancing each other. At this moment, the overall reaction is
 | (11) |
For FA–AF system with a high concentration of FA, H+ is plentiful such that the supply of H+ does not depend on the hydrolysis of NH4+.50 The presence of a high concentration of FA can block the direct dehydrogenation of AF. However, if the reaction rate of eqn (9) is not fast enough, there is a possibility for the FA–AF system to sent off NH3 which is harmful for the further application of hydrogen. NH3 as a possible contaminant should be concerned.
According to Fig. 7(A), the initial dehydrogenation rate increases with increasing reaction temperature. The FA–AF mixture with 5 mol L−1 FA and 7.5 mol L−1 AF offers the highest initial TOF of for the first 10 min of 407.5 h−1 over the Au3Pd1/C catalyst at 365 K. The increased dehydrogenation activity of FA over the AuPd-based catalysts can also be confirmed.36,45 According to Fig. 7(B), the apparent activation energy was 23.3 ± 1.3 kJ mol−1, lower than that of some previous reports (Table S4†). On the other hand, the AuPd/C catalyst used in this study is prepared without addition of any stabilizer, and the preparation procedure is more producible and facial than that reported elsewhere.
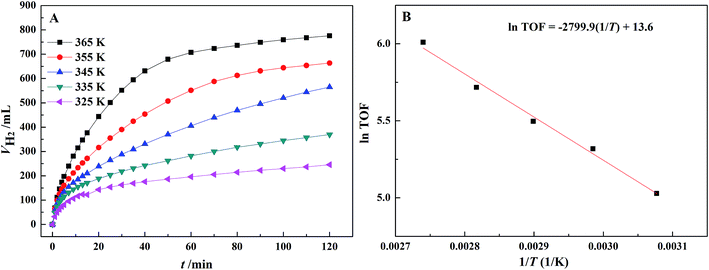 | ||
| Fig. 7 (A) Effect of temperature on the dehydrogenation of 5 mL FA–AF mixture containing 5 mol L−1 FA and 7.5 mol L−1 AF over the Au3Pd1/C catalyst; (B) Arrhenius plot of the dehydrogenation. | ||
3.4 Stability of the catalyst
The stability of the catalyst was investigated by using the recovered Au3Pd1/C for subsequent dehydrogenation runs. According to Fig. 8, the maximum H2 volume produced over the newly prepared Au3Pd1/C catalyst was 856.0 mL. For the 2nd, 3rd and 4th run, the maximum H2 volumes produced over the recovered Au3Pd1/C catalysts were 786.3 mL, 704.0 mL, and 769.5 mL, respectively. Therefore, the maximum H2 volume for the 4th run remains ca. 88.0% of the first run. This result suggests that the stability of the Au3Pd1/C catalyst is much better than that of the single Pd/C catalyst as we expected.51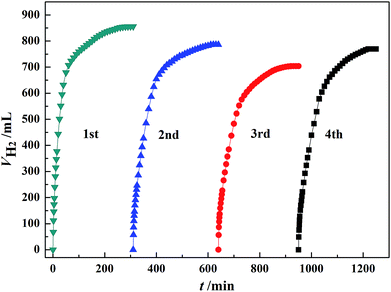 | ||
| Fig. 8 Dehydrogenation of 5 mL FA–AF mixture containing 5 mol L−1 FA and 7.5 mol L−1 AF over 60 mg of newly prepared and recovered Au3Pd1/C catalysts at 365 K. | ||
In Fig. S2,† according to the TEM images and the particle size distribution, the mean particle size of the recovered Au3Pd1 NPs was 4.46 nm after the first run and 4.43 nm after the fourth run. This means the aggregation of the Au3Pd1 NPs during dehydrogenation is not obvious.
3.5 Purity of hydrogen
According to the above results, the FA–AF mixture with 5 mol L−1 FA and 7.5 mol L−1 AF over the Au3Pd1/C catalyst at 365 K is an appealing system with enhanced activity and improved stability for hydrogen generation. However, owing to reactions (2), (10) and (11), CO and NH3 may possibly generate during dehydrogenation. These two contaminants are both harmful to the Pt catalyst used in hydrogen–oxygen fuel cell. It was found that even the content of NH3 is as low as 1 ppm, it can significantly deteriorate the performance of the proton exchange membrane fuel cells (PEMFC).63–65 Therefore, the content of CO and NH3 in hydrogen was both monitored.According to the results shown in Fig. S5 and S6,† the content of CO is less than the detection limit (ca. 5 ppm). This means that the production of CO is not obvious for our new system. According to Fig. S7,† the content of NH3 changes with temperature. At 365 K, the NH3 content is very high due to the enhanced double hydrolysis as shown in eqn (10) and the reduced solubility of NH3 in water. If we reduced the reaction temperature, the NH3 content in hydrogen reduced significantly. However, even if the reaction temperature is reduced to 325 K, the NH3 content still remains at 29.6 ± 4.6 ppm, which is still higher than the permitted value. This is can be attributed to the small rate of eqn (6). If we want to use FA–AF mixture and Au3Pd1/C catalyst for hydrogen production, more effort should be made to accelerate eqn (6) and reduce reaction temperature without obvious lowering of the catalytic activity.
4. Conclusions
Compared to the single Pd/C catalyst, the Au3Pd1/C catalyst exhibits improved activity and stability towards the dehydrogenation of FA–AF mixture. The reaction order with respect to AF and FA is 0.55 and 0.25, respectively. The dehydrogenation mechanism for FA–AF mixture is complicated. AF acts as a catalyst for the dehydrogenation of FA and can also undergo dehydrogenation even if FA is enough. Further effort should be made to reduce the NH3 content before the FA–AF mixture with Au3Pd1 NPs serving as catalyst can be used as promising hydrogen storage materials.Conflicts of interest
There are no conflicts to declare.Acknowledgements
This work was financially supported by the Shandong Self Innovation project (No. 012CX80106).Notes and references
- A. Züttel, A. Remhof, A. Borgschulte and O. Friedrichs, Philos. Trans. R. Soc., A, 2010, 368, 3329–3342 CrossRef PubMed.
- E. S. Hanley, J. P. Deane and B. P. Ó. Gallachóir, Renewable Sustainable Energy Rev., 2018, 82, 3027–3045 CrossRef.
- P. P. Edwards, V. L. Kuznetsov, W. I. F. David and N. P. Brandon, Energy Policy, 2008, 36, 4356–4362 CrossRef.
- M. Balat, Int. J. Hydrogen Energy, 2008, 33, 4013–4029 CrossRef CAS.
- N. Muradov and T. Veziroglu, Int. J. Hydrogen Energy, 2008, 33, 6804–6839 CrossRef CAS.
- A. F. Dalebrook, W. Gan, M. Grasemann, S. Moret and G. Laurenczy, Chem. Commun., 2013, 49, 8735–8751 RSC.
- M. Felderhoff, C. Weidenthaler, R. von Helmolt and U. Eberle, Phys. Chem. Chem. Phys., 2007, 9, 2643–2653 RSC.
- A. W. C. van den Berg and C. O. Areán, Chem. Commun., 2008, 668–681 RSC.
- M. Nielsen, A. Kammer, D. Cozzula, H. Junge, S. Gladiali and M. Beller, Angew. Chem., Int. Ed., 2011, 50, 9593–9597 CrossRef CAS PubMed.
- T. C. Johnson, D. J. Morris and M. Wills, Chem. Soc. Rev., 2010, 39, 81–88 RSC.
- S. Enthaler, J. von Langermann and T. Schmidt, Energy Environ. Sci., 2010, 3, 1207–1217 RSC.
- H. L. Jiang, S. K. Singh, J. M. Yan, X. B. Zhang and Q. Xu, ChemSusChem, 2010, 3, 541–549 CrossRef CAS PubMed.
- B. Loges, A. Boddien, F. Gärtner, H. Junge and M. Beller, Top. Catal., 2010, 53, 902–914 CrossRef CAS.
- K. Mandal, D. Bhattacharjee and S. Dasgupta, Int. J. Hydrogen Energy, 2015, 40, 4786–4793 CrossRef CAS.
- M. Grasemann and G. Laurenczy, Energy Environ. Sci., 2012, 5, 8171–8181 RSC.
- Y. Zhu, Y. Kang, Z. Zou, Q. Zhou, J. Zheng, B. Xia and H. Yang, Fuel Cells Bulletin, 2008, 2008, 12–15 CrossRef.
- J. J. Baschuk and X. G. Li, Int. J. Energy Res., 2001, 25, 695–713 CrossRef CAS.
- W. Wang, W. Wang and S. Chen, Int. J. Hydrogen Energy, 2016, 41, 20680–20692 CrossRef CAS.
- K. Tedsree, T. Li, S. Jones, C. W. Chan, K. M. Yu, P. A. Bagot, E. A. Marquis, G. D. Smith and S. C. Tsang, Nat. Nanotechnol., 2011, 6, 302–307 CrossRef CAS PubMed.
- Z. Z. Wang, H. Y. Zhang, L. Li, S. S. Miao, S. J. Wu, X. F. Hao, W. X. Zhang and M. J. Jia, Catal. Commun., 2018, 114, 51–55 CrossRef CAS.
- S. Q. Zhang, Y. R. Lee, H. J. Jeon, W. S. Ahn and Y. M. Chung, Mater. Lett., 2018, 215, 211–213 CrossRef CAS.
- M. Navlani-García, D. Salinas-Torres, K. Mori, A. F. Léonard, Y. Kuwahara, N. Job and H. Yamashita, Catal. Today, 2019, 324, 90–96 CrossRef.
- Q. Y. Bi, J. D. Lin, Y. M. Liu, H. Y. He, F. Q. Huang and Y. Cao, Angew. Chem., Int. Ed., 2016, 55, 11849–11853 CrossRef CAS PubMed.
- Q. L. Zhu, N. Tsumori and Q. Xu, J. Am. Chem. Soc., 2015, 137, 11743–11748 CrossRef CAS PubMed.
- M. Yadav, A. K. Singh, N. Tsumori and Q. Xu, J. Mater. Chem., 2012, 22, 19146–19150 RSC.
- S. Akbayrak, Y. Tonbul and S. Özkar, Appl. Catal., B, 2017, 206, 384–392 CrossRef CAS.
- Y. Q. Chen, X. F. Li, Z. Z. Wei, S. J. Mao, J. Deng, Y. L. Cao and Y. Wang, Catal. Commun., 2018, 108, 55–58 CrossRef CAS.
- Q. Y. Bi, J. D. Lin, Y. M. Liu, F. Q. Huang and Y. Cao, Int. J. Hydrogen Energy, 2016, 41, 21193–21202 CrossRef CAS.
- Q. G. Liu, X. F. Yang, Y. Q. Huang, S. T. Xu, X. Su, X. L. Pan, J. M. Xu, A. Q. Wang, C. H. Liang, X. K. Wang and T. Zhang, Energy Environ. Sci., 2015, 8, 3204–3207 RSC.
- D. A. Bulushev, M. Zacharska, Y. N. Guo, S. Beloshapkin and A. Simakov, Catal. Commun., 2017, 92, 86–89 CrossRef CAS.
- M. Ojeda and E. Iglesia, Angew. Chem., Int. Ed., 2009, 48, 4800–4803 CrossRef CAS PubMed.
- M. Yadav, T. Akita, N. Tsumori and Q. Xu, J. Mater. Chem., 2012, 22, 12582–12586 RSC.
- Q. Y. Bi, J. D. Lin, Y. M. Liu, H. Y. He, F. Q. Huang and Y. Cao, J. Power Sources, 2016, 328, 463–471 CrossRef CAS.
- R. H. Li, X. H. Zhu, X. Q. Yan, D. H. Shou, X. Zhou and W. X. Chen, RSC Adv., 2016, 6, 100103–100107 RSC.
- F. Abild-Pedersen and M. P. Andersson, Surf. Sci., 2007, 601, 1747–1753 CrossRef CAS.
- X. Zhou, Y. Huang, W. Xing, C. Liu, J. Liao and T. Lu, Chem. Commun., 2008, 3540–3542 RSC.
- W. Y. Yu, G. M. Mullen and C. B. Mullins, J. Phys. Chem. C, 2013, 117, 19535–19543 CrossRef CAS.
- S. Singh, S. Li, R. Carrasquillo-Flores, A. C. Alba-Rubio, J. A. Dumesic and M. Mavrikakis, AIChE J., 2014, 60, 1303–1319 CrossRef CAS.
- D. Liu, Z. Y. Gao, X. C. Wang, J. Zeng and Y. M. Li, Appl. Surf. Sci., 2017, 426, 194–205 CrossRef CAS.
- L. X. Xu, F. Yao, J. L. Luo, C. Wan, M. F. Ye, P. Cui and Y. An, RSC Adv., 2017, 7, 4746–4752 RSC.
- Y. L. Qin, J. W. Wang, Y. M. Wu and L. M. Wang, RSC Adv., 2014, 4, 30068–30073 RSC.
- S. Wu, F. Yang, P. C. Sun and T. H. Chen, RSC Adv., 2014, 4, 44500–44503 RSC.
- Y. Q. Jiang, X. L. Fan, X. Z. Xiao, X. Huang, M. J. Liu, S. Q. Li, H. W. Ge and L. X. Chen, Int. J. Hydrogen Energy, 2017, 42, 9353–9360 CrossRef CAS.
- X. Gu, Z. H. Lu, H. L. Jiang, T. Akita and Q. Xu, J. Am. Chem. Soc., 2011, 133, 11822–11825 CrossRef CAS PubMed.
- Y. J. Huang, X. C. Zhou, M. Yin, C. P. Liu and W. Xing, Chem. Mater., 2010, 22, 5122–5128 CrossRef CAS.
- J. Guo, Y. Y. Gao, C. H. Tan, Y. P. Li, S. L. Zhao, L. Z. Bai and S. Y. Zhang, Fuel Cells, 2013, 13, 167–172 CrossRef CAS.
- K. Jiang, K. Xu, S. Zou and W. B. Cai, J. Am. Chem. Soc., 2014, 136, 4861–4864 CrossRef CAS.
- L. Yang, X. Hua, J. Su, W. Luo, S. L. Chen and G. Z. Cheng, Appl. Catal., B, 2015, 168–169, 423–428 CrossRef CAS.
- L. Yang, W. Luo and G. Z. Cheng, Int. J. Hydrogen Energy, 2016, 41, 439–446 CrossRef CAS.
- J. Su, L. Yang, M. Lu and H. Lin, ChemSusChem, 2015, 8, 813–816 CrossRef CAS PubMed.
- J. P. Zhou, J. Zhang, X. H. Dai, X. Wang and S. Y. Zhang, Int. J. Hydrogen Energy, 2016, 41, 22059–22066 CrossRef CAS.
- P. Liu, X. Gu, H. Zhang, J. Cheng, J. Song and H. Su, Appl. Catal., B, 2017, 204, 497–504 CrossRef CAS.
- NIST XPS Database, http://srdata.nist.gov/xps/selEnergyType.aspx, accessed September 2012 Search PubMed.
- Z. L. Wang, J. M. Yan, H. L. Wang, Y. Ping and Q. Jiang, J. Mater. Chem. A, 2013, 1, 12721–12725 RSC.
- Z. Y. Zhang, S. W. Cao, Y. S. Liao and C. Xue, Appl. Catal., B, 2015, 62, 204–209 CrossRef.
- X. Zhou, Y. Huang, C. Liu, J. Liao, T. Lu and W. Xing, ChemSusChem, 2010, 3, 1379–1382 CrossRef CAS PubMed.
- Z. L. Wang, J. M. Yan, Y. Ping, H. L. Wang, W. T. Zheng and Q. Jiang, Angew. Chem., 2013, 125, 4502–4505 CrossRef.
- J. Joo, T. Uchida, A. Cuesta, M. T. Koper and M. Osawa, J. Am. Chem. Soc., 2013, 135, 9991–9994 CrossRef CAS PubMed.
- B. Peng, H. F. Wang, Z. P. Liu and W. B. Cai, J. Phys. Chem. C, 2010, 114, 3102–3107 CrossRef CAS.
- H. F. Wang and Z. P. Liu, J. Phys. Chem. C, 2009, 113, 17502–17508 CrossRef CAS.
- X. Wang, G. W. Qi, C. H. Tan, Y. P. Li, J. Guo, X. J. Pang and S. Y. Zhang, Int. J. Hydrogen Energy, 2014, 39, 837–843 CrossRef CAS.
- M. A. Tike and V. V. Mahajani, Chem. Eng. J., 2006, 123, 31–41 CrossRef CAS.
- R. Halseid, P. J. S. Vie and R. Tunold, J. Power Sources, 2006, 154, 343–350 CrossRef CAS.
- F. A. Uribe, S. Gottesfeld and T. A. Zawodzinski, J. Electrochem. Soc., 2002, 149, A293–A296 CrossRef CAS.
- H. J. Soto, W. K. Lee, J. W. Van Zee and M. Murthy, Electrochem. Solid-State Lett., 2003, 6, A133–A135 CrossRef CAS.
Footnote |
| † Electronic supplementary information (ESI) available. See DOI: 10.1039/c8ra09534e |
| This journal is © The Royal Society of Chemistry 2019 |

