 Open Access Article
Enhanced quinoline removal by zero-valent iron-coupled novel anaerobic processes: performance and underlying function analysis†
Sufang Wang ,
Aijuan Zhou
 ,
Jiaguang Zhang,
Zhaohua Liu,
Jierong Zheng,
Xiaochan Zhao and
Xiuping Yue*
College of Environmental Science and Engineering, Taiyuan University of Technology, Taiyuan 030024, Shanxi Province, China. E-mail: wangsufang@tyut.edu.cn; yuexiuping@tyut.edu.cn; Fax: +86-0351-3176581; Tel: +86-0351-3176581
First published on 9th January 2019
Abstract
Quinoline is toxic and difficult to degrade biologically; thus, it is a serious threat to the safety of ecosystems. To promote quinoline reduction, zero-valent iron (ZVI) was introduced into an anaerobic digestion (AD) system through batch experiments. The performance of three different types of ZVI (i.e., iron powder, iron scrap and rusty iron scrap) on quinoline degradation, methane production, formation of volatile fatty acids (VFAs) and chemical oxygen demand (COD) removal were investigated systematically. Compared to the AD system alone, quinoline and COD removal as well as the production of methane and acetic acid were effectively enhanced by ZVI, especially rusty iron scrap. The removal efficiencies of quinoline and COD were increased by 28.6% and 19.9%, respectively. The enhanced effects were attributed to the high accumulation of ferrous ions and high pH self-buffering capability, which were established by ZVI addition. Furthermore, high-throughput sequencing analysis indicated that the functional microorganisms in the ZVI-AD system were higher than in the AD system, and the added types of ZVI played important roles in structuring the innate microbial community in waste activated sludge (WAS). Especially, high enrichment of microorganisms capable of degrading quinoline, such as Pseudomonas and Bacillus, in the coupled system was detected.
1. Introduction
Quinoline is extensively used in the synthesis of dyes, pharmaceuticals and other reagents, and it is typically present in released wastewater.1 Due to the N atom incorporated in the ring system, the water solubility of quinoline increases greatly thereby, enhancing its bio-availability with an increased risk to the environment. Quinoline is difficult to degrade biologically; therefore, it has become one of the most common contaminants in soil and groundwater, especially near fossil fuel facilities, landfills, coal tar distillation plants and creosote wood preservation facilities.2,3 Some studies have found that quinoline is harmful to the environment and toxic to organisms; also, it is a known carcinogen.4,5 Therefore, it is necessary to investigate treatment processes to efficiently decompose this toxic refractory compound.Prior research has been conducted on the removal of quinoline, and the various existing remediation technologies can be divided into three methods: physical, chemical and biological.6 For physical methods, the treatment of quinoline wastewater only changes the existing phase of quinoline; it cannot degrade quinoline into non-toxic and harmless substances.7 Advanced oxidation processes, as common chemical methods, are expensive and complicated to operate; this limits their large-scale application in practical engineering.8 In general, biological treatments offer potential economical advantages over physicochemical and chemical methods for quinoline treatment, including low cost and high efficiency.9 The biological treatment processes of quinoline mainly comprise aerobic and anaerobic degradation.10 Aerobic treatment is well documented as an efficient method of removing quinoline, and its degradation pathway and degrading bacteria have also been verified.11 Because severely polluted environments are often anoxic, aerobic quinoline degradation is often restricted. Anaerobic digestion (AD) as a viable alternative to aerobic treatment technologies has been widely accepted in the past decades for the treatment of refractory organic wastes and some hazardous chemicals because of its flexibility, low sludge production, high efficiency and bioenergy generation.12–14 For example, Johansen et al. reported that quinoline was initially oxidized to 2(1H)-quinolones and then oxidized to 3,4-dihydro-2(1H)-quinolones under anaerobic conditions.15 Li et al. investigated the effective elimination of quinolinic compounds, including quinoline and its derivatives, under denitrifying conditions with acclimated activated sludge.16 Unfortunately, AD processes are often limited by slow degradation rates and unstable performance. Many hazardous compounds such as quinoline are toxic to microorganisms in biological wastewater treatment systems at high concentrations and are inadequately removed in conventional AD processes. There have been some attempts to improve AD processes from WAS, such as chemical, thermal, and mechanical methods.17–19 However, most of these methods require large amounts of chemicals or high energy input.20,21 Therefore, an alternative cost-effective approach to enhance quinoline degradation and methane production from WAS in AD processes is urgently needed.
As a reductive agent, zero-valent iron (ZVI) has been universally used in wastewater treatment due to its cost-effectiveness and reliability.22,23 Some environmental contaminants, such as chlorinated hydrocarbons, pesticides, heavy metals and nitrobenzene, can be effectively transformed in ZVI processes.24 In consideration of its reductive properties, ZVI is expected to be useful in the creation of an increased anaerobic environment, which can be beneficial to improving the performance of anaerobic reactions associated with wastewater treatment. When utilized in an AD system, ZVI can decrease the oxidation reduction potential (ORP) and act as an acid buffer, which is essential for maintaining a favorable and stable environment for the treatment of contaminants. Also, the corrosion products of ZVI, such as Fe(OH)2 and Fe(OH)3, can provide additional alternatives for contaminant removal beyond acid buffering, through flocculation, adsorption and precipitation.25 More importantly, the H2 released in the ZVI corrosion process can become an alternative electron donor for denitrifying and methanogenic bacteria as well as other reduction-related species.26 Therefore, the combination of ZVI and biological processing for the reduction of sulfates, nitrates, chlorinated aromatics and azo dyes by microorganisms has been extensively studied.27–29 It has been determined that the removal of chemical oxygen demand (COD) and the production of methane were significantly improved and the microbial strains responsible for refractory compound degradation were enriched when an anaerobic reactor was packed with ZVI.30 Although the preliminary concept of utilizing ZVI is based on its corrosive products, systematic investigation of ZVI-coupled AD systems in contaminant reduction processes remains limited. Furthermore, the coupling of ZVI with AD processes for quinoline degradation and the underlying function of ZVI in the coupled system is still not fully understood.
Therefore, ZVI was coupled with an AD system (ZVI-AD) with the aim of accelerating quinoline removal and methane production. Specially, the influences of three different types of ZVI, namely iron powder (IP), iron scrap (IS) and rusty iron scrap (RIS), in the ZVI-AD system were studied in terms of pH, volatile fatty acids (VFAs), methane and iron ion concentration analysis. Moreover, the microbial community structure of the 16S rRNA gene was determined to provide important information and consequently improve our understanding of the microbial response mechanism for ZVI-treated waste activated sludge (WAS).
2. Materials and methods
2.1 Chemicals and media
Standard analytical quinoline was obtained from Sigma Chemical Co. (St. Louis, USA). ZVI powder (particle size < 0.15 mm, purity > 99%) was purchased from Sinopharm Chemical Reagent Co. Ltd. (Shanghai, China). ZVI was pretreated with 2 M hydrochloric acid, deoxygenated water and acetone before use and was dried with nitrogen. All other chemicals were of analytical grade and were purchased from local suppliers.2.2 Batch experiments and operation
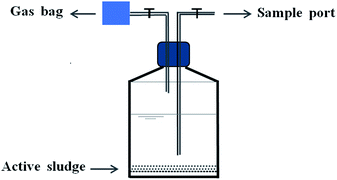
The activated sludge culture used for this study was obtained from an anaerobic pool of a coking wastewater treatment plant (Taiyuan City, China). Prior to use, the activated sludge was concentrated by settling for 24 h at 4 °C; then, the supernatant was removed. After that, the concentrated activated sludge was screened with a 40-mesh sieve to prevent clogging problems. The quantity of seeding sludge was 6.1 g L−1 of MLVSS (mixed liquor volatile suspended solids).A series of batch experiments were established to study the quinoline reduction process in the ZVI-AD system. Batch experiments were performed in 12 serum bottles. As shown in Fig. 1, these serum bottles with working volumes of 300 mL each containing WAS, trace elements and the corresponding concentration of quinoline were divided into four groups of three replicates. Prior to the experiments, the bottles were aerated with nitrogen gas to remove residual oxygen. Each bottle was equipped with one injection/sampling port and gas outlet connected with a gas bag. Liquid and gas samples were collected by the injector and gas bag. All bottles were capped and placed in an air bath shaker at 180 rpm. The temperature of the bath shaker was maintained at 35 ± 1 °C.
During the WAS acclimatization stage, the quinoline concentration gradually increased from 10 to 50 mg L−1 in units of 10 mg L−1. The WAS acclimatization of the 12 serum bottles lasted for approximately three months. After that, the AD system entered the cyclic degradation stage. In the cyclic stage, liquid and gas samples were taken from the 12 bottles every 4 days at 24 h intervals and subjected to subsequent COD, TOC, VFAs, methane and quinoline concentration analyses. The feed stock in group I contained only activated WAS and will be referred to as the control test hereinafter.
2.3 Microbial community structure analysis
The diversity of the microbial community was analyzed by IlluminaMiSeq sequencing. The DNA extraction method was described in our previous study.31 The commonly used PCR primers 341F and 805R were applied to amplify the V3–V4 region of the bacterial 16S RNA gene. DNA sequencing was completed by Shanghai Bioengineering Co., Ltd. Raw sequences of the sludge samples have been deposited in the NCBI Short Read Archive (SRA) database with the accession number SRR6517752. In order to minimize the effects of random sequencing errors, the adapters, barcodes, and primers for all raw sequences were trimmed. Additionally, some sequences shorter than 350 bp or containing ambiguous base calls were removed. The remaining sequences were clustered into operational taxonomic units (OTUs) using a 97% identity threshold (3% dissimilarity level). Rarefaction curves were generated and α-diversity measurements, including the Shannon indices, Simpson indices, ACE index and Chaol index, were calculated for each sample. The distance matrices generated by the phylogenetic-based method UniFrac32 were used to calculate the beta diversity and then visualized using principal coordinates analysis (PCoA).2.4 Analysis and calculation method
After anaerobic fermentation, the sludge samples were centrifuged at 8000 g, filtered through a 0.45 μm cellulose nitrate membrane filter and finally stored at 4 °C prior to analysis. The concentration of quinoline was monitored using high-performance liquid chromatography HPLC, 1260, Agilent, NC equipped with a Zorbax eclipse XDB-C18 column (250 mm × 4.6 mm). A methanol-water mixture (60/40, v/v) was used as the mobile phase at a flow rate of 1.0 mL min−1. The injection volume for all samples was 10 μL, and the wavelength for the UV detector was 227 nm. The solution pH was measured using a pH meter (Mettler Toledo FE28). The concentrations of ferric ion (Fe3+) and ferrous iron (Fe2+) were measured by the 1,10-phenanthroline colorimetric method using a UV/visible spectrophotometer (Ultrospec 4300 Pro) at wavelengths of 540 and 510 nm, respectively. The concentrations of TOC and total dissolved iron, justified by filtering through 0.45 μm membranes, were determined by TOC analysis (Shimadzu TOC-5000A) and atomic absorbance spectrometry (AAS, Varian 220FS), respectively. The COD was determined using the standard potassium dichromate method.33 The biogas produced was collected in gas-sampling bags, and the total volume of gas was measured using a glass syringe. The gas and VFA compositions were analyzed using a gas chromatograph (GC, 4890D, Agilent). The VFA information analysis was also described in our previous study.313. Results and discussion
3.1 Effects of initial pH on quinoline degradation
As proven in a previous study, pH often affects the activity and community structure of anaerobic microorganisms because most anaerobic bacteria can only survive in the pH range of 4.0 to 8.5. As such, the degradation efficiency of quinoline can vary with different initial pH conditions in free AD, ZVI and ZVI-AD systems. Fig. 2A indicates that the quinoline degradation capability of a free anaerobic system increased significantly as the pH shifted toward alkaline conditions (6.5 to 8.5). In contrast, the removal of quinoline in a free ZVI system changed slowly and remained at a low level across the pH range of 6.5 to 8.5 (Fig. 2B). For the ZVI-AD system, the degradation efficiency of quinoline was gradually enhanced with increasing pH and reached a maximum at a pH of 7.5 (Fig. 2C). Especially, after 96 h of reaction, the degradation rates of quinoline were 63.3%, 71.3%, 76.7%, 70.0%, and 64.6% at pH values of 6.5, 7.0, 7.5, 8.0 and 8.5, respectively. Obviously, neutral pH was favorable for quinoline degradation from WAS during AD processes by ZVI. This suggests that neutral pH provides a more favorable environment for the growth of functional microorganisms in the coupled system and therefore causes increased quinoline degradation.34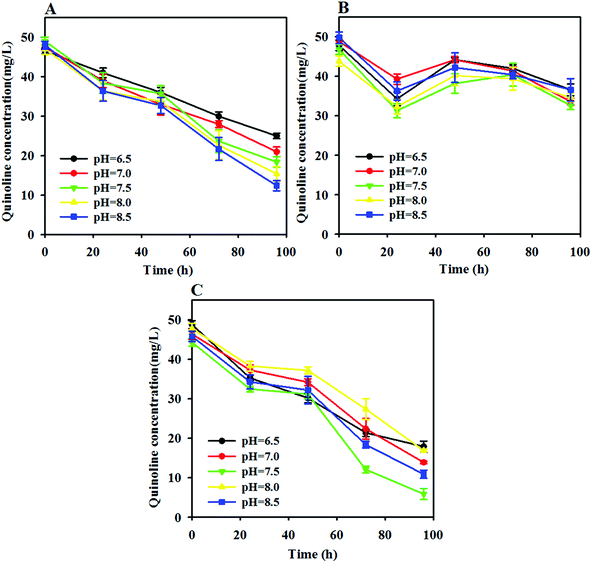 | ||
| Fig. 2 Effects of the initial pH value on the degradation of quinoline in the AD (A), ZVI (B) and ZVI-AD (C) systems. | ||
3.2 Effects of ZVI addition on quinoline degradation
ZVI addition plays a role in wastewater treatment technology, and the concentration of ZVI varies when processing different substrates. Therefore, the effects of the added dose and type of ZVI, such as IP, IS and RIS, on quinoline degradation were investigated. In the ZVI dosing optimization analysis, IP as a representative ZVI was examined because of its high specific surface area and reactivity.35 Fig. 3A shows that the quinoline degradation rate increased with increasing ZVI dose and then decreased with further increase of the ZVI concentration over 3.0 g L−1. The maximum quinoline degradation rate occurred at 3.0 g L−1 ZVI, which indicates that a lower ZVI dose can result in a decrease of the production rate of hydrogen, thereby failing to fully provide for the electron donor needs of the anaerobic microorganisms.34,36 However, iron powder corrosion can produce sufficient hydroxide ions if the dose is too high, leading to an increase in the pH of the solution and thereby inhibiting the microorganismal activity.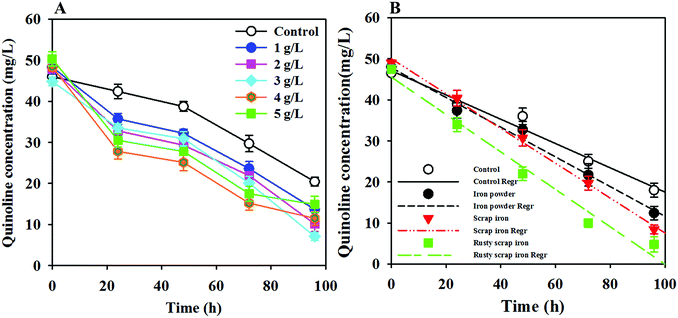 | ||
| Fig. 3 Effects of the added ZVI dosage (A) and type (B) on the degradation of quinoline in the ZVI-AD system. | ||
The ZVI-AD system is a solid–liquid heterogeneous reaction system. The degradation of quinoline by ZVI is neither a reductive reaction nor a catalytic reaction; it depends on ZVI and other reductants derived from the corrosion of ZVI in the reaction solution, such as Fe2+ and H2. In fact, because the adsorption and reductive reactions should occur simultaneously, it is very difficult to determine the adsorption of quinoline on the ZVI surface. Thus, quinoline removal kinetics may follow the zeroth-order kinetic model or the first-order kinetic model; the specific situation is based on the experimental data. As shown in Fig. 3B, the degradation of quinoline in the ZVI-AD and AD control systems could be properly fitted by the zeroth-order kinetic model. The rate constants (k0) and regression coefficients (R2) relevant to the zero kinetic model are shown in Table 1. Obviously, the initial degradation rate follows the order of RIS > IS > IP > control. This result suggests that ZVI addition can greatly enhance the degradation of quinoline in an AD system, and RIS is the most effective type of ZVI for promoting quinoline degradation by WAS. The higher performance of ZVI may be due to the synergistic interaction between ZVI and anaerobic microorganisms. However, the adsorption of quinoline on the ZVI surface was negligible because the ZVI used in this study had few surface sites amenable for quinoline adsorption, as indicated by the minimal removal of quinoline at the early stage in the ZVI control system (Fig. 2B).
| Name | R2 | k0 |
|---|---|---|
| Control | 0.9765 | 0.30 |
| IP | 0.9886 | 0.36 |
| IS | 0.9968 | 0.42 |
| RIS | 0.9807 | 0.46 |
3.3 Effects of ZVI addition type on COD, TOC, methane, pH, VFAs production and composition changes during quinoline degradation
The effects of three types of ZVI, i.e., IP, IS and RIS, on COD removal, methane production, pH, VFA production and composition were evaluated. As shown in Fig. 4A, 3.0 g L−1 IP, IS and RIS led to 12.8%, 21.5% and 28.6% increases in quinoline degradation, respectively, compared to the 96 h control. The production of methane in the process of quinoline degradation is also shown in Fig. 4A. The level of methane production was minimal during the first 24 h and then gradually increased up to 48 h. This phenomenon results from anaerobic microorganisms being subjected to hydrolysis and acid production during this period of time. The resulting VFAs could be further bioconverted to methane under anaerobic conditions. Finally, it was found that the cumulative amounts of methane from the control and the other three types of ZVI were 8.0, 17.5, 26.9 and 33.7 mL, respectively. Obviously, the groups treated with ZVI had significantly higher cumulative volumes of methane than the control, and the RIS group was more effective than other groups for improving methane production from WAS. The dynamic changes in pH during quinoline degradation also reflect the influences of the type of ZVI added and other important biochemical processes (Fig. 4B). The VFA generation and ZVI dissolution in the quinoline degradation process were accompanied by pH changes in the mixed liquor because the former process produces hydrogen ions, while the latter generates hydroxyl ions. For example, the pH in the control group decreased from 8.2 to 6.0 throughout the digestion; meanwhile, that in the ZVI-coupled group decreased from 8.2 to 7.1 on day two because of VFA formation and then reached a maximum due to continued ZVI dissolution. Interestingly, the addition of RIS led to a gradual decrease in pH to 7.6 at the end of digestion. In addition, the removal of COD and TOC was found to be obviously improved in the ZVI-AD system (Fig. 4C and D), and the degradation curves of COD and TOC were consistent with quinoline degradation. The elevated COD removal can be ascribed to the increase of acidogenesis, acetogenesis or methanogenesis by ZVI. A previous study indicated that ZVI can strengthen the reductive environment and provide assistance in maintaining a relatively low ORP value in the anaerobic reactor;37 this improves acetogenesis, especially propionate degradation, and results in increased acetate production and decreased propionate accumulation. The total production of VFAs during the AD processes of WAS in the coupled system is shown in Fig. 4E. It can be seen that the concentration of VFAs sharply increased in the reactors from 72 h onward and then decreased minimally over time. Therefore, the optimal fermentation time for VFA production was 72 h. At that point in time, the maximum VFA concentrations were 806 ± 23, 921 ± 26 and 1004 ± 26 mg COD per L with the addition of IP, IS and RIS, respectively. The concentration for the control test (i.e., the sludge alone) was much lower, at 721 ± 23 mg COD per L. Obviously, VFA production was successfully increased by coupling WAS with the three types of ZVI, which is consistent with the conclusions obtained from the above cases. The reason for this may be that the ZVI coupling efficiently disintegrated the sludge into matrices and hydrolyzed the large organic molecules, which provided more substrates for subsequent anaerobic acidification. Meanwhile, the VFA production was closely related to the type of ZVI added. Interestingly, the time-course curves show that the order of the VFA concentration for the three types was also RIS > IS > IP. That is, coupling with RIS had the greatest effect on the recovery of VFAs from WAS. The individual VFA concentrations contributing to the total VFAs for the 72 h fermentation period are shown in Fig. 4F, in which the total VFA production reached a maximum in most of the reactors. When WAS hydrolysate is used as an external carbon source, the composition of the VFAs is critical in the whole system. HAc was the preferred substrate for biological nutrient removal among the six forms of VFAs. Specifically, HAc was the major component of the total VFAs, where RIS had the greatest effect (65.0% versus 40.0% in the control), followed by IS. HPr and n-Hbu were the second and third most abundant metabolites, respectively (Fig. 4F). These results appear to be in accordance with those of Wang et al., who revealed HAc and HPr to be the two most abundant components of VFAs, independent of the method of sludge treatment.38 This suggests that the acidification product spectrum is indeed affected by ZVI. Based on considerations of both production and composition, coupling with ZVI is ideal for harvesting VFAs as a target product from WAS digestion. The addition of RIS has the best promotion effect, likely because Fe(III)oxides present on the RIS surface can facilitate mass transfer and cause dissimilar Fe3+ reduction, enhancing the degradation of complex substrates such as WAS.39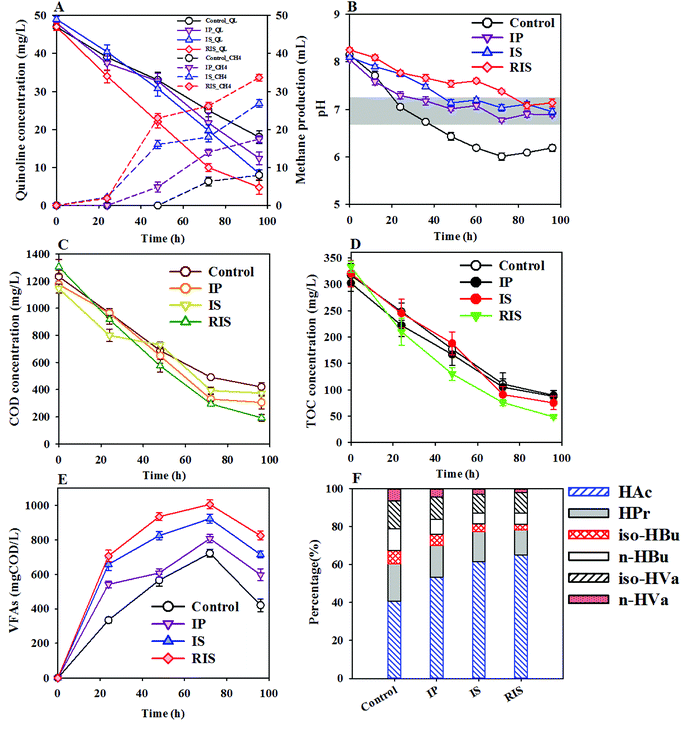 | ||
| Fig. 4 Effects of the type of added ZVI on methane production (A), pH (B), COD removal (C), TOC (D), VFA concentration (E) and VFA composition (F) in the ZVI-AD system. | ||
3.4 Effects of iron ion morphology on quinoline degradation
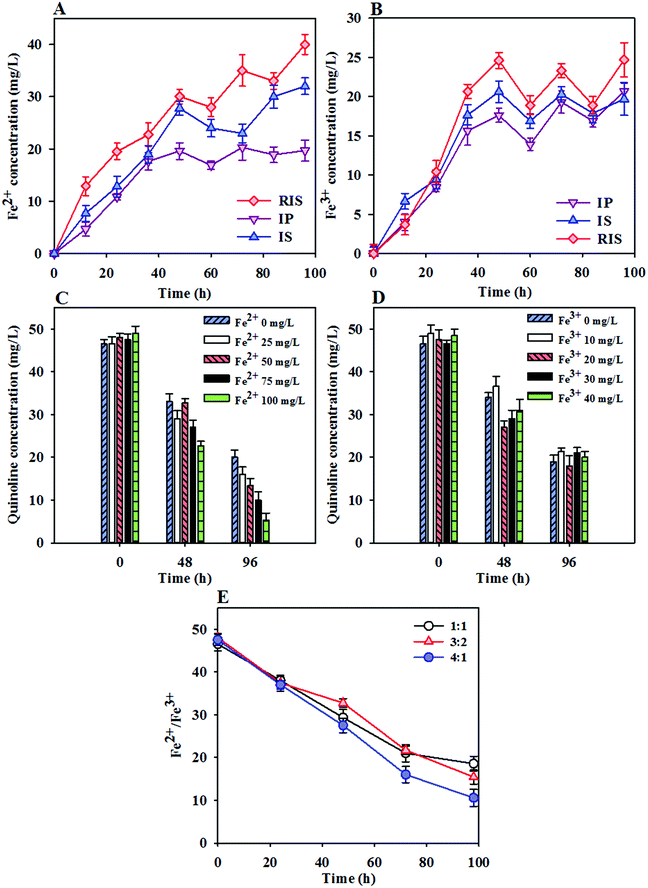
The enhanced quinoline degradation and methane production in the ZVI-coupled system indicate that ZVI can alter the sludge properties and increase the extent of sludge conversion. Under anaerobic conditions, ZVI is oxidized to Fe2+, resulting in gas production (Fe0 + 2H2O = Fe2+ + H2 + OH−) and thus leading to an obvious increase of iron ion content in the sludge. The changes in the Fe2+ and Fe3+ concentrations during quinoline degradation are shown in Fig. 5A and B. It can be seen that the Fe2+ and Fe3+ ion concentrations increased rapidly over time during the initial reaction period (0 to 48 h) and then decreased after 48 h. In the initial reaction, anaerobic microorganisms primarily fermented acid, which resulted in a significant decrease in pH in the short term and drove the pH down to the acidic range. Therefore, ZVI (IP, IS or RIS) undergoes a reduction reaction in the acidic environment, and Fe2+ and Fe3+ ions are thus produced in large quantities. With the consumption of VFAs and the production of methane, the pH of the system fluctuates, and the concentrations of Fe2+ and Fe3+ in the system also fluctuate before gradually reaching stable conditions. The results of the comparison of the Fe2+ and Fe3+ concentrations in the three systems follows the order of RIS > IS > IP, verifying the conclusions drawn in the previous section.To investigate the relationship between iron concentration and quinoline degradation, the effects of different iron ions on the degradation of quinoline in the coupling system were studied. As shown in Fig. 5C, the degradation rates of quinoline were 56.8%, 66.2%, 72.0%, 78.7% and 89.9% with Fe2+ concentrations of 0, 25, 50, 75 and 100 mg L−1, respectively. It can be seen that the increased Fe2+ concentration showed a good correlation with quinoline reduction. The enhancement of quinoline removal after the addition of Fe2+ indicated that Fe2+ not only acts as an inorganic nutrient for the growth and reproduction of microorganisms but can also be used as an electron donor for anaerobic microorganisms to increase the degradation rate of quinoline. However, with increasing Fe3+ concentration, the degradation rate of quinoline remained between 60% ± 3% (Fig. 5D). It can be concluded that Fe3+ ions have little effect on promoting the degradation of quinoline by anaerobic microorganisms within a relatively small concentration range. Fig. 5E shows the effects of Fe3+ and Fe2+ ions with different ratios on quinoline degradation, in which the ratios of iron ions in the solution were 1![[thin space (1/6-em)]](https://www.rsc.org/images/entities/char_2009.gif) :
:![[thin space (1/6-em)]](https://www.rsc.org/images/entities/char_2009.gif) 1, 3
1, 3![[thin space (1/6-em)]](https://www.rsc.org/images/entities/char_2009.gif) :
:![[thin space (1/6-em)]](https://www.rsc.org/images/entities/char_2009.gif) 2 and 4
2 and 4![[thin space (1/6-em)]](https://www.rsc.org/images/entities/char_2009.gif) :
:![[thin space (1/6-em)]](https://www.rsc.org/images/entities/char_2009.gif) 1. The results showed that the rate of quinoline degradation was highest when the ratio of Fe2+ and Fe3+ was 4
1. The results showed that the rate of quinoline degradation was highest when the ratio of Fe2+ and Fe3+ was 4![[thin space (1/6-em)]](https://www.rsc.org/images/entities/char_2009.gif) :
:![[thin space (1/6-em)]](https://www.rsc.org/images/entities/char_2009.gif) 1. It is presumed that the effect of Fe2+ on the degradation of quinoline by anaerobic microorganisms is greater than that of Fe3+, which further verifies the results provided in the previous section.
1. It is presumed that the effect of Fe2+ on the degradation of quinoline by anaerobic microorganisms is greater than that of Fe3+, which further verifies the results provided in the previous section.
3.5 Overall analysis of pyrosequencing
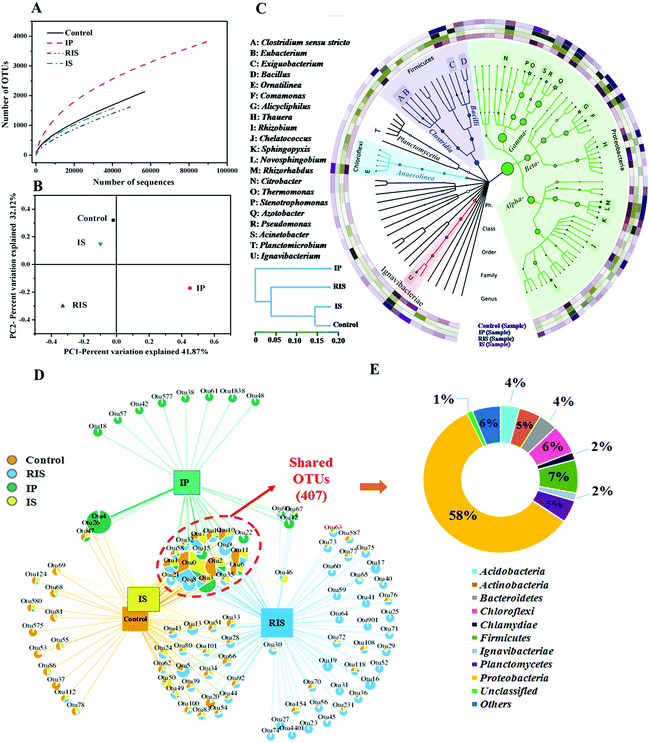
Microorganisms in the ZVI-AD system play important roles in quinoline degradation and methane production during fermentation of WAS; therefore, it is necessary to assess the diversity and distribution of the microbial community by high-throughput pyrosequencing analysis. As shown in Fig. 6A and Table S1,† the numbers of high-quality reads obtained for the control, IP, IS and RIS groups were 56![[thin space (1/6-em)]](https://www.rsc.org/images/entities/char_2009.gif) 853, 89
853, 89![[thin space (1/6-em)]](https://www.rsc.org/images/entities/char_2009.gif) 490, 40
490, 40![[thin space (1/6-em)]](https://www.rsc.org/images/entities/char_2009.gif) 777 and 49
777 and 49![[thin space (1/6-em)]](https://www.rsc.org/images/entities/char_2009.gif) 240 (average length of 447 bp), respectively. Furthermore, the numbers of measured OTUs at 3% distance for the four groups were 2134, 3823, 1591 and 1622, respectively. However, new bacterial phylo types continued to emerge even after 40
240 (average length of 447 bp), respectively. Furthermore, the numbers of measured OTUs at 3% distance for the four groups were 2134, 3823, 1591 and 1622, respectively. However, new bacterial phylo types continued to emerge even after 40![[thin space (1/6-em)]](https://www.rsc.org/images/entities/char_2009.gif) 777 observations with pyrosequencing. α-Diversity was used to assess the microbial diversity of the evolving communities (Table S1†). According to the Chao1 and ACE indexes, the larger the Chao1 and ACE index, the greater the species richness of the sample, which indicates that the relative abundance of species in the ZVI-AD system was lower than in the control system. Based on the Shannon and Simpson indices, the bacterial communities in the control and IP groups also showed higher diversity than those in the RIS and IS groups, which demonstrates that the microbial diversity of the IS and RIS groups was decreased compared to the control group. The reason for this may be that only some bacteria survived when ZVI was introduced into the AD system. That is, the addition of IS and RIS resulted in simultaneous increases in the proportions of functional microorganisms.
777 observations with pyrosequencing. α-Diversity was used to assess the microbial diversity of the evolving communities (Table S1†). According to the Chao1 and ACE indexes, the larger the Chao1 and ACE index, the greater the species richness of the sample, which indicates that the relative abundance of species in the ZVI-AD system was lower than in the control system. Based on the Shannon and Simpson indices, the bacterial communities in the control and IP groups also showed higher diversity than those in the RIS and IS groups, which demonstrates that the microbial diversity of the IS and RIS groups was decreased compared to the control group. The reason for this may be that only some bacteria survived when ZVI was introduced into the AD system. That is, the addition of IS and RIS resulted in simultaneous increases in the proportions of functional microorganisms.
Subsequently, the similarity of the microbiome was determined using β-diversity (Fig. 6B). Differences in the bacterial community structures of the four samples were identified by PCoA. According to the PCoA results, the communities in the control group were very different from those in the other groups (RIS and IP). This indicates that microbial flora undergo greater degrees of change after the addition of IP and RIS. The relative aggregations of the samples in the control group and IS group show that their microbial communities have a degree of similarity. This was also proven by the hierarchical clustering analysis (HCA) results (Fig. 6C), which also illustrate that the microbial communities of the control and IS groups were highly dissimilar to those of the IP and RIS groups. These results suggest that although the WAS microbial consortia shared the same initial source, the addition of different types of ZVI to the AD system indeed changed the bacterial community structure.
The sum of the OTUs in all the samples was 6962, among which 407 OTUs (8.2% of the total OTUs) were shared by the four samples (Fig. 6D). There were four main groups in the shared OTUs: Proteobacteria (58.2%), Firmicutes (7.4%), Chloroflexi (6.4%) and Planctomycetes (4.9%) (Fig. 6E). A number of microorganisms capable of degrading quinoline belong to the phylum Proteobacteria.40 Among these, the control and IS groups shared more OTUs (674, 9.7% of the total) than IP and RIS (528, 7.6%) and IS and RIS (464, 6.7%). 5860 OTUs (84.2% of the total OTUs) were unique to each of the four samples. This is consistent with the results obtained from PCoA and HCA.
3.6 Microbial community distribution and diversity analysis
To further study the diversity and distribution of the microbial community, phylogenetic analysis of the 16S rRNA gene sequences was conducted at the phylum, class and genus levels. It was found that the microbial community structures clearly changed when the AD system was coupled with different types of ZVI (Fig. 7). Proteobacteria, Firmicutes and Chloroflexi were the dominant phyla in all four groups (Fig. 7A); these are common fermentation phyla that are present in many AD reactors.41–43 In traditional AD processes, microbial composition is considered to be closely related to organic matter degradation and acid formation. The total proportions of dominant phyla were in the range of 87.7% to 96.0% across the four groups. The proportions of Proteobacteria in the four groups were 81.0%, 59.4%, 82.6% and 83.4%, respectively. It can be seen that the addition of IS and RIS had little effect on the dysplastic bacteria in the coupled systems. However, the addition of IP obviously decreased the content of Proteobacteria.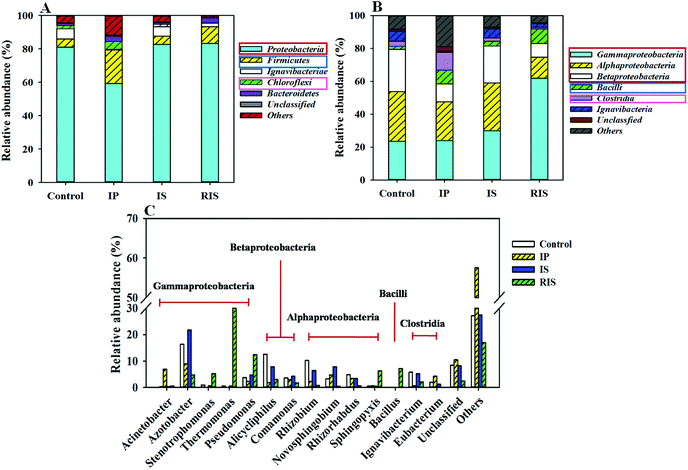 | ||
| Fig. 7 Taxonomic classification of pyrosequences from bacterial communities of four samples at the phylum (A), class (B) and genus (C) levels. | ||
On the class level, most of the sequences belonged to 6 classes (Fig. 7B). Among these, α-proteobacteria, β-proteobacteria and γ-proteobacteria were the shared dominant classes. β-proteobacteria and γ-proteobacteria both displayed obvious shifts in abundance with the addition of ZVI, especially γ-proteobacteria. Among all the classes, γ-proteobacteria was found to be dominant in the RIS group (61.9%) but represented only 23.6% of the control (Fig. 7B). γ-proteobacteria are Gram-negative bacteria that are known to be aerobic and facultative anaerobes; they are capable of degrading organic compounds, such as quinoline.44,45 However, α-proteobacteria decreased in the ZVI-AD systems, which may improve the utilization of carbohydrates and the production of Hbu.46 Bacilli and Clostridia are versatile groups of strict anaerobes that are among the most prevalent bacterial groups in biogas reactors;47 they were enhanced by ZVI addition. The total proportions of the dominant class reached 78.3% for the four samples.
To obtain more detailed information, further investigation at the genus level provided more detailed information about the microbial communities (Fig. 7C and Table S2†). Stenotrophomonas, Thermomonas and Pseudomonas belong to the phylum γ-proteobacteria, and they occupied the largest portion of the RIS-treated group. Several Stenotrophomonas (5.2%) species have shown the ability to degrade organic pollutants, and these strains can also decompose toxic pollutants by removing functional groups or by opening their ring structures.48 Thermomonas (36.2%) species can produce acetate and propionate from carbohydrate fermentation in batch tests; they usually grow in the temperature range between 18 °C and 50 °C.49 Pseudomonas is known to utilize a large variety of organics as sources of C and N; therefore, they are important environmental microorganisms. Generally, quinoline-degrading microorganisms are members of the genus Pseudomonas and are primarily detected in the RIS group. In addition, many other genera have been reported to be able to degrade quinoline, such as Bacillus.50 For Bacillus (belonging to the phylum Bacilli), some studies have found that they can also degrade multiple heterocyclic compounds, such as hydrocarbons in petroleum, benzo[a]pyrene and pyridine; this suggests that Bacillus species have high potential value when applied to the biodegradation of organic contaminants and remediation of water. The proportions of Bacillus in the four groups were 0.09%, 0.14%, 0.04% and 7.13%, respectively. Overall, based on the taxa closely associated with the found OTUs, the community in the RIS group was dominated by microorganisms that can anaerobically degrade complex WAS organics to acids or to biogas. This may be the reason for the fastest quinoline degradation rate after the addition of RIS.
3.7 Implications of this work
The phenomenon where conditioning with different types of ZVI affects WAS digestion, as explored in this work, sheds light on a new approach to promote quinoline removal and methane production by AD processes. This study reveals details of how adding different types of ZVI affects the quinoline degradation and methane production efficiency in WAS digestion systems by means of process assessment associated with microbial community response analysis. More importantly, the findings obtained in this study may have crucial implications for the treatment of wastewaters. For example, waste RIS (the most efficient ZVI type in this work) can be readily obtained from machinery factories and then added to the anaerobic digesters in WWTPs. The addition of RIS can enhance methane production by improving the microbial environment.4. Conclusions
This study revealed that quinoline reduction, COD removal, VFAs and methane formation in AD systems are significantly improved after ZVI addition. The iron dosage as well as the iron type and initial pH affect the performance of the anaerobic coupled system, with optimal conditions of 3 g L−1 dosage, rusty iron scrap type and pH 7.5. The high iron ion accumulation and excellent pH self-buffering capability may result in high performance of the coupled system. In addition, the ZVI-AD system showed high efficiency in terms of quinoline reduction, with higher zeroth-order kinetic constants. Additionally, the functional species increased in the ZVI-AD system and significantly shifted in the different types of ZVI groups. Systems in which ZVI is coupled with AD can be potentially implemented in conventional anaerobic recalcitrant contaminant removal processes, such as the treatment of wastewater containing multi-substituted NACs.Conflicts of interest
There are no conflicts to declare.Acknowledgements
This research was supported by the National Natural Science Foundation of China (NSFC, No. 21707099, 51608345, 51708386), by the Scientific and Technological Project of Shanxi Province (No. 201601D021130 and 201701D221230) and the Key Research and Development (R&D) Project of Shanxi Province (No. 201603D321012), by the China Postdoctoral Science Foundation (No. 2015M570241, 2016M591416 and 2017T100170), and by the Key technology research and integrated demonstration project of agricultural surface pollution control in main agricultural ecological areas of Shanxi Province (201603D2110).References
- S. Zhu, D. Liu, L. Fan and J. Ni, J. Hazard. Mater., 2008, 160, 289–294 CrossRef CAS PubMed.
- S. Fetzner, B. Tshisuaka, F. Lingens, R. Kappl and J. Hüttermann, Angew. Chem., Int. Ed., 1998, 37, 576–597 CrossRef CAS.
- W. C. Brumly, C. M. Brownrigg and G. M. Brilis, J. Chromatogr., 1991, 558, 223–233 CrossRef.
- N. Minako, Y. Takio, S. Yuko and S. Takashi, Mutat. Res., 1977, 42, 335–342 CrossRef.
- E. J. LaVoie, A. Shigematsu, E. A. Adams, J. Rigotty and D. Hoffmann, Cancer Lett., 1984, 22, 269–273 CrossRef CAS PubMed.
- K. V. Padoley, S. N. Mudliar and R. A. Pandey, Bioresour. Technol., 2008, 99, 4029–4043 CrossRef CAS PubMed.
- D. Rameshraja, V. C. Srivastava, J. P. Kushawha and I. D. Mall, Chem. Eng. J., 2012, 182, 343–351 CrossRef.
- X. Huang and X. Wang, Chemosphere, 2007, 69, 747–754 CrossRef CAS PubMed.
- J. L. Wang, X. C. Quan, L. P. Han, Y. Qian and W. Hegemann, Water Res., 2002, 36, 2288–2296 CrossRef CAS.
- D. Wang, W. Ma, H. Han, K. Li and X. Hao, Biochem. Eng. J., 2017, 117, 66–76 CrossRef CAS.
- S. Fetzner, Appl. Microbiol. Biotechnol., 1998, 49, 237–250 CrossRef CAS.
- J. P. Kaiser, Y. Feng and J. M. Bollag, Microbiol. Rev., 1996, 60, 483–498 CAS.
- N. K. Sharma and L. Philip, Chem. Eng. J., 2014, 256, 255–267 CrossRef CAS.
- N. K. Sharma and L. Philip, Appl. Biochem. Biotechnol., 2015, 175, 300–322 CrossRef CAS PubMed.
- S. S. Johansen, D. Licht, E. Arvin, H. Mosbæk and A. B. Hansen, Appl. Microbiol. Biotechnol., 1997, 47, 292–300 CrossRef CAS.
- Y. Li, L. Wang, L. Liao, L. Sun, G. Zheng, J. Luan and G. Gu, J. Hazard. Mater., 2010, 173, 151–158 CrossRef CAS PubMed.
- A. G. Vlyssides and P. K. Karlis, Bioresour. Technol., 2004, 91, 201–206 CrossRef CAS PubMed.
- L. Chu, S. Yan, X. H. Xing, X. Sun and B. Jurcik, Water Res., 2009, 43, 1811–1822 CrossRef CAS PubMed.
- S. Ibeid, M. Elektorowicz and J. A. Oleszkiewicz, Water Res., 2013, 47, 903–910 CrossRef CAS PubMed.
- Q. Wang, G. Jiang, L. Ye and Z. Yuan, Water Res., 2014, 63, 71–80 CrossRef CAS PubMed.
- H. Carrère, C. Dumas, A. Battimelli, D. J. Batstone, J. P. Delgenès, J. P. Steyer and I. Ferrer, J. Hazard. Mater., 2010, 183, 1–15 CrossRef PubMed.
- L. Ma and W. X. Zhang, Environ. Sci. Technol., 2008, 42, 5384–5389 CrossRef CAS PubMed.
- D. H. Phillips, T. V. Nooten, L. Bastiaens, M. I. Russell, K. Dickson, S. Plant, J. M. E. Ahad, T. Newton, T. Elliot and R. M. Kalin, Environ. Sci. Technol., 2010, 44, 3861–3869 CrossRef CAS PubMed.
- L. Huang, G. Liu, G. Dong, X. Wu, C. Wang and Y. Liu, Chem. Eng. J., 2017, 316, 525–533 CrossRef CAS.
- C. Ou, S. Zhang, J. Liu, J. Shen, W. Han, X. Sun, J. Lia and L. Wang, RSC Adv., 2015, 5, 75195–75203 RSC.
- G. You, P. Wang, J. Hou, C. Wang, Y. Xu, L. Miao, B. Lv, Y. Yang and F. Zhang, Crit. Rev. Environ. Sci. Technol., 2017, 47, 877–907 CrossRef CAS.
- X. Guo, Z. Yang, H. Liu, X. Lv, Q. Tu, Q. Ren, X. Xia and C. Jing, Sep. Purif. Technol., 2015, 146, 227–234 CrossRef CAS.
- D. Wu, Y. Shen, A. Ding, Q. Mahmood, S. Liu and Q. Tu, J. Hazard. Mater., 2013, 262, 649–655 CrossRef CAS PubMed.
- L. Zhu, J. Jin, H. Lin, K. Gao and X. Xu, J. Hazard. Mater., 2015, 285, 157–166 CrossRef CAS PubMed.
- Y. B. Zhang, Y. W. Liu, Y. W. Jing, Z. Q. Zhao and X. Quan, J. Environ. Sci., 2012, 24, 720–727 CrossRef CAS.
- Z. Liu, A. Zhou, J. Zhang, S. Wang, Y. Luan, W. Liu, A. Wang and X. Yue, ACS Sustainable Chem. Eng., 2018, 6, 3870–3878 CrossRef CAS.
- C. Lozupone and R. Knight, Appl. Environ. Microbiol., 2005, 71, 8228–8235 CrossRef CAS PubMed.
- APHA, Standard Methods for the Examination of Water and Wastewater, American Public Health Association, Washington D.C., 1995 Search PubMed.
- G. You, P. Wang, J. Hou, C. Wang, Y. Xu, L. Miao, B. Lv, Y. Yang and F. Zhang, Crit. Rev. Environ. Sci. Technol., 2017, 47, 877–907 CrossRef CAS.
- S. Karri, R. Sierra-Alvarez and J. A. Field, Biotechnol. Bioeng., 2005, 92, 810–819 CrossRef CAS PubMed.
- T. Cheng, Y. Z. Dai, C. Chen and Z. Q. Huang, Asian J. Chem., 2012, 24, 2579 CAS.
- Y. Liu, Y. Zhang, X. Quan, J. Zhang, H. Zhao and S. Chen, Bioresour. Technol., 2011, 102, 2578–2584 CrossRef CAS PubMed.
- Q. Wang, M. Kuninobu, H. I. Ogawa and Y. Kato, Biomass Bioenergy, 1999, 16, 407–416 CrossRef CAS.
- Y. Liu, Q. Wang, Y. Zhang and B. J. Ni, Sci. Rep., 2015, 5, 8263 CrossRef CAS PubMed.
- Y. Wang, H. Tian, F. Huang, W. Long, Q. Zhang, J. Wang, Y. Zhu, X. Wu, G. Chen, L. Zhao, L. R. Bakken, Å. Frostegård and X. Zhang, Sci. Rep., 2017, 7, 14778 CrossRef PubMed.
- A. Zhou, W. Liu, C. Varrone, Y. Wang, A. Wang and X. Yue, Bioresour. Technol., 2015, 192, 835–840 CrossRef CAS PubMed.
- R. Sun, A. Zhou, J. Jia, Q. Liang, Q. Liu, D. Xing and N. Ren, Bioresour. Technol., 2014, 175C, 68–74 Search PubMed.
- K. Wen, A. Zhou, J. Zhang, Z. Liu, G. Wang, W. Liu, A. Wang and X. Yue, Sci. Rep., 2017, 7, 42887 CrossRef CAS PubMed.
- R. Maeda, H. Nagashima, A. B. Zulkharnain, K. Iwata and T. Omori, Curr. Microbiol., 2009, 59, 154–159 CrossRef CAS PubMed.
- M. V. Reddy, M. P. Devi, K. Chandrasekhar, R. K. Goud and S. V. Mohan, J. Hazard. Mater., 2011, 197, 80–87 CrossRef CAS PubMed.
- M. L. Babu, G. V. Subhash, P. Sarma and S. V. Mohan, Bioresour. Technol., 2013, 133, 322–331 CrossRef PubMed.
- L. Krause, N. N. Diaza, R. A. Edwardse, K. H. Gartemann, H. Krömekea, H. Neuwegera, A. Pühlerd, K. J. Runte, A. Schlüterd, J. Stoye, R. Szczepanowski, A. Taucha and A. Goesmann, J. Biotechnol., 2008, 136, 91–101 CrossRef CAS PubMed.
- Y. Leng, J. Bao, G. Chang, H. Zheng, X. Lia, J. Dua, D. Snow and X. Li, J. Hazard. Mater., 2016, 318, 125–133 CrossRef CAS.
- H. J. Busse, P. Kampfer, E. R. B. Moore, J. Nuutinen, I. V. Tsitko, E. B. M. Denner, L. Vauterin, M. Valens, R. Rossello-Mora and S. Salkinoja-Salonen, Int. J. Syst. Evol. Microbiol., 2002, 52, 473–483 CrossRef CAS PubMed.
- B. Tuo, J. Yan, B. Fan, Z. Yang and J. Liu, Bioresour. Technol., 2012, 107, 55–60 CrossRef CAS PubMed.
Footnote |
| † Electronic supplementary information (ESI) available. See DOI: 10.1039/c8ra09529a |
| This journal is © The Royal Society of Chemistry 2019 |

