
 Open Access Article
 This Open Access Article is licensed under a Creative Commons Attribution-Non Commercial 3.0 Unported Licence
High-temperature stability of nanozirconate-toughed IMF material lanthanum synthesized by an in situ reaction
Xin Wang *a,
Min Xuea,
Songbai Liua,
Kuo Jianga and
Zhuli Zhangb
*a,
Min Xuea,
Songbai Liua,
Kuo Jianga and
Zhuli Zhangb
aDepartment of Defence Science and Technology, Southwest University of Science and Technology, Mianyang 621010, China. E-mail: xinwang@swust.edu.cn
bSuzhou InReal Optoelectronic Material Technology Co., Ltd., China
First published on 6th March 2019
Abstract
Herein, powders composed of La2Zr2O7 (LZ) and ZrO2 phases were synthesized by an in situ reaction using a sol-spray pyrolysis method; moreover, 24 mol% LaO1.5–ZrO2 (volume ratio = 1![[thin space (1/6-em)]](https://www.rsc.org/images/entities/char_2009.gif) :1) powders were characterized by XRD, Raman spectroscopy, SEM, and TEM. XRD and Raman results showed that the samples maintained a tetragonal ZrO2 and a pyrochlore LZ phase from 900 to 1100 °C. The addition of LZ could be helpful in the stabilization of t-ZrO2 and decreasing the grain size of ZrO2. The SEM results revealed that the LZ and ZrO2 phases were homogeneously distributed in the sintered bulk. The HRTEM results suggested that the crystal orientations of the nano-LZ and nano-ZrO2 phases were accordant; this was in agreement with the characteristics of the coherent boundaries. The fracture toughness of LZ–ZrO2 was markedly improved by the transformation toughening of the ZrO2 phase, and a value that was 2.2-fold that of the LZ prepared by a similar technique was achieved.
:1) powders were characterized by XRD, Raman spectroscopy, SEM, and TEM. XRD and Raman results showed that the samples maintained a tetragonal ZrO2 and a pyrochlore LZ phase from 900 to 1100 °C. The addition of LZ could be helpful in the stabilization of t-ZrO2 and decreasing the grain size of ZrO2. The SEM results revealed that the LZ and ZrO2 phases were homogeneously distributed in the sintered bulk. The HRTEM results suggested that the crystal orientations of the nano-LZ and nano-ZrO2 phases were accordant; this was in agreement with the characteristics of the coherent boundaries. The fracture toughness of LZ–ZrO2 was markedly improved by the transformation toughening of the ZrO2 phase, and a value that was 2.2-fold that of the LZ prepared by a similar technique was achieved.
1. Introduction
In inert matrix (IM) materials, plutonium is inlaid in a U-free matrix; hence, plutonium can be burnt without breeding any new plutonium by neutron capture in 238U. The basic criteria for IM materials are as follows: (i) stable irradiation behavior; (ii) good heat transport properties and phase stability at high working temperatures; and (iii) suitable mechanical properties such as elastic constants, fracture toughness and so on.1–4 La2Zr2O7 (LZ) with a pyrochlore (P) structure is one of the most evaluated potential IM materials because of its good stable irradiation behavior and phase stability at high working temperatures.5,6However, the low thermal conductivity and fracture toughness of LZ has limited its applications in a fuel cycle that relies on a reprocessing strategy. The use of higher-thermal-conductivity materials (such as MgO and CeO2) as a dual phase is a general method to improve the thermal conductivity of the IM materials.7,8 However, only a few studies have been reported on the toughening of LZ. The incorporation of zirconia (ZrO2) with high toughness into alumina ceramics to deliberately toughen them has been widely carried out to achieve zirconia-toughened alumina (ZTA) systems.9,10 Herein, ZrO2 has been incorporated into LZ to toughen it. Moreover, ZrO2 has a relatively high thermal conductivity with additional excellent radioactive resistance and good mechanical properties.11,12 The tetragonal (t)–monoclinic (m) transition of zirconia is believed to easily occur at temperatures less than 1150 °C.13 This phase transition accompanying a change in the exterior environment induces a volume dilation of ∼4 vol%. The stresses resulting from the volumetric changes can induce crack openings and thus limit the application of zirconia.14
Nanosized materials have relatively low activation energy for grain-boundary migration because of the increased surface (interface)/volume ratio as compared to their bulk counterparts.15,16 For nanozirconia, when the crystallite size is ∼30 nm or less, this phase transition occurs slowly. Moreover, nanocrystalline materials have a superior radiation resistance.17
The use of second-phase particles causes a grain-boundary motion by drag and can retard the grain growth of the matrix particles. It was reported that less than 1 mol% LaO1.5 could be dissolved in ZrO2.18,19 Based on the phase diagram of the LaO1.5–ZrO2 system and the previous study, a pyrochlore-structured LZ phase exists in a wide concentration range of LaO1.5. The phase composition of the xLaO1.5 − (1 − x)ZrO2 (x ≤ 1) system at room temperature consists of LZ and ZrO2 with the following chemical formula:
| (1 − x)LaO1.5 + xZrO2 → (1 − x)/2La2Zr2O7 + (2x − 1)ZrO2 | (1) |
Soft solution chemistry, such as a sol–gel method, has been used to fabricate lanthanum zirconate and yttria-stabilized zirconia.20 It provides a possible route for the production of nanocrystalline LZ and nanocrystalline ZrO2 compounds in the nanometer scale. As a result, the grain size of ZrO2 or LZ in the composite will be smaller than that of the single-phase counterparts. It is suggested that the stabilization of t-ZrO2 in the LaO1.5–ZrO2 system may result from the impact of the LZ phase.
The objectives are to (i) prepare nano–nano LZ–ZrO2 composite powders by an in situ reaction using a sol-spray pyrolysis method, (ii) measure the toughness of LZ–ZrO2, and (iii) study the high-temperature stability of LZ–ZrO2; this provides a method to toughen not only LZ, but also all other pyrochlore IM materials (such as Pu2Zr2O7 (ref. 21) and Nd2Zr2O7 (ref. 8)); this will benefit the emerging area of IM research related to alternate ceramics.
2. Experimental procedures
2.1. Sample preparation
For the preparation of the LZ–ZrO2 nanocomposite powders, 99.99% purity Zr(NO3)4·3H2O and La(NO3)3·6H2O (Aladdin Chemistry Co., Ltd., Shanghai, China) were used as the starting materials and dissolved in deionized water; the concentration of Zr4+ and La3+ was 0.1 M. In the starting solution, citric acid (C6H8O7·H2O, 80 g L−1) and polyethylene glycol (PEG, molecular weight = 20000, 50 g L−1) were used as the chelating agent and the plastering agent, respectively. The solution was stirred using a magnetic stirrer for 30 min to achieve complete dissolution. The resultant solution was then poured into a polytetrafluoroethylene (PTFE) tube and atomized by a stainless steel nozzle. Then, the precursors obtained from the sol-spray pyrolysis were annealed at 900–1200 °C for 6 h in high-purity Al2O3 crucibles and cooled down to room temperature (heating and cooling rates = 2 °C min−1). To obtain dense samples, the powders were heated under an applied pressure of 40 MPa to 1450 °C at the constant heating rate of 100 min−1 for 10 min and rapidly cooled down to room temperature. All the bulk samples prepared in this study had a diameter of 15 mm and a height of approximately 5 mm. The bulk samples were polished using a 0.025 μm diamond paste and thermally etched at 1200 °C for 10 h in air. The density of the samples was determined by the Archimedes method.
2.2. Characterization of the sample composition and microstructure
X-ray diffraction (XRD) analysis of the samples was carried out using the X'Pert PRO diffractometer with Cu Kα radiation (λ = 0.15406 nm; PANalytical, Almelo, the Netherlands). The XRD patterns were obtained in the 2θ range of 10–90° at room temperature at the scanning rate of 0.05° s−1 and a step size of 0.033°. The crystallite size was calculated using the Scherrer's formula for the 440, 220 and 111 peaks of La2Zr2O7, t-ZrO2, and m-ZrO2, respectively:
 | (2) |
Raman spectra were obtained using the Renishaw InVia Raman spectrometer (Renishaw plc, New Mills, UK). The emission line at 514.5 nm obtained from an Ar+ ion laser was used as the excitation source. The samples of the bulk were observed using a field emission scanning electron microscope (FESEM, Apollo 300 FE, Obducat CamScan Ltd., Cambridge, UK) operated at 30 kV. The TEM observation of the samples was conducted using a transmission electron microscope (TEM, JEM-2010, JEOL, Tokyo, Japan).
2.3. Characterization of the sample fracture toughness
A Vickers hardness tester (HV-1000A, Huayin Test Instrument Co., Ltd., Yantai, China) was used to measure the indentation fracture toughness. The indentations were made on polished surfaces with a load (F) of 9.8 N held for 10 s. The fracture toughness (KIC, MPa m1/2) for each sample was estimated from a minimum of 9 indents to reduce the experimental uncertainty using the following equation:22,23
 | (3) |
3. Results and discussion
3.1. Characterization of the LZ–ZrO2 powders
X-ray diffraction was employed to investigate the crystalline phases of lanthanum zirconate and zirconia. The XRD patterns of xLaO1.5 − (1 − x)ZrO2 (x = 0–0.5) powders obtained after annealing the powders at 1200 °C for 6 h are shown in Fig. 1. In the pattern of pure ZrO2, no clear evidence is found for the presence of the t and c peaks. The shifts of the (−111) and (111) peaks in the pattern of 1 mol% LaO1.5–ZrO2 are an indication that LaO1.5 has been completely doped into the ZrO2 crystal by substituting La3+ for Zr4+. The presence of the pyrochlore structure is confirmed by the occurrence of the superlattice 311, 331, and 511 peaks.24 The results indicate that the solubility of LaO1.5 in ZrO2 is lower than 1 mol%; this in line with that reported in literature.18,19 The broadening of the m (111) peaks indicated that the grain size of m-ZrO2 decreased with an increase in the content of LZ. Considering the grain size effect of ZrO2, the presence of the (101) peak for t-ZrO2 could be attributed to the grain refinement. | ||
| Fig. 1 XRD patterns of the xLaO1.5 − (1 − x)ZrO2 (x = 0–50 mol%) powders after annealing at 1200 °C for 6 h in air. | ||
Table 1 summarizes the calculated grain sizes of m-ZrO2 in xLaO1.5 − (1 − x)ZrO2 (x = 0–0.4) powders after annealing at 1200 °C for 6 h. The data showed that the grain size of the m phase gradually decreased with the increasing concentration of LaO1.5, reaching a value that was approximately equal to the critical grain size of t- to m-ZrO2 at the addition concentration of 10 and 24 mol%. The (101) peak for t-ZrO2 significantly increased at the concentration of 24 mol%. The lattice parameters of LZ and ZrO2 were determined based on the XRD patterns shown in Fig. 1. The volume ratios of LZ and m-ZrO2 in the samples could be easily calculated using the weight and the number of formula units per elementary cell, which were approximately 1/4, 1/1 and 4/1 for 10, 24 and 40 mol% LaO1.5–ZrO2 samples, respectively. The 24 mol% LaO1.5–ZrO2 powders were chosen for further characterization.
| LaO1.5 concentration (mol%) | Phase composition | Crystallite size of m-ZrO2 (nm) |
|---|---|---|
| a P – pyrochlore-type La2Zr2O7; m – m-ZrO2; t – t-ZrO2; *small amount. | ||
| 0 | m | 38.8 |
| 1 | m | 40.1 |
| 3 | m + P | 32.6 |
| 5 | m + P+ t* | 31.0 |
| 8 | m + P + t* | 28.1 |
| 10 | m + P + t* | 22.5 |
| 24 | P + m + t | 23.4 |
| 40 | P + t + m* | — |
3.2. Fracture toughness
Fig. 2(a) shows the fracture surface of the 24 mol% LaO1.5–ZrO2 spark plasma sintered (SPS) bulk sample after thermal etching at 1100 °C for 2 h. The SEM image reveals that the particle size of the SPS bulk sample is in the range of 50–200 nm. The SEM image reveals that the sintered sample has a dense microstructure, which is very important for the mechanics performance testing. The densities of the sintered LZ and 24 mol% LaO1.5–ZrO2 specimens were determined by the Archimedes method to be 97.6% and 95.8% of the theoretical values, respectively.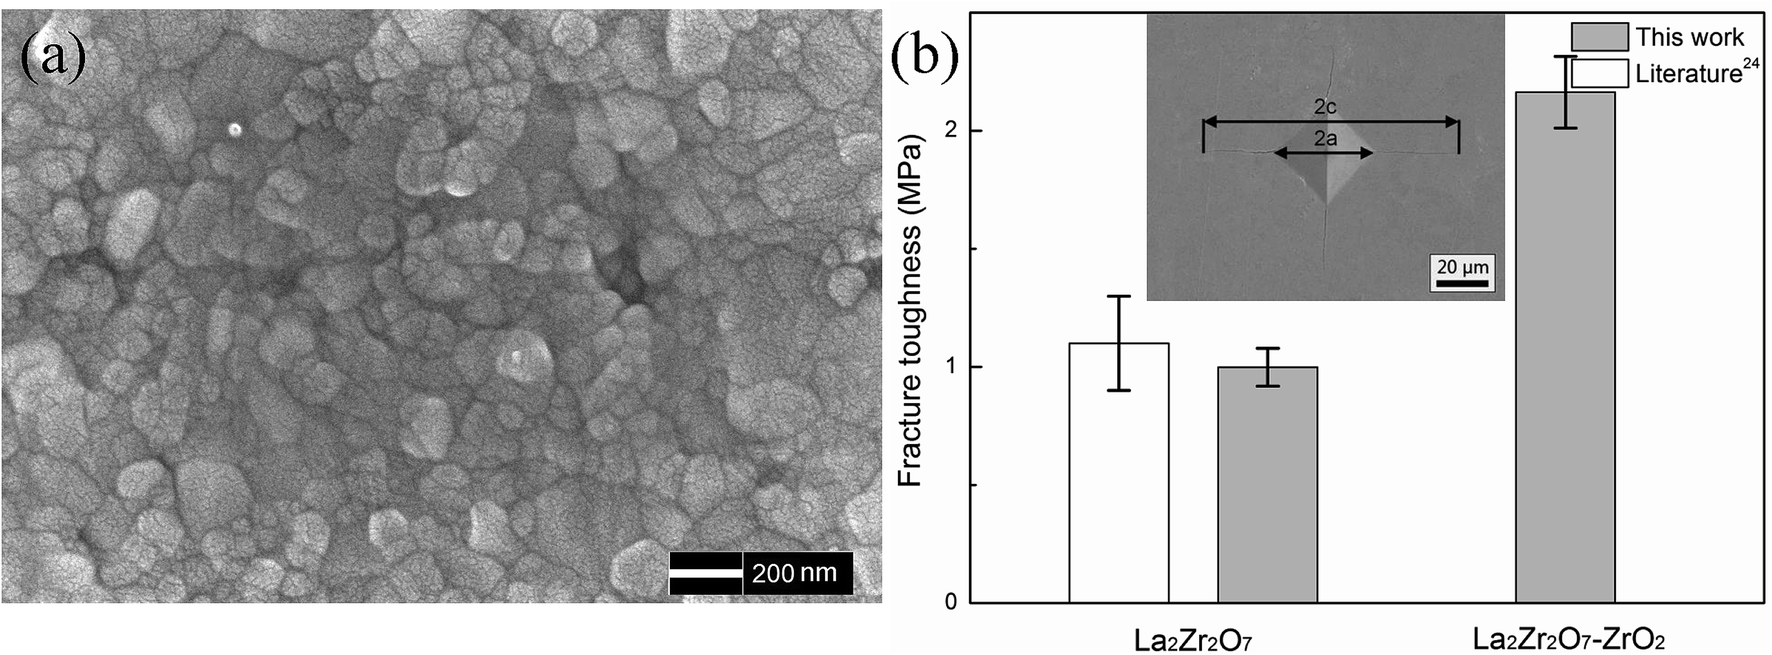 | ||
| Fig. 2 (a) The SEM image of the 24 mol% LaO1.5–ZrO2 bulk sample. (b) Fracture toughness of the 24 mol% LaO1.5–ZrO2 and La2Zr2O7 bulk samples. The data for La2Zr2O7 is obtained from the study reported by Vassen et al.25 Inset shows a Vickers indentation with cracks (polished, SEM, SE) by a 1 kg load of 24 mol% LaO1.5–ZrO2 ceramics. | ||
Fig. 2(b) shows the fracture toughness of the 24 mol% LaO1.5–ZrO2 sample, and the data have been compared with that of the LZ materials. The experimental results for the LZ samples are in good agreement with those reported in the literature.25 The data showed that the toughness level of the 24 mol% LaO1.5–ZrO2 was 120% greater than that of LZ (∼1.0 MP m1/2). The high fracture toughness of 24 mol% LaO1.5–ZrO2 (as compared to that of LZ) can be attributed to the transformation toughening from the martensitic transformation of the t to the m phases.
3.3. High-temperature stability and grain growth
Fig. 3 shows the XRD patterns of ZrO2 and 24 mol% LaO1.5–ZrO2 powders after annealing at 500–1100 °C. Pure ZrO2 presents clear t peaks at 500 °C. With an increase in the annealing temperature from 600 to 800 °C, pure ZrO2 undergoes a t to m phase transformation. The grain size of the t phase was below 30 nm (see Table 2), in good agreement with the critical grain size for the t- to m-ZrO2 transformation.26 Compared with the case of pure ZrO2, no clear evidence was found for the shift of the t (101) peaks in any of the patterns of 24 mol% LaO1.5–ZrO2; this indicated that the solubility of La3+ in the ZrO2 phase was negligible. Table 2 lists the grain sizes of ZrO2 and 24 mol% LaO1.5–ZrO2 powders calculated from the Scherrer's formula on the basis of Fig. 3. For pure ZrO2, the crystallite size of t-ZrO2 increased from 9.1 to 26.4 nm as the temperature was increased from 500 to 800 °C, and t-ZrO2 disappeared above 900 °C. The crystallite sizes of LZ and ZrO2 in the 24 mol% LaO1.5–ZrO2 system gradually increased from 19.5 to 38.1 nm and from 8.7 to 38.5 nm as the annealing temperature was elevated from 900 to 1100 °C. When the addition concentration of LaO1.5 reached 24 mol%, the critical grain size for the t to m phase transformation increased from ∼20 to ∼40 nm when the corresponding heat treatment temperature was increased from 600 to 1100 °C. The data showed that the addition of LZ could be helpful in decreasing the grain size of ZrO2.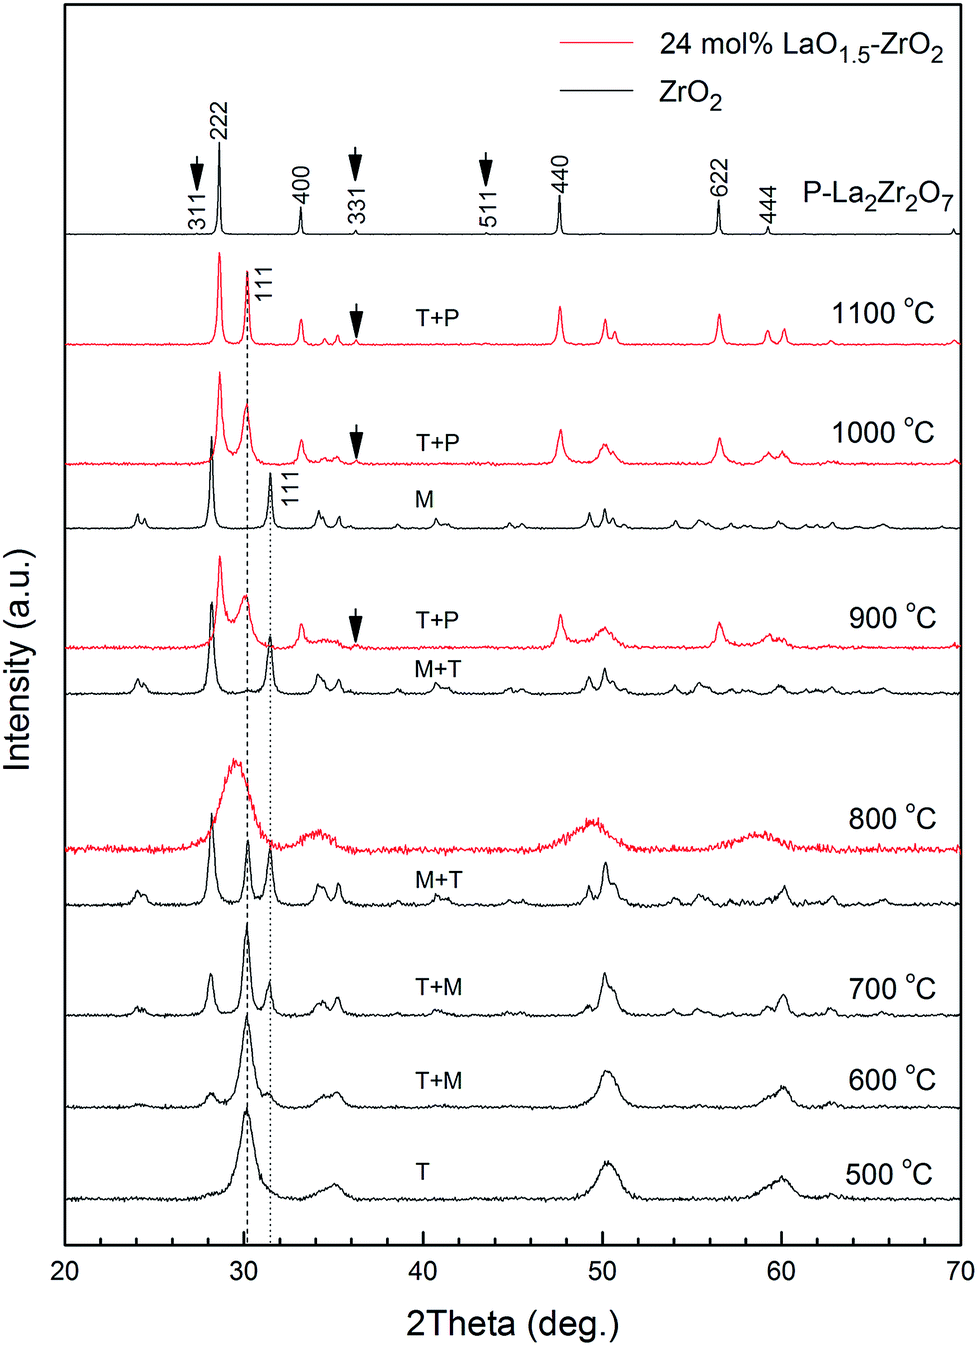 | ||
| Fig. 3 XRD patterns of ZrO2 and 24 mol% LaO1.5–ZrO2 powders after annealing at 500–1100 °C for 6 h. | ||
| Sample (°C) | Crystallite size (nm) | |||
|---|---|---|---|---|
| ZrO2 | 24 mol% LaO1.5–ZrO2 | |||
| t | m | t | P | |
| 500 | 9.1 | — | — | — |
| 600 | 11.2 | — | — | — |
| 700 | 21.3 | 24.9 | — | — |
| 800 | 26.4 | 24.8 | — | — |
| 900 | — | 29.9 | 8.7 | 19.5 |
| 1000 | — | 42.9 | 16.9 | 24.1 |
| 1100 | — | — | 38.5 | 38.1 |
Raman spectroscopy is another useful technique that is generally used to investigate the structures of lanthanum zirconate and zirconia. Fig. 4 shows the Raman spectra of the 24 mol% LaO1.5–ZrO2 powders annealed at 800, 900, and 1100 °C and the P–LZ samples.27 The bands at 298, 389, 494, 511, and 744 cm−1 were assigned to the A1g + Eg + 4F2g Raman active vibration modes (gray arrows) of the P–LZ sample. The bands corresponding to the A1g + 3Eg modes (black arrows) of t-ZrO2 were clearly observed at 273, 463, 600 and 646 cm−1 in the spectra of the 24 mol% LaO1.5–ZrO2 powders,28 in good agreement with the XRD results.
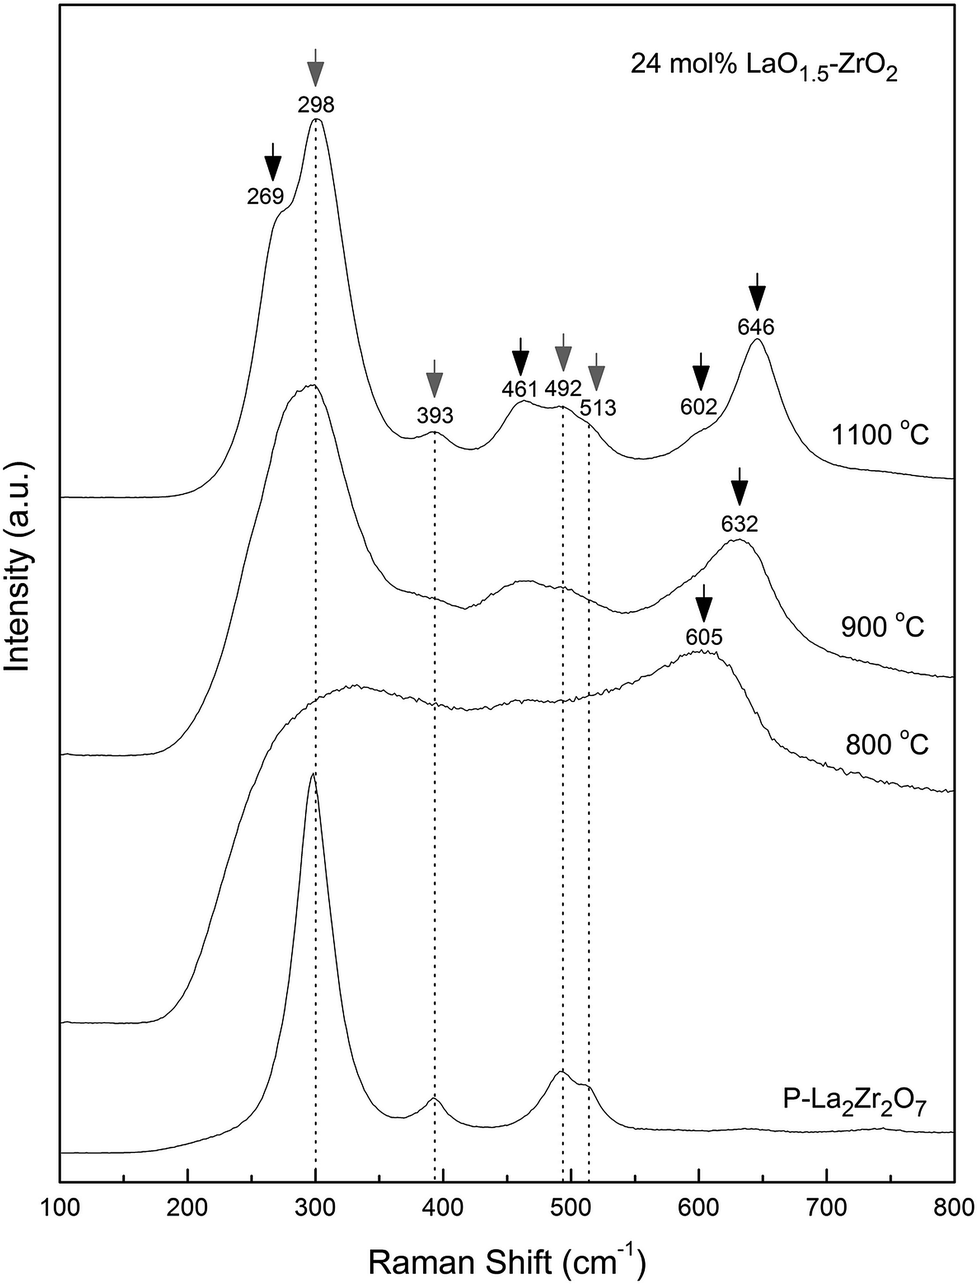 | ||
| Fig. 4 Raman spectra of 24 mol% LaO1.5–ZrO2 powders after annealing at 800, 900, and 1100 °C for 6 h, and La2Zr2O7. | ||
Fig. 5(a) and 4(b) show the SEM images of the 24 mol% LaO1.5–ZrO2 bulk samples after sintering at 1300 °C for 48 h at different magnifications. Fig. 5(a) reveals that the samples have a homogeneous microstructure. The particle size distribution of the samples is shown in Fig. 5(c), and the observed grain size of the samples is in the range of 0.1–1.4 μm. Fig. 5(b) reveals that the crystal grains of the sample are near spheroidal in shape. The SEM image also shows that the grains of the sample are closely bonded with each other, and the interfaces between grains are legible. In a previous study on the nano–nano composites of lanthanum zirconate and yttria-stabilized zirconia,20 the activation energy for the grain growth of LZ (225 ± 12 kJ mol−1) was much lower than that of 10YSZ (yttria-stabilized zirconia, 382 ± 17 kJ mol−1); this suggested that the first step was the formation of LZ and nuclei, and then, ZrO2 nucleated on the surface of the LZ crystalline grains during the annealing process. Therefore, the small crystals were the ZrO2 nuclei, which were evenly distributed on the surface of the LZ nuclei via encircling and insertion.
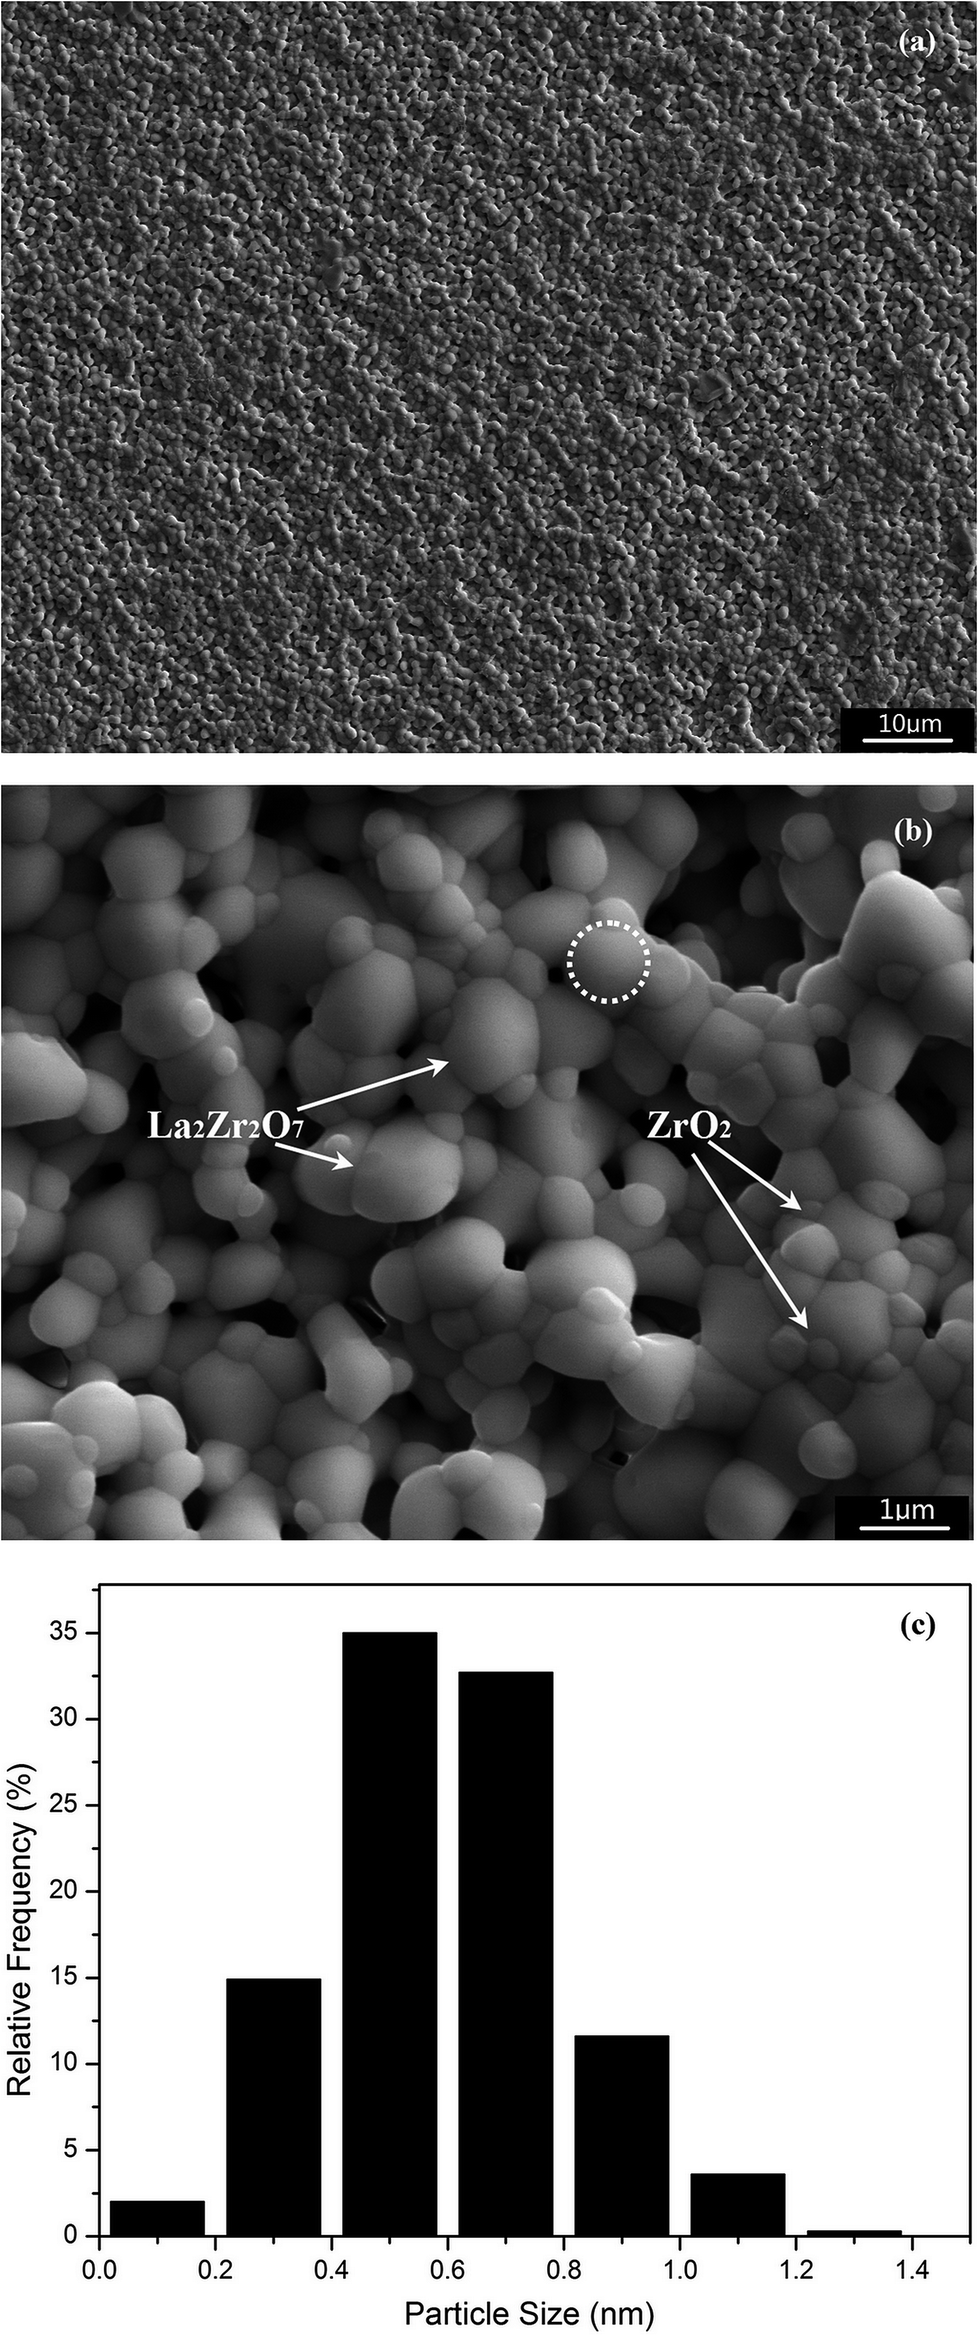 | ||
| Fig. 5 (a) and (b) SEM images of 24 mol% LaO1.5–ZrO2 bulk samples after sintering at 1300 °C for 48 h, and (c) particle size distribution of the 24 mol% LaO1.5–ZrO2 bulk sample obtained from the SEM images. | ||
To rationalize these results, the phase transformation mechanism of ZrO2 was considered. Pure zirconia has three polymorphs under ordinary pressure, and the monoclinic type is the most frequent structure at room temperature and up to 1170 °C. In our case, pure ZrO2 and ZrO2 coexisting in the composite powders possess the t phase at 500 °C and 800–1100 °C, as confirmed by the XRD measurements. The appearance of the high-temperature phase at low temperatures has been discussed, and Parija et al.29 have proposed that the main reason for the stabilization is the crystallite size effect. According to their opinion, the following equation for the radius of the critical crystallite size rc for the t–m transformation has been proposed:
| rc = −3Δσ/[q(1 − T/Tb) + Δε] | (4) |
The grain size of pure ZrO2 presented in Table 1 corresponds well with the calculated rc. Similar to that of 24 mol% LaO1.5–ZrO2, the t-ZrO2 phase is stable even at the grain size of 38.5 nm. As indicated in eqn (3), the value of rc depends on Δσ, q, Tb, T, and Δε. In Fig. 2, no peak shift of the t and m phases was observed for all the samples; this indicated that La was not doped into the ZrO2 crystal. This suggests that the values of Δσ and q are consistent with those of pure ZrO2. Tb and T are constant; thus, the change in the strain energy may be the main factor for the increased rc.
In the Raman spectra (Fig. 4), a significant shift (∼14 cm−1) towards lower frequencies for t-ZrO2 was observed in the range of 600–650 cm−1 with a decrease in the annealing temperature from 1100 to 900 °C. Djurado et al.26 reported that the grain size effect on the Raman spectra was much smaller than the pressure-induced effect, and the maximum shift value was less than 10 cm−1. This suggests that stress exists in the LaO1.5–ZrO2 composite samples. Furthermore, the SEM images (Fig. 5(b)) show that small ZrO2 particles are embedded into the large LZ particles. In other words, the ZrO2 particles grew at the grain boundary.
To confirm the grain-boundary growth, high-resolution TEM characterization was performed. Fig. 6 shows a TEM image of the 24 mol% LaO1.5–ZrO2 powders after annealing at 1000 °C for 6 h. The lattice fringes with 0.620 and 0.315 nm spacings can be assigned to the 111 lattice plane of pyrochlore–LZ (P–LZ) and the 111 lattice plane of t-ZrO2 phase, respectively. The TEM image shows that the ZrO2 crystal grows along the surface of the LZ crystal, and the crystal orientation of the two phases is accordant, in line with the characteristics of coherent boundaries. The coherent boundaries with low excess energies are believed to retard the grain growth of the matrix particles because the grain growth of nanosized materials is controlled by the grain-boundary migration. Hence, the stabilization mechanism of the t-ZrO2 phase of the LZ–ZrO2 composite powders should be attributed to the grain refinement and lattice stress effects.
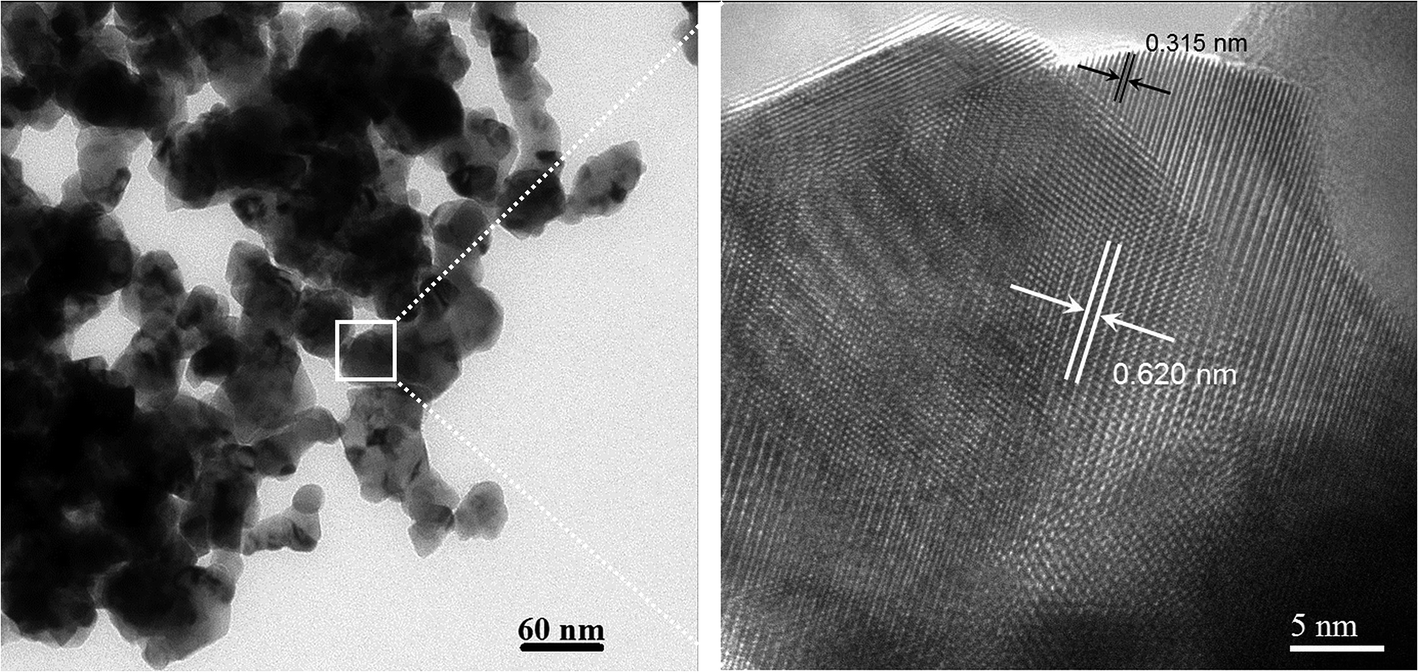 | ||
| Fig. 6 TEM images of 24 mol% LaO1.5–ZrO2 powders after annealing at 1000 °C for 6 h. | ||
Based on the abovementioned analysis, the lowest entropy will be selected during the in situ reaction. A possible mechanism for the formation of the LaO1.5–ZrO2 nano–nano composite powders has been suggested as follows: the first step is the formation of LZ and nuclei, and then, ZrO2 nucleates on the surface of LZ crystalline grains during the annealing process.
4. Conclusions
In summary, the addition of LaO1.5 to ZrO2 forms a pyrochlore structural La2Zr2O7 phase and induces a tetragonal to monoclinic (t to m) phase transition of ZrO2. The addition of LZ could be helpful in stabilizing t-ZrO2 and decreasing the grain size of ZrO2. The t-ZrO2 phase in the 24 mol% LaO1.5–ZrO2 powders was phase-stable up to a calcination temperature of 1100 °C. Since the solubility of LaO1.5 in ZrO2 is lower than 1 mol%, the presence of the t-ZrO2 phase in the LaO1.5–ZrO2 system does not arise from doping stabilization by the substitution of La3+ for Zr4+, but rather from the grain refinement of the LZ phase. The crystal orientation of the nano-LZ and nano-ZrO2 phases was accordant, in line with the characteristics of the coherent boundaries. The fracture toughness of La2Zr2O7–ZrO2 has been markedly improved by the transformation toughening of the ZrO2 phase, reaching a value that is 2.2-fold that of La2Zr2O7 prepared by a similar technique.Conflicts of interest
There are no conflicts to declare.Acknowledgements
We thank Dr Ruishi Xie, Dr Zhaohui Zhou, and Dr Huiping Duan for assistance with XRD, SEM, and TEM. This work was supported by the project of NSFC-11505146 and Defense Industrial Technology Development Program JCKY2016404C001 and Longshan Academic Talent Research Supporting Program of SWUST 18LZX556.References
- H. Matzke, V. V. Rondinella and T. Wiss, J. Nucl. Mater., 1999, 274, 47–53 CrossRef CAS.
- C. Degueldre and J. M. Paratte, J. Nucl. Mater., 1999, 274, 1–6 CrossRef CAS.
- S. Lutique, D. Staicu, R. J. M. Konings, V. V. Rondinella, J. Somers and T. Wiss, J. Nucl. Mater., 2003, 319, 59–64 CrossRef CAS.
- R. Restani, M. Martin, N. Kivel and D. Gavillet, J. Nucl. Mater., 2009, 385, 435–442 CrossRef CAS.
- I. Hayakawa and H. Kamizono, J. Nucl. Mater., 1993, 202, 163–168 CrossRef CAS.
- S. Yamazaki, T. Yamashita, T. Matsui and T. Nagasaki, J. Nucl. Mater., 2001, 294, 183–187 CrossRef CAS.
- A. Imaura, N. Touran and R. C. Ewing, J. Nucl. Mater., 2009, 389, 341–350 CrossRef CAS.
- A. T. Nelson, M. M. Giachino, J. C. Nino and K. J. McClellan, J. Nucl. Mater., 2014, 444, 385–392 CrossRef CAS.
- N. Claussen, J. Am. Ceram. Soc., 1976, 59, 49–51 CrossRef CAS.
- D. J. Green, J. Am. Ceram. Soc., 1982, 65, 610–614 CrossRef CAS.
- C. Degueldre, T. Arima and Y. W. Lee, J. Nucl. Mater., 2003, 319, 6–14 CrossRef CAS.
- C. Ghosh, S. Sinhamahapatra and H. S. Tripathi, Int. J. Appl. Ceram. Technol., 2018, 00, 1–8 Search PubMed.
- R. Chaim, D. G. Brandon and A. H. Heuer, Acta Metall., 1986, 34, 1933–1939 CrossRef CAS.
- D. R. Clarke and C. G. Levi, Annu. Rev. Mater. Res., 2003, 33, 383–417 CrossRef CAS.
- W. P. Tong, N. R. Tao, Z. B. Wang, J. Lu and K. Lu, Science, 2003, 299, 686–688 CrossRef CAS PubMed.
- K. Dick, T. Dhanasekaran, Z. Zhang and D. Meisel, J. Am. Chem. Soc., 2002, 124, 2312–2317 CrossRef CAS PubMed.
- S. Wurster and R. Pippan, Scr. Mater., 2009, 60, 1083–1087 CrossRef CAS.
- B. Bastide, P. Odier and J. P. Coutures, J. Am. Ceram. Soc., 1988, 71, 449–453 CrossRef CAS.
- M. A. Stough and J. R. Hellmann, J. Am. Ceram. Soc., 2002, 85, 2895–2902 CrossRef CAS.
- K. Jiang, S. Liu and C. Li, J. Am. Ceram. Soc., 2013, 96, 3296–3303 CAS.
- R. Chawla, P. Grimm, P. Heimgartner, F. Jatuff, G. Ledergerber, A. Luthi, M. Murphy, R. Seiler and R. van Geemert, Prog. Nucl. Energy, 2001, 38, 359–362 CrossRef CAS.
- A. G. Evans and E. A. Charles, J. Am. Ceram. Soc., 1976, 59, 371–372 CrossRef CAS.
- G. R. Anstis, P. Chantikul, B. R. Lawn and D. B. Marshall, J. Am. Ceram. Soc., 1981, 64, 533–538 CrossRef CAS.
- P. K. Schelling and S. R. Phillpot, J. Am. Ceram. Soc., 2001, 84, 2997–3007 CrossRef CAS.
- R. Vassen, X. Cao, F. Tietz, D. Basu and D. Stöver, J. Am. Ceram. Soc., 2000, 83, 2023–2028 CrossRef CAS.
- E. Djurado, P. Bouvier and G. Lucazeau, J. Solid State Chem., 2000, 149, 399–407 CrossRef CAS.
- D. Michel, M. P. y. Jorba and R. Collongues, J. Raman Spectrosc., 1976, 5, 163–180 CrossRef CAS.
- P. Bouvier and G. Lucazeau, J. Phys. Chem. Solids, 2000, 61, 569–578 CrossRef CAS.
- A. Parija, G. R. Waetzig, J. L. Andrews and S. Banerjee, J. Phys. Chem. C, 2018, 122, 25709–25728 CrossRef CAS.
| This journal is © The Royal Society of Chemistry 2019 |