
 Open Access Article
 This Open Access Article is licensed under a Creative Commons Attribution-Non Commercial 3.0 Unported Licence
Fish-scale-derived carbon dots as efficient fluorescent nanoprobes for detection of ferric ions†
Yi Zhangab,
Zhiyong Gao *a,
Xue Yangb,
Jiuli Changa,
Ziyan Liuc and
Kai Jiang*ad
*a,
Xue Yangb,
Jiuli Changa,
Ziyan Liuc and
Kai Jiang*ad
aSchool of Chemistry and Chemical Engineering, Collaborative Innovation Center of Henan Province for Green Manufacturing of Fine Chemicals, Key Laboratory of Green Chemical Media and Reactions, Ministry of Education, Henan Normal University, Xinxiang 453007, Henan, PR China. E-mail: zygao512@163.com; kjiang512@163.com
bSchool of Laboratory Medicine, Xinxiang Medical University, Xinxiang 453003, Henan, PR China
cMaternal and Child Care Service Centre of Xinxiang City, Xinxiang 453000, Henan, PR China
dSchool of Environment, Henan Normal University, Xinxiang 453007, Henan, PR China
First published on 9th January 2019
Abstract
Herein, highly fluorescent carbon dots (CDs) with the incorporation of N and O functionalities were prepared through a facile and cost-effective hydrothermal reaction using fish scales of the crucian carp as the precursor. The as-prepared CDs exhibit strong fluorescent emissions at 430 nm with a relative quantum yield of 6.9%, low cytotoxicity, and robust fluorescence stability against photobleaching and good ionic strength. More significantly, the fluorescence of these CDs can be effectively and selectively quenched by Fe3+ ions, which enables the application of CDs as fluorescent Fe3+ nanoprobes with a linear range of 1–78 μmol L−1 and a detection limit of 0.54 μmol L−1. The proposed fluorescent CD nanoprobes can also be used for the assay of spiked Fe3+ in real water samples and human serums with high recoveries and low standard deviations. Hence, CDs can be potentially applied as safe and reliable fluorescent nanoprobes for environmental and clinical Fe3+ analyses.
Fe3+ ions are a versatile chemical that have been widely used in the purification of drinking water, catalyzing certain reactions,1,2 and electronic industry. In addition, Fe3+ is also an essential metal ion in hemoglobin, myosin, and cytochrome, which can regulate normal oxygen uptake, cellular metabolism, and enzymatic reactions in physiological DNA and RNA syntheses in human bodies.3,4 The deficiency of Fe3+ causes various diseases such as iron deficiency, anemia, aplastic anemia, complicating further into limb weakness and reduced immune functions,5 whereas excessive Fe3+ can result in dysfunctions (kidney, heart, and liver), Alzheimer's disease, and even cancer.6–8 Hence, the accurate analysis of Fe3+ is of significant clinical importance. On the other hand, the overutilization of Fe resources and the discharge of Fe3+-containing sewage into aquatic environments result in a considerable threat to the natural environment; therefore, the accurate and reliable determination of Fe3+ in aquatic media is also imperative.9 Conventional Fe3+ detection techniques mainly include flame atomic absorption spectrophotometry (FAAS),10 inductively coupled plasma mass spectrometry (ICP-MS),11 voltammetry,12 and spectrometry.13 Although worthwhile detection accuracy can be achieved, these techniques usually require tedious sample preparation procedures or sophisticated instruments, which limit the rapid and handy analysis of Fe3+ in practice. Hence, it is essential to develop cost-effective analysis means for the quantitative detection of Fe3+.
Because of its high sensitivity, rapid response, and simplicity in sample preparation, the fluorescent probe technique is recognized as an alternative means to quantitatively determine Fe3+ ions through fluorescence quenching interactions.14–16 Currently, the major fluorescent probe materials for Fe3+ detection include organic fluorescent dyes,17,18 noble metal nanoclusters,19,20 and heavy-metal chalcogenide semiconductor quantum dots.21,22 Nevertheless, organic fluorescent dyes suffer from photobleaching, and semiconductor quantum dots suffer from potential elemental toxicity and complicated size/morphology control issues. Therefore, it is essential to investigate alternative fluorescent probes for the sensitive and rapid detection of Fe3+ with high photostability, low cytotoxicity, and easy availability that can be suitable for widespread applications.
Carbon quantum dots (CDs) represent a newly emerged fluorescent nanomaterial with the doping or decoration of heteroelements containing functionalities within/onto the tiny carbonaceous motif (below 10 nm).23 Besides the high fluorescence intensity, CDs also exhibit high solubility, robust chemical inertness, high resistance toward photobleaching, and good biocompatibility; hence, CDs can serve as efficient and safe fluorescent nanomaterials for bioimaging,24 anti-faking,25 biosensing,26 and photocatalysis.27 In particular, CDs can serve as electron donors in contact with guest acceptors through electrostatic or coordination interactions: the excitation state electrons of CDs can be nonradiatively transferred to the guest analytes, and therefore, the fluorescence of CDs is effectively quenched. Hence, CDs are widely investigated as credible sensing nanoprobes for the analyses of various guest ions/molecules with high sensitivities and reliabilities.
In general, CDs can be prepared through top-down and bottom-up strategies. The former approach mainly includes the chemical or electrochemical cutting of graphitic motifs (graphite, carbon nanotubes, or graphene) into tiny nanodots with tunable bandgaps, but this approach commonly necessitates harsh synthesis conditions and modification of functionalities to tune the electron structure, structural energy traps, and further the fluorescent activities. In contrast, the latter approach can more easily yield CDs through the pyrolysis, solvothermal, or wet-chemical condensation of small molecular organics, polymers, and other easily available biomass low-cost raw materials, which cater toward the cost expectation for practical applications. Up to now, various natural biomass precursors, such as fruit juices,28–30 vegetables,31,32 grass,33 milk,34 beer,35 and even waste36 have been successfully employed to fabricate fluorescent CDs. Fish scale is a commonly discarded biomass waste containing rich proteins, which is considered to be a potential precursor for the cost-effective preparation of CDs in a safe manner. The further utilization of the afforded fluorescent CDs as fluorescent nanoprobes for Fe3+ detection deserves to be investigated.
In this work, the easily available fish scales of the crucian carp was employed as a precursor for the hydrothermal synthesis of CDs. The afforded water-soluble CDs exhibit strong bluish fluorescence with a quantum yield (QY) of 6.9%, high resistances against photobleaching, high ion strength, and low cytotoxicity. The fluorescence of CDs can be effectively quenched by Fe3+ ions via static quenching, which facilitates its application as fluorescent Fe3+ nanoprobes with a wide linear detection range and low detection limit. Such CD-based fluorescent Fe3+ nanoprobes can be further used in the determination of real water samples and human serum with high reproducibility, exhibiting their potential as reliable fluorescent nanoprobes for environmental and clinical Fe3+ detection.
Experimental
Reagents
Dulbecco's modified eagle medium (DMEM) and fetal bovine serum (FBS) were obtained from Gibco (USA). Common chemical reagents were of the analytical grade and directly used as received. Deionized (DI) water was used throughout the experiment. Britton–Robinson (BR) buffer solutions with different pH values were prepared by adding concentrated NaOH (0.2 M) to a H3PO4–HAc–H3BO3 mixed acid solution (0.04 M each). Normal human serum samples were kindly provided by the local hospital (Xinxiang, China).Synthesis of CDs
CDs were prepared by the hydrothermal treatment of the fish scale precursor. In brief, 1.0 g fish scales of the crucian carp (local supermarket, Xinxiang, China) was pulverized and dispersed in 40 mL DI water under vigorous stirring, followed by hydrothermal treatment in a Teflon-lined stainless steel autoclave at 200 °C for 20 h. After being naturally cooled, the brownish dispersion was centrifuged at 3000 rpm for 15 min to remove the sediment. The clear supernatant was dialyzed using a dialysis bag (molecular weight cutoff: 3500 Da) in DI for 48 h. Finally, the purified CD solution was filtered using a 0.22 μm membrane filter and freeze-dried for characterizations. The obtained brown product was dispersed in DI water to form a clear suspension with a concentration of 5 mg mL−1 for the subsequent fluorescent sensing measurements.Characterizations
High-resolution transmission electron microscopy (HRTEM, JEOL JEM 2100) was used to obtain the microstructure of CDs. The functionalities of the CDs were characterized by using Fourier-transform infrared spectroscopy (FTIR, Thermo Nicolet FTS NEXUS: the sample was pressed in a KBr pellet). The phase and elemental statuses of the CDs were characterized by powder X-ray diffraction (XRD, Bruker D8 diffractometer with Cu-Kα incident radiation) and X-ray photoelectron spectroscopy (XPS, ESCALAB250, Thermo, UK). The UV-vis absorption spectra, fluorescence emission spectra, and time-resolved fluorescence spectra of the CD solution and CD–Fe3+ system were recorded on UV-1700 spectrophotometer (Shimadzu), FP-6500 spectrophotometer (Hitachi), and FlS-980 fluorescence spectrometer (Edinburgh Instrument), respectively.Procedure for Fe3+ detection
Typically, 200 μL CD dispersion (5 mg mL−1) was added in a test tube, followed by the addition of 1 mL BR buffer solution (pH = 7.0). Thereafter, standard Fe3+ solutions (0.001 and 0.01 M, diluted from 1.000 M concentrated stock solution) with different volumes were added into the CD solution and then diluted to 4 mL with DI water. The detailed dosages of Fe3+ are listed in Table S1.† The solution was shaken at room temperature for 5 min for fluorescent measurement at the excitation wavelength (λex) of 350 nm. The interferents of inorganic ions and biomolecules were also added to the CD solution instead of Fe3+ and the fluorescence spectra were recorded at λex = 350 nm.Analysis of real samples
To evaluate the feasibility of CD-based fluorescent nanoprobes for Fe3+ detection in real aquatic media or serum samples, the water samples (collected from Xinxiang China) were filtered through a 0.22 m membrane (Millipore) and used as the solvent. Aliquots (1 mL) of the filtered water sample spiked with standard Fe3+ ion solutions (final concentrations: 8 and 12 μmol L−1) were diluted to 4 mL with the BR buffer solution (pH = 7.0) and CD solution (final concentration of CDs: 250 mg mL−1). Then, the PL intensities of the spiked solutions were measured. With regard to the serum sample, the normal human serum sample from a local hospital (Xinxiang, China) was directly used for determining the concentration of the spiked Fe3+ in a similar manner.Cytotoxicity assays
PC-12 (pheochromocytoma of the rat adrenal medulla) cells were cultured in DMEM containing 5% FBS under 5% CO2 atmosphere at 37 °C, which was used to evaluate cell toxicity. The cell viability was measured using the MTT (3-(4,5-dimethyl-2-2thiazolyl)-2,5-diphenyl-2H-tetrazolium bromide) assay. In brief, 5 × 10⁵ cells (100 μL) were incubated with CDs (40, 100, 200, 300, and 400 μg mL−1) in quadruplicates in a 96-well plate for 24 h at 37 °C; cells treated with dimethyl sulfoxide alone were used as a comparison. Thereafter, 10 μL MTT (5 mg mL−1) was added to each well and incubated for an additional 4 h at 37 °C. The absorbance in the presence and absence of CDs were measured at 570 nm for the calculation of cell viability.37 The cell viability can be expressed as follows:
QY measurements
The QY values of CDs were determined by comparing the integrated fluorescence area (λex = 350 nm) at per unit absorbance (at 350 nm) of CDs using quinine sulfate dissolved in 0.1 M H2SO4 as the standard (QY = 0.54). The QY value was calculated using the equation QYx = QYST(Fx/FST)(Ax/AST)(λx/λST)(ηx/ηST)2.15 Here, F is the integral area of the fluorescence emission spectra, A is the absorbance, λ is the fluorescence excitation wavelength, η is the refractive index of the solvent, and the subscripts ST and x represent the reference quinine sulfate and CD samples, respectively. In order to minimize the reabsorption effect, the absorbance was maintained below 0.05.Cellular imaging
KG-1a cells were cultured and maintained in DMEM. The media were supplemented with 5% FBS. The cells were maintained at 37 °C and in a humidified atmosphere with 5% CO2. KG-1a cells were trypsinized and seeded in tissue culture plates at 5 × 10⁵ cells per well. After overnight incubation inside a humidified 5% CO2 incubator for cell attachment, the cells were incubated with CDs for 24 h. After washing five times with fresh phosphate buffer solution, fluorescence microscopy images were recorded with an inverted fluorescence microscope (Nikon Eclipse Ti-S) within a λex range of 320–450 nm.Results and discussion
Characterizations
Fish scales are often discarded biomass waste in our daily diet, but they contain rich nourishments including collagen protein, fat, and vitamins;38,39 hence, fish scales are valuable and easily available precursors for transforming into useful carbonaceous materials through carbonization treatments. In this work, fish scales of the crucian carp were attempted for use as a precursor for the preparation of CDs in order to realize resource reutilization. Under hydrothermal treatment at 200 °C for 20 h, the peptide chains of collagen and other organic ingredients experience partial hydrolytic cleavage, dehydrogenation, and dehydroxylation reactions to afford reactive radical intermediates.40,41 The condensation and cyclic rearrangement of these radicals, namely, their carbonization at high temperatures, yields an aromatic carbon framework, as intuitively evidenced from the brownish color of the CD solution. On the other hand, the residual polar functionalities onto the carbonaceous motif impart the CDs with high surface polarity or hydrophilicity, which enables its excellent solubility in aqueous media. Upon irradiation by ultraviolet light, this aqueous CD solution exhibits light bluish fluorescence, showing a robust fluorescent property. The preparation process of fish-scale-derived CDs is summarized in Fig. 1.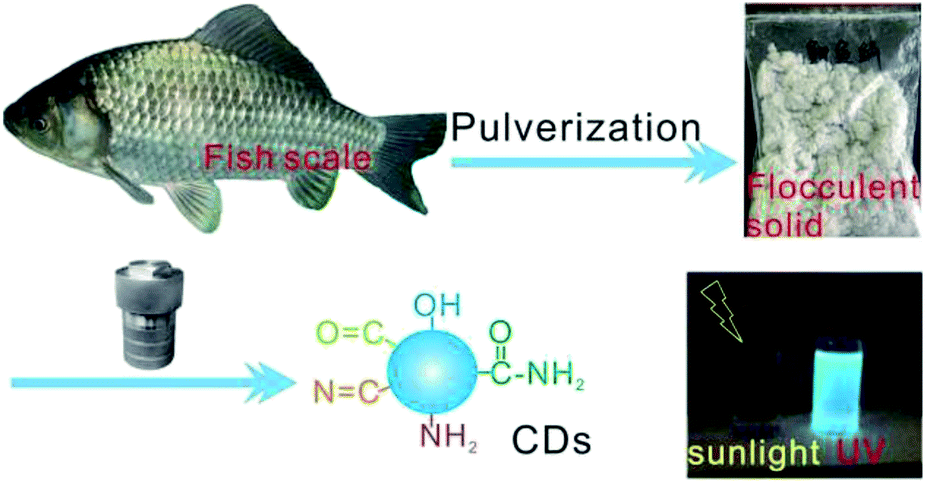 | ||
| Fig. 1 Schematic illustration for the preparation of fish-scale-derived CDs. | ||
The morphology and microstructure of the as-prepared CDs are shown in Fig. 2a. As observed, the approximately spherical CD particles with a size of 5–10 nm free of severe aggregation exhibit good dispersity. Fig. 2b shows the HRTEM image of the individual CDs: all the CDs demonstrate low contrast against the background, which is mainly due to the tiny size and low atomic weights of skeletal C and doped N atoms against the electron beam; the easy penetration of the electron beams across the CDs induce high transmittance. In addition, well-resolved lattice fringes with a spacing of 0.21 nm can be observed within the CDs, which correspond to the (100) planes diffraction of the graphitic carbon framework,42 revealing the easy carbonization of the fish scale precursors. These results indicate the successful carbonization of the nourishment components in fish scales to form a graphitic microstructure within the CDs.
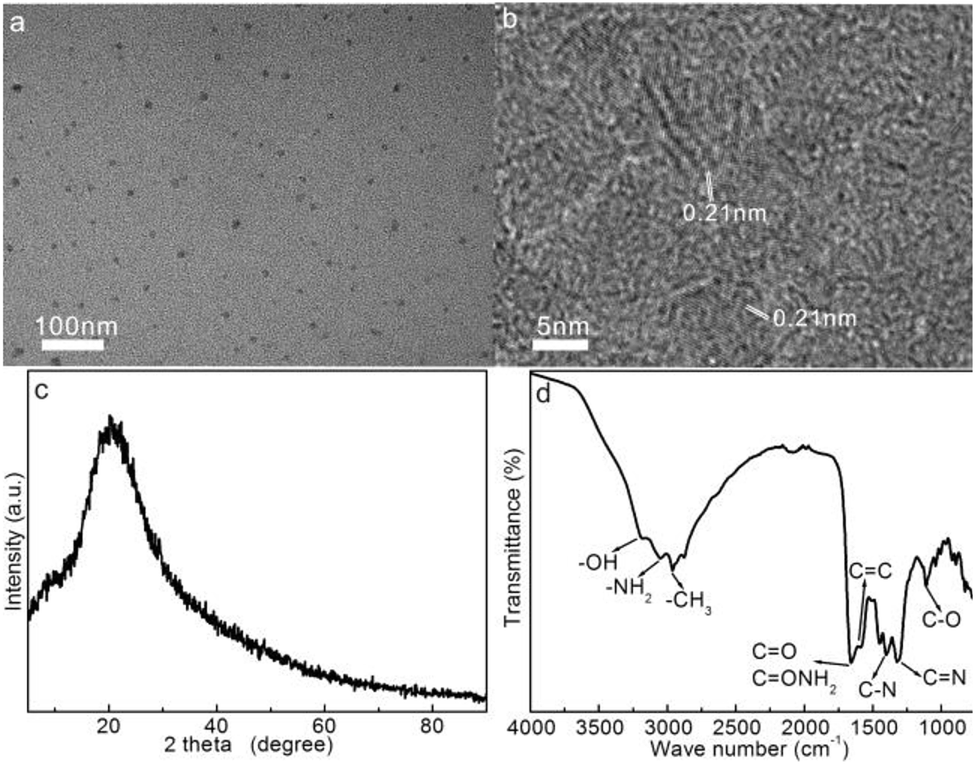 | ||
| Fig. 2 (a) TEM, (b) HRTEM, (c) XRD, and (d) FTIR spectra of the CDs. | ||
Fig. 2c shows the XRD pattern of freeze-dried CD solids. The wide diffraction peak centered at 20.5° corresponds to the (002) planes of the graphitic carbon structure with an interlayer d value of 0.43 nm. The larger spacing over graphite (0.336 nm) is presumably due to the weaker aromatic stacking interaction of the graphitic carbon framework owing to the low graphitization degree and abundant N and O functionalities around the CDs.43,44 Overall, the weak diffraction intensity and broadness of the peak suggest the amorphous phase of CDs induced by the hydrothermal carbonization of fish scales.
The FTIR spectrum of CDs was characterized to reveal the chemical functionalities within the CDs, as shown in Fig. 2d. The peak at 1640 cm−1 corresponds to the C![[double bond, length as m-dash]](https://www.rsc.org/images/entities/char_e001.gif) O and CONH2 stretching vibrations.45 The three bands around 3200, 3060, and 2960 cm−1 are associated with the –OH, –NH2, and –CH3 groups, respectively.46,47 In addition, the characteristic IR vibrations at 1596, 1395 cm−1, and 1310 cm−1 can be assigned to the CC, C–N, and tertiary CN stretching vibrations, respectively,42,47 and the peak at 1106 cm−1 is attributable to the stretching vibrations of the C–O groups within the CDs.42,48 All these vibrations preliminarily indicate the presence of enriched –OH/–NH2, carbonyl, and amide functionalities onto the aromatic CC/CN framework. These abundant polar functionalities enable high hydrophilicity and stability of CDs in an aqueous medium.
O and CONH2 stretching vibrations.45 The three bands around 3200, 3060, and 2960 cm−1 are associated with the –OH, –NH2, and –CH3 groups, respectively.46,47 In addition, the characteristic IR vibrations at 1596, 1395 cm−1, and 1310 cm−1 can be assigned to the CC, C–N, and tertiary CN stretching vibrations, respectively,42,47 and the peak at 1106 cm−1 is attributable to the stretching vibrations of the C–O groups within the CDs.42,48 All these vibrations preliminarily indicate the presence of enriched –OH/–NH2, carbonyl, and amide functionalities onto the aromatic CC/CN framework. These abundant polar functionalities enable high hydrophilicity and stability of CDs in an aqueous medium.
The chemical status of the CDs was characterized by XPS. From the survey spectrum (Fig. 3a), it is evident that the CDs display three distinct peaks at 285, 400, and 531 eV, which are, in turn, assignable to the C 1s, N 1s, and O 1s orbits, respectively, showing the carbonaceous framework with the doping/decoration of N and O groups. The atomic fractions of C, N, and O are 70, 14, and 16%, respectively, in CDs, indicating the enriched N and O functionalities within/onto the carbon motif. To additionally identify the elemental form, the C 1s, N 1s, and O 1s peaks were deconvoluted and fitted. As shown in Fig. 3b, the C 1s spectrum of CDs comprises skeletal CC/C–C (284.5 eV) bonds and C–N/C–O (285.1 eV), C–O/CN (286.1 eV), and CO (288.1 eV) functionalities,47,49 revealing the enriched N and O functionalities onto the graphitic framework. Moreover, the N 1s peak (Fig. 3c) can be fitted into C–N–C (399.6 eV) and N–H bonds (400.2 eV),50 revealing that the N element mainly exists in the form of amino groups and doped carbonaceous framework. The O 1s spectrum (Fig. 3d) fitting result indicates the decoration of CO (531.2 eV) and C–OH/C–O–C (532.1 eV) groups onto the carbonaceous framework.51 All these functionalities identified by the XPS basically coincide with the FTIR results, proving the decoration of amine, amide, hydroxyl, and carbonyl groups onto the N-incorporated carbonaceous framework. The multiple N and O groups onto the CDs promote high hydrophilicity and further the formation of stable aqueous solutions, suitable for realizing long-term preservative-free precipitate that can be beneficial in practical applications. In addition, these single- and double-bonded functional groups can function as auxochromes/chromophores, ensuring fluorescent emissions or stabilizing surface-defect-associated emission energy traps: both these factors are beneficial toward facilitating high fluorescent activity of CDs.
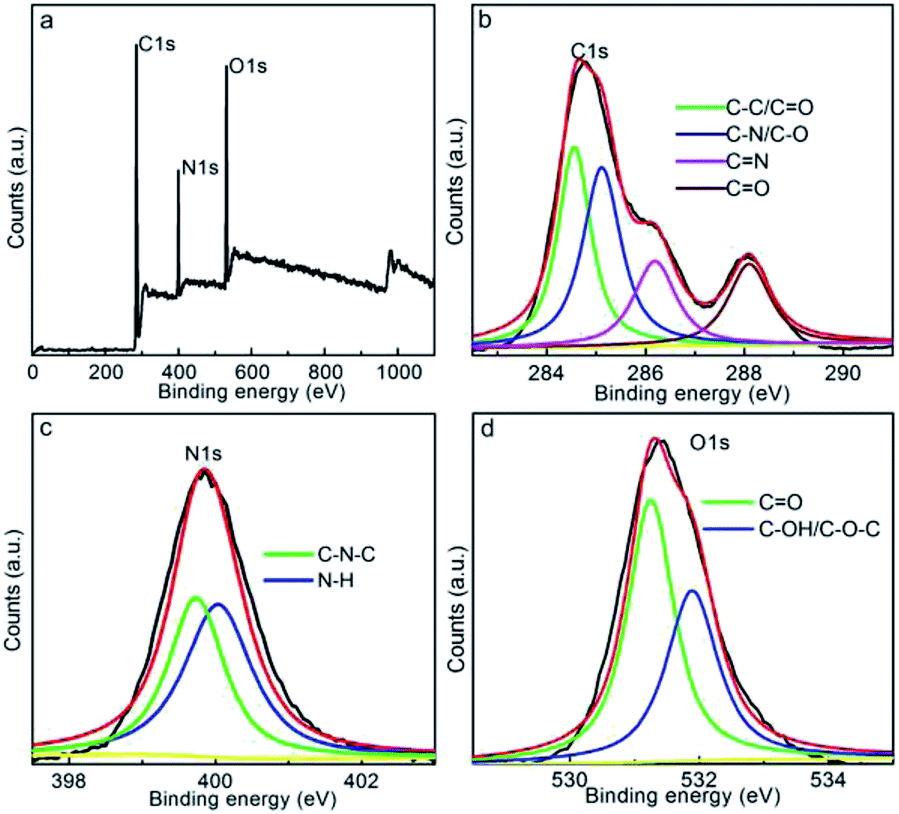 | ||
| Fig. 3 (a) XPS, (b) C 1s, (c) N 1s, and (d) O 1s spectra of CDs. | ||
Optical properties of CDs
The UV-vis absorption spectrum of the aqueous CD solution (Fig. 4a) exhibits distinct absorbance in the UV region. The obvious absorption plateau at 263 nm is mainly assigned to the π–π* transition of the skeletal aromatic carbon rings and double bonds.52 In addition, another obvious background within 300–350 nm is associated with the n–π* transition of the double bonds with groups such as CO, CN, and CONH2.53,54 These characteristic absorptions reflect the aromatic carbonaceous motif and coexistence of double-bond-containing functionalities, which can serve as chromophores or auxochromes, reinforcing the fluorescence emissions of CDs. The fluorescent properties were initially evaluated under excitation at λex = 350 and 700 nm, as shown in Fig. 4b. The aqueous CD solution exhibits strong fluorescence emissions centered at 440 nm, showing both down-conversion and up-conversion fluorescence behaviors. These characteristics indicate that the fluorescence emission can be triggered by high-energy photons (down-conversion) and multiple low-energy photons (up-conversion). Under excitation at 350 nm, the relative QY of the CD solution can be calculated as 6.9%, yielding high fluorescence activity.
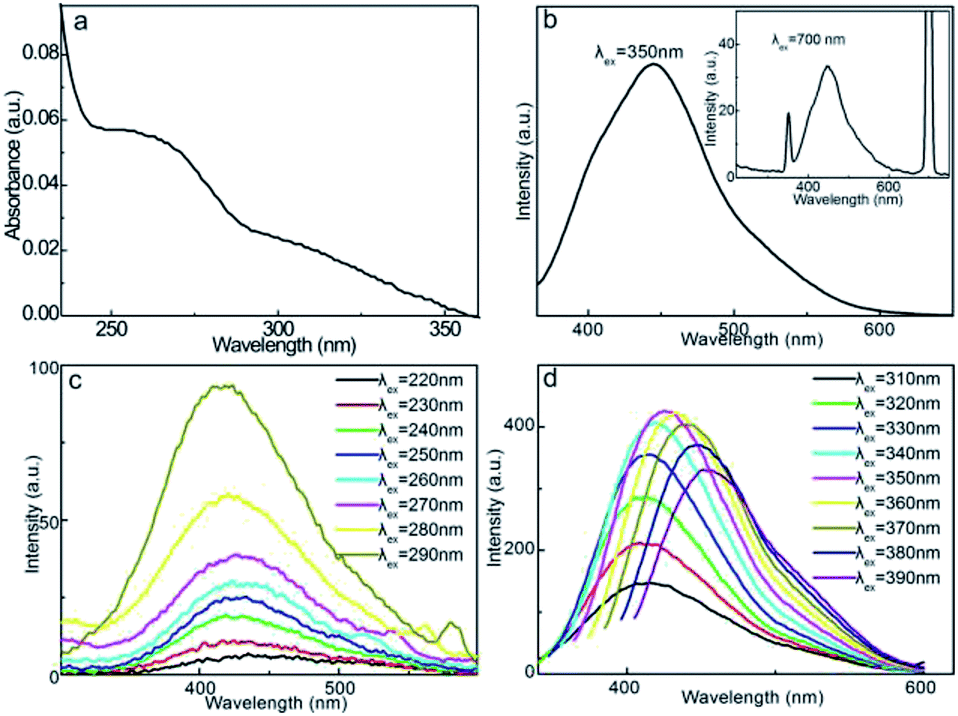 | ||
| Fig. 4 (a) UV-vis absorption spectrum, (b) fluorescence emission spectra of CDs at λex = 350 and 700 nm (inset), CCDs = 25 μg mL−1. Fluorescence spectra of CDs within λex range of (c) 220–290 nm and (d) 310–390 nm, CCDs = 125 μg mL−1. | ||
The λex dependence of CDs can primarily reveal the origins of the fluorescence behavior, as shown in Fig. 4c. As λex increases from 220 to 290 nm, the emission intensity gradually increases, but the emission wavelength (λem) remains almost unaltered at 425 nm. This portion of λex-independent emission behavior is presumably related to the carbonyl, amide, and imine chromophores.55 The almost constant ground state–excitation state energy gap of these double-bond functionalities is responsible for this invariable λem. In contrast, a further increase in λex from 310 to 390 nm induces gradual red-shifts in λem from 430 to 455 nm (Fig. 4d). The maximum emission intensity is achieved at λem = 440 nm upon excitation at λex = 350 nm, revealing the obvious λex-dependent fluorescence behavior. This portion of the λex-dependent fluorescence behavior is presumably derived from the surface state and size-dependent optical selection of CDs.42,56 The different charge recombination energies of the individual CD particles yield different emission energies, and therefore, different λem values. In addition, particles with smaller sizes generally emit at shorter λem values for larger bandgaps, while larger particles emit at longer λem values; this factor also causes different excitation energies of different CDs, and therefore, the λex-dependent fluorescence behavior. The combined λex-independent and λex-dependent behaviors prove that dual fluorescence mechanisms are involved in down-conversion fluorescence emissions. Moreover, CDs also exhibit weak up-conversion fluorescence behavior with λex varying within 560–740 nm with the maximum emission intensity at λem = 440 nm upon excitation at λex = 700 nm (Fig. S1†). The λex-dependent up-conversion emission excludes the anti-Stokes emission mechanism; therefore, it is hypothesized that the emission of CDs is caused by the excitation of two or more low-energy photons to sustain the electron transitions to the excitation state, and therefore, the emission of high-energy photons, namely, the multi-photon mechanism.57
The fluorescence emission spectra at different CD concentrations were also measured upon excitation at λex = 350 nm (Fig. 5a): the emission intensity increases proportionally with the CD concentration up to 250 μg mL−1. The strong PL behavior and good linearity enable the application of CDs as fluorescent probes for the quantitative analysis of analytes at various concentrations without scrupling the self-quenching effect. The good linearity between the up-conversion emission intensity (λex = 700 nm) and CD concentration (Fig. 5b) also suggests the feasibility as fluorescent probes. Considering the much higher emission intensity, the down-conversion emission feature is more suitable for the fluorescence sensing of guest quenchers with higher sensitivity.
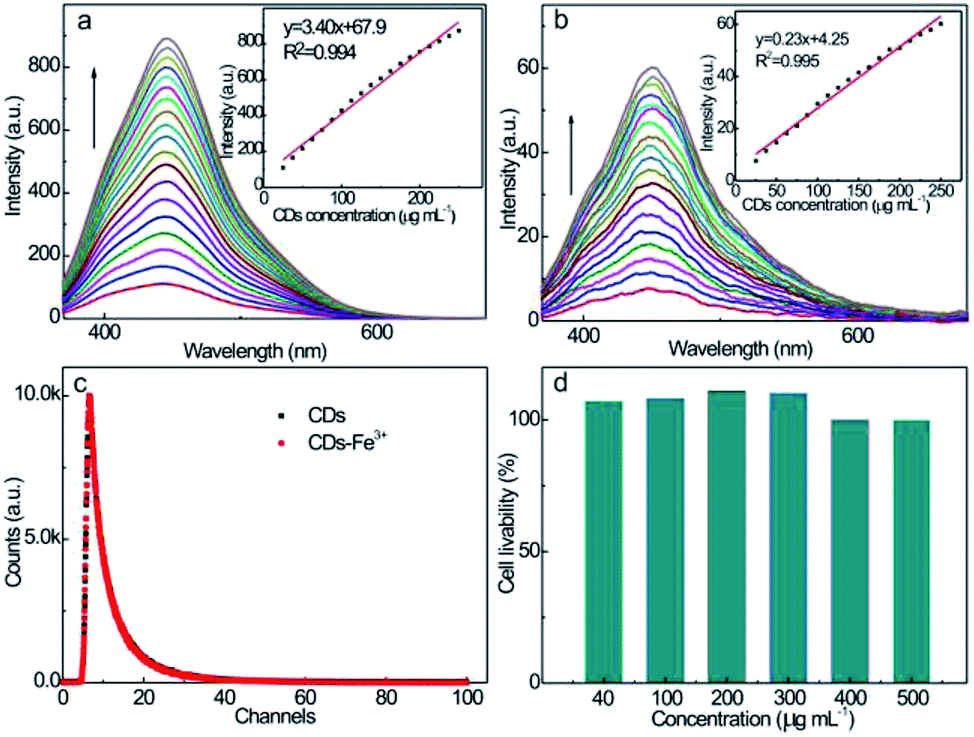 | ||
| Fig. 5 Fluorescence spectra of aqueous CD solutions with different concentrations at (a) λex = 350 nm and (b) λex = 700 nm. Inset: emission intensity vs. CD concentration plots. CD concentration: 25, 37.5, 50, 62.5, 75, 87.5, 100, 112.5, 125, 137.5, 150, 162.5, 175, 187.5, 200, 212.5, 225, 237.5, and 250 μg mL−1. (c) Fluorescence decay curves of aqueous CD and CD–Fe3+ systems. (d) Livability of PC-12 cells incubated at different CDs concentrations. | ||
The fluorescence decay property of the CD solution at λex = 350 nm is revealed by the time-resolved fluorescence spectrum (Fig. 5c). The fluorescence of the CD solution exhibits double-exponential decay kinetic behavior with τ1 of 2.84 ns and τ2 of 8.86 ns, and their relative fractions are 43.7 and 56.3%, respectively. According to the double exponential simulation, the average fluorescence lifetime of CDs is calculated to be 6.2 ns, revealing a robust PL property as a consequence of the coupled surface energy traps, bandgap, and surface chromophores' fluorescence emission manners, which allow the rapid radiative recombination of the excitation state electrons. Upon incubation with Fe3+ quenchers, the fluorescence decay trend of the CD–Fe3+ system almost completely overlaps with that of the initial CDs solution, and the average fluorescence lifetime of the CD–Fe3+ system hardly alters (6.3 ns), revealing that the Fe3+ ions do not influence the relaxation time of the excitation state electrons of CDs.
To further examine the cytotoxicity of CDs, MTT assays were performed using PC-12 cells as the representative model. As shown in Fig. 5d, over 95% of the PC-12 cells can still survive upon incubation with CDs over a wide concentration range of 40–500 μg mL−1 for 24 h. This high cell viability confirms the negligible cytotoxicity and superior biocompatibility. The low cytotoxicity of the as-prepared CDs enables its clinical applications as a safe, fluorescent nanoprobe for monitoring Fe3+ in bodily fluids.
Considering the robust fluorescence characteristics with low cytotoxicity, CDs can also be used in cellular imaging. It was attempted to use KG-1a cells as the model to assess the feasibility of using CDs in intracellular bioimaging. Fig. 6 shows the optical microscopy and fluorescent microscopy images of CD-dyed KG-1a cells. In relation to the optical image (Fig. 6a), light blue fluorescence was observable in the intracellular region of the cells (Fig. 6b), showing the successful internalization of CDs into the cells. Hence, CDs can be used as optical labels for in vitro cellular imaging. Furthermore, CD-dyed KG-1a cells were cultivated with exogenous Fe3+ for 2 h. The fluorescence of KG-1a cells cannot be discerned from Fig. 6c and d, which preliminarily suggests that our CDs can be employed as nanoprobes for the analysis of intracellular Fe3+ through quenching interactions. All these results indicate that CDs are membrane-permeable and can serve as potential intracellular Fe3+ imaging probes.
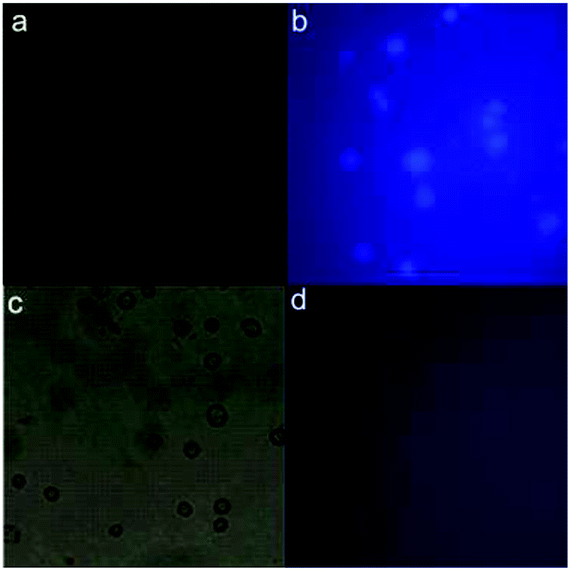 | ||
| Fig. 6 (a and c) Optical microscopy and (b and d) fluorescence microscopy images of KG-1a cells incubated with 125 μg mL−1 CDs for 24 h at 37 °C in the (a and b) absence and (c and d) presence of Fe3+ (2.5 μmol L−1 FeCl3). | ||
Optimization of assay conditions
Resistance against photobleaching is a worthwhile prerequisite for applications as reliable fluorescent nanoprobes. To facilitate photostability, an aqueous CD solution was exposed to continuous irradiation at λex = 350 and 700 nm for different time courses (Fig. S2†). The emission intensities hardly decay upon irradiation up to 120 min, suggesting the robust photostability of CDs, which sustains the fluorescence sensing of guest quenchers with good endurability to incident light. Moreover, the down-conversion and up-conversion emission intensities of CDs are rather stable at different ionic strengths (aqueous NaCl solutions within the concentration range of 0–125 mM) (Fig. S3†), suggesting that these CDs are highly stable against ionic strength, which is essential for the accurate sensing of analytes in real water samples that generally contain trace mineral components. Common biomolecules such as amino acids, DNA, and glucose cannot cause obvious fluorescence attenuation of CDs (Fig. S4†), which are also beneficial for the detection of guest quenchers in different bodily fluid samples with slight differences in the components. Furthermore, different inorganic ions were introduced into the aqueous CD solution: the fluorescence emission intensity remains unvaried when the main group ions, common transition metal ions (such as Zn2+, Cd2+, Co2+, and Mn2+ ions), and common anions (such as Cl−, SO42−, and NO3− ions) (100 μmol L−1) are introduced. These ions cannot quench the fluorescence of CDs, whereas Ag+, Cu2+, and Ni2+ cause a weak quenching effect on the fluorescence of CDs (Fig. S5†). It is also worthwhile to mention that Fe3+ obviously quenches the emission of CDs, which implies the highly selective fluorescent response of CDs toward Fe3+. Therefore, CDs can find applications in the selective detection of Fe3+ in aquatic environment or bodily fluid samples. The effect of pH (2–11) on the fluorescence spectrum of CDs was also investigated (Fig. S6†). The fluorescence intensity of CDs is maintained at a high and stable level in the pH range of 2–7, so pH = 7 is employed as the optimal environment for the construction of a fluorescence-sensing platform.Considering the worthwhile fluorescent activity, excellent resistance against photobleaching, ion strength in a neutral pH medium, and sensitive fluorescence response toward Fe3+, as-prepared CDs can be promising fluorescent nanoprobes for the quantitative detection of Fe3+. Fig. S7† shows the effect of CD concentration on the fluorescence emission intensity of CD–Fe3+ system with a fixed Fe3+ concentration of 2.5 μmol L−1. After the incorporation of Fe3+, the apparent decrement in the fluorescence intensity indicates that Fe3+ effectively quenches the fluorescence emission of CDs, and the fluorescence quenching extent depends on the CD concentration. At higher CD concentrations, the quenching extent (ΔF = F0 − F) increases. The increased sensitivity toward Fe3+ is mainly due to the additional sufficient quenching interactions between Fe3+ and CDs. When the CD concentration increases to 250 μg mL−1, ΔF is the largest. To balance the detection accuracy and CD dosage, 250 μg mL−1 was selected as the optimal concentration of CDs for Fe3+ detection.
The effect of the type of buffer solution on CD-based fluorescent nanoprobes for Fe3+ detection was also investigated. The relative fluorescence emission intensities of CD–Fe3+ systems in 1 mL Na2HPO4–citric acid, BR, NaH2PO4–Na2CO3, and KH2PO4–NaOH buffer solutions (pH = 7.0) were compared. As shown in Fig. S8a,† the BR buffer solution system exhibits the strongest fluorescence intensities and the largest ΔF value; these results indicate that BR is the optimal buffer medium for the fluorescence analysis for Fe3+ with higher sensitivity. The effect of the BR buffer solution concentration on ΔF values of CD–Fe3+ detection systems was also investigated (Fig. S8b†). The fluorescence intensities of the CD and CD–Fe3+ systems changed marginally in the range of 0.5–2.0 mL, whereas the ΔF value is larger and stable in the 1.0 mL buffer system; therefore, 1.0 mL BR buffer solution dosage was employed for Fe3+ detection. Based on the abovementioned optimization trials, CDs in 1.0 mL BR buffer solution at pH = 7.0 were employed as the preferred auxiliary medium for the fluorescent detection of Fe3+.
In order to study the reproducibility of CD-based fluorescent nanoprobes for Fe3+ detection, the fluorescence spectra of the CD–Fe3+ system was repeatedly recorded by conducting eleven parallel trials. The relative standard deviation of 0.37% suggests the good reproducibility of CD-based fluorescent nanoprobes for Fe3+ analyses (Fig. S9†).
Calibration curve and detection limit
The fluorescence emission spectra of CDs at different Fe3+ ion quencher concentrations are shown in Fig. 7a. Upon excitation at λex = 350 nm, the emission intensity decreases according to the concentration of Fe3+ ions, showing efficient fluorescence quenching of CDs at higher Fe3+ ion concentrations. Moreover, no discernible changes in the peak wavelength or shape of the emission spectrum accompanied the quenching effect, suggesting a strong interaction between Fe3+ and surface functionalities (hydroxyl and amine groups) on the CDs. This induces the nonradiative electrons to transfer from the excited state of CDs to the half-filled 3d orbits of Fe3+,53,58 which, therefore, interrupts the radiative transition of electrons to the ground state to accomplish electron–hole pair recombinations, namely, the fluorescence quenching effect. From Fig. 7b, the fluorescence emission intensity of CD–Fe3+ system decreases monotonously with an increase in the concentration of Fe3+ up to 488 μmol L−1, showing the possession of rich interaction sites on the CDs. It should be noted that the emission intensity of the CD–Fe3+ system exhibits good linearity within the Fe3+ concentration range of 1–78 μmol L−1, which implies that CDs can serve as credible fluorescent nanoprobes for the quantitative detection of trace Fe3+ ions. It should also be noted that the decreased slope over this Fe3+ concentration range is presumably associated with the formation of Fe(OH)3, which suppresses the fluorescence response of CDs.59 From the inset, it is evident that a good linear response was observed at the square of the correlation coefficient (R2) value of 0.998. The regression equation is as follows: ΔF = 3.46 + 16.24[Q] (μmol L−1), where the detection limit is 0.54 μmol L−1 (n = 11). According to the guideline detection limit of the allowed maximum Fe3+ concentration (5.4 μM) in drinking water proposed by the U.S. Environmental Protection Agency,30,60 the lower detection limit reveals that CDs are credible fluorescent probes in the quantitative detection of trace amounts of Fe3+ in drinking water. From Table 1, the linear range and detection limit of our CD-based fluorescent nanoprobes are comparable to other nanoprobes, such as N-doped CDs obtained from microwave pyrolysis,42 N-doped CDs derived from Phyllanthus acidus and ammonia,57 and graphene quantum dots obtained by the acid oxidation of carbon black,59 which are the competition in the sensitive detection of Fe3+.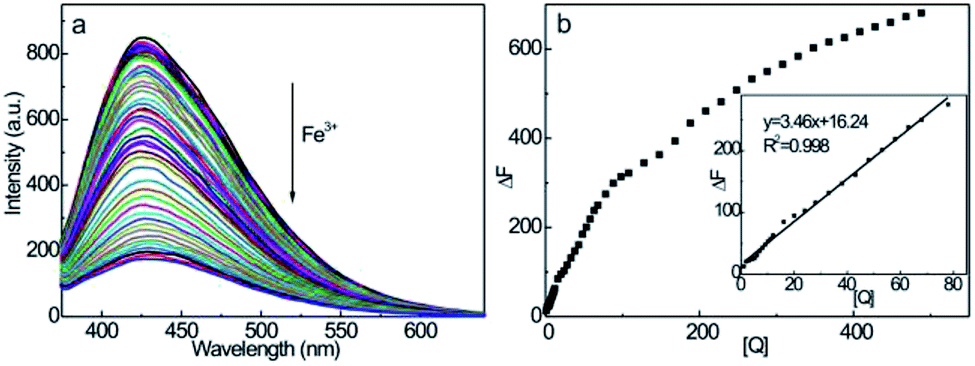 | ||
| Fig. 7 (a) Fluorescence spectra of the CDs–Fe3+ system at various Fe3+ concentrations (1–488 μmol L−1) and (b) linear relationship between ΔF and Fe3+ concentration (1–78 μmol L−1). CCDs = 250 μg mL−1. | ||
| Fluorescent materials | Linear ranges (μM) | Detection limits (μM) | Reference |
|---|---|---|---|
| N,S co-doped CDs | 0–3.5 | 0.017 | Ref. 1 |
| Polymer dots | 0.1–10 | 0.0037 | Ref. 12 |
| N-CDs | 0–150 | 0.5 | Ref. 16 |
| N-GQDs | 1–70 | 0.08 | Ref. 18 |
| CDs | 0.02–40 | 0.13 | Ref. 19 |
| CDs | 0.1–100 | 0.016 | Ref. 23 |
| FNCDs | 2–25 | 0.9 | Ref. 27 |
| S,N-CDs–PBA | 0.3–50 | 0.1 | Ref. 28 |
| GQDs | 0–60 | 0.45 | Ref. 29 |
| CDs | 0.05–10 | 0.0137 | Ref. 31 |
| CDs | 1–78 | 0.54 | This work |
Fluorescence quenching mechanism
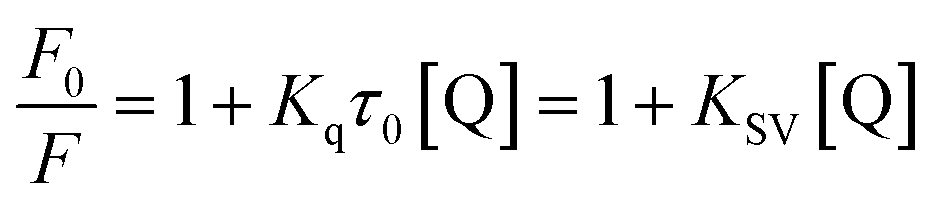
In general, the fluorescence quenching of fluorophores mainly originates from the static or dynamic interaction modes. In the static quenching mechanism, fluorophores and quenchers form a ground-state complex. The coordination or chelation interaction facilitates the partial transfer of excitation-state electrons from the CDs to the half-filled 3d orbit of the central Fe3+ ions, which, therefore, inhibits the radiative transition back to the ground state, quenching the fluorescence of CDs.52 However, in dynamic quenching, the collision interactions between the quencher and excited fluorophores causes the nonfluorescent electrons to transfer from the donor to the acceptor, which, therefore, quenches the fluorescence of fluorophores.62 The fluorescence decay lifetime is recognized as a general criterion to primarily distinguish between static or dynamic pathways.61 From Fig. 5c, the average decay lifetime of CD–Fe3+ (6.3 ns) is almost the same as that of only CDs (6.2 ns), which implies that static quenching occurs between CDs and Fe3+. The UV-vis absorption spectrum was also measured (Fig. S10†); the absorbance of the CD–Fe3+ system substantially increases relative to the initial CD solution, showing high affinity of CDs toward Fe3+. The coordination or chelation interaction causes charge transfer transitions between the ligands and Fe3+, thereby resulting in additional absorbance. Further, this phenomenon evidences the formation of complexes between the CDs and Fe3+ to some extent. To gain further insights into the actual quenching mechanism of the CD–Fe3+ system, the fluorescence emission intensities of the CD–Fe3+ system were analyzed according to Stern–Volmer equation (eqn (1)):63
 | (1) |
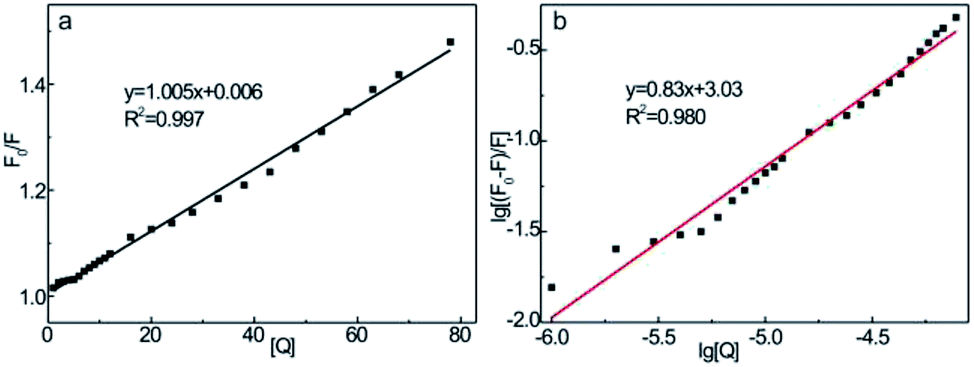 | ||
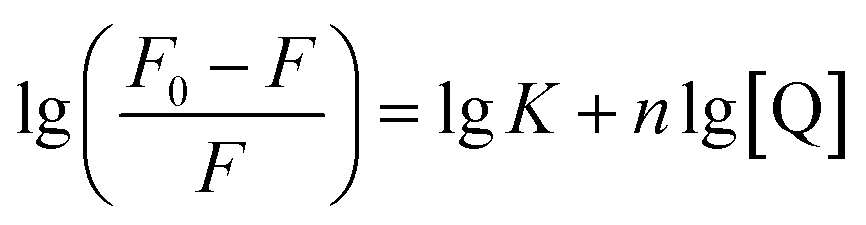
| Fig. 8 (a) Stern–Volmer curves and (b) logarithmic plots of CD–Fe3+ system. CCDs = 250 μg mL−1, CFe3+ concentrations (1, 2, 3, 4, 5, 6, 7, 8, 9, 10, 11, 12, 16, 20, 24, 28, 33, 38, 43, 48, 53, 58, 63, 68, and 78 μmol L−1). | ||
In terms of the static quenching process, the number of binding sites (n) and binding constant (K) can be obtained according to eqn (2):65
 | (2) |
From the linear plots shown in Fig. 8b, K can be determined as 1.08 × 10³ L mol−1 and n = 0.83 (R2 = 0.980). The moderate binding affinity between CDs and Fe3+ ions suggests the formation of a CD–Fe3+ complex, which coincides with the UV-vis and fluorescence lifetime results (Fig. S10† and 5c). Therefore, it is confirmed that the static-energy transfer from CDs to Fe3+ is responsible for the fluorescence quenching of CDs.
Detection of Fe3+ in real water samples and serums
To further verify the practicality of the proposed CD-based fluorescent nanoprobes for Fe3+ detection, Fe3+ in real water samples, including tap water, well water, Muye lake water in Xinxiang city, and serum samples were determined. The water samples were filtrated through a 0.22 μm membrane and directly used as the solvent to prepare a neutral buffer solution to construct a CD–Fe3+-sensing system with known dosages of spiked Fe3+. As shown in Table 2, 90–103.3% of spiked Fe3+ in the water samples can be recovered with low relative standard deviations (0.07–0.37%) through fluorescence emission intensity detection upon six parallel trials, showing the feasibility of the CD fluorescent nanoprobes in the accurate detection of Fe3+ in real water samples. In the case of Fe3+ detection in the serum sample, known dosages of standard Fe3+ solution were spiked in the serum samples and were determined through the CD fluorescent nanoprobe technique. Here, 93.4–103.2% of the added Fe3+ in the serum samples can be recovered with standard deviations of about 0.2%, which reconfirms the applicability of CD fluorescent nanoprobes for precise Fe3+ detection in blood samples. Given the low cost and simplicity in CDs preparation, the high sensitivity and low detection limit Fe3+ analysis; further, the excellent recoveries in Fe3+ detection in actual water samples and human serum, the proposed CD-based fluorescent nanoprobe is a promising candidate for the reliable and accurate detection of Fe3+ in environmental and clinical fields.| Analyte | Medium | Fe3+ concentration (μM) | Recovery (%) | RSD (%, n = 6) | |
|---|---|---|---|---|---|
| Added | Found | ||||
| Fe3+ | Human serum | 0 | 0.42 | ||
| 8 | 7.47 | 93.4 | 0.20 | ||
| 12 | 12.3 | 103.2 | 0.21 | ||
| Fe3+ | Lake water | 0 | 0.35 | ||
| 8 | 7.22 | 90.3 | 0.16 | ||
| 12 | 11.79 | 98.2 | 0.14 | ||
| Fe3+ | Tap water | 0 | 0.38 | ||
| 8 | 7.25 | 90.6 | 0.18 | ||
| 12 | 12.4 | 103.3 | 0.07 | ||
| Fe3+ | Well water | 0 | 0.56 | ||
| 8 | 7.2 | 90.0 | 0.37 | ||
| 12 | 11.8 | 98.3 | 0.18 | ||
Conclusions
In summary, we have demonstrated a facile and low-cost one-step hydrothermal preparation of fluorescent CDs from fish scale precursors. The as-prepared CDs demonstrated high fluorescence activity with QY of 6.9%, low cytotoxicity, and robust resistance against photobleaching and interferents, which enable their applications as fluorescent nanoprobes for the quantitative detection of Fe3+ with high sensitivity and selectivity through coordination and static quenching interactions. These CD-based fluorescent nanoprobes can also be extended toward the detection of Fe3+ in real water samples and human serums with good recoveries, showing the potential as a low-cost reliable fluorescent nanoprobe for environmental and clinical Fe3+ assays.Conflicts of interest
There are no conflicts to declare.Acknowledgements
This work was supported by NSFC (No. 21671059 and 51802084), Program for Innovative Research Groups in University of Henan Province (No. 18IRTSTHN002 and 18IRTSTHN003), 111 Project (No. D17007), Henan Center for Outstanding Overseas Scientists (No. GZS2018003), Scientific and Technological breakthrough project of Xinxiang City (CXGG17001) and Youth Fund of Henan Normal University (2017QK12).Notes and references
- C. Bolm, J. Legros, J. L. Paih and L. Zani, Chem. Rev., 2004, 104, 6217–6254 CrossRef CAS PubMed
.
- Z. Q. Liu, Y. X. Zhang, L. X. Zhao, Z. J. Li, J. T. Wang, H. J. Li and L. M. Wu, Org. Lett., 2011, 13, 2208–2211 CrossRef CAS PubMed
- F. A. Tezcan, J. T. Kaiser, D. Mustafi, M. Y. Walton, J. B. Howard and D. C. Rees, Science, 2005, 309, 1377–1380 CrossRef CAS PubMed
- G. Cairo and A. Pietrangelo, Biochem. J., 2000, 352, 241–250 CrossRef CAS PubMed
- D. Galaris, V. Skiada and A. Barbouti, Cancer Lett., 2008, 266, 21–29 CrossRef CAS PubMed
- W. H. Hörl, J. Am. Soc. Nephrol., 2007, 18, 382–393 CrossRef PubMed
- G. Sucak, Z. Yegin, Z. Özkurt, S. Z. Ak, T. Karakan and G. Akyol, Bone Marrow Transplant., 2008, 42, 461–467 CrossRef CAS PubMed
- S. Altamura and M. U. Muckenthaler, J. Alzheimer's Dis., 2009, 16, 879–895 Search PubMed
- J. Q. Liu, H. B. Shentu, H. Y. Chen, P. Ye, B. Xu, Y. F. Zhang, H. Bastani, H. X. Peng, L. Chen and T. Q. Zhang, Water Res., 2017, 124, 353–362 CrossRef CAS PubMed
- V. Gurnani, A. K. Singh and B. Venkataramani, Anal. Chem., 2003, 485, 221–232 CAS
- E. Wu and E. A. Boyle, Anal. Chem., 1998, 367, 183–191 Search PubMed
- Y. Zhu, D. Pan, X. Hu, H. Han, M. Lin and C. Wang, Sens. Actuators, B, 2017, 243, 1–7 CrossRef CAS
- S. Schaffer, P. Gareil, C. Dezael and D. Richard, J. Chromatogr. A, 1996, 740, 151–157 CrossRef
- J. H. Han, Z. Zhou, X. Bu, S. J. Zhu, H. Zhang, H. Z. Sun and B. Yang, Analyst, 2013, 138, 3402–3408 RSC
- J. Shen, S. M. Shang, X. Y. Chen, D. Wang and Y. Cai, Mater. Sci. Eng., C, 2017, 76, 856–864 CrossRef CAS PubMed
- H. Ding, J. S. Wei and H. M. Xiong, Nanoscale, 2014, 6, 13817–13823 RSC
- C. R. Lohani and K. H. Lee, Sens. Actuators, B, 2010, 143, 649–654 CrossRef CAS
- T. G. Jo, J. M. Jung, J. Y. Han, M. H. Lim and C. Kim, RSC Adv., 2017, 7, 28723–28732 RSC
- M. Q. Yu, Z. G. Zhu, H. Wang, L. Y. Li, F. Fu, Y. Song and E. Q. Song, Biosens. Bioelectron., 2017, 91, 143–148 CrossRef CAS PubMed
- J. J. Jiang, P. F. Gao, Y. Zhang, G. M. Zhang, Y. Zhou, C. Dong and S. M. Shuang, Talanta, 2017, 174, 44–51 CrossRef CAS PubMed
- M. J. Zhou, J. J. Guo and C. X. Yang, Sens. Actuators, B, 2018, 264, 52–58 CrossRef CAS
- P. Wu, Y. Li and X. P. Yan, Anal. Chem., 2009, 81, 6252–6257 CrossRef CAS
- S. N. Baker and G. A. Baker, Angew. Chem., Int. Ed., 2010, 49, 6726–6744 CrossRef CAS PubMed
- S. T. Yang, L. Cao, P. J. G. Luo, F. S. Lu, X. Wang, H. F. Wang, M. J. Meziani, Y. F. Liu, G. Qi and Y. P. Sun, J. Am. Chem. Soc., 2009, 131, 11308–11309 CrossRef CAS PubMed
- J. C. Liu, J. K. Ren, Z. Xie, B. Guan, J. X. Wang, T. Ikeda and L. Jiang, Nanoscale, 2018, 10, 4642–4649 RSC
- S. Y. Liu, N. Zhao, Z. Cheng and H. G. Liu, Nanoscale, 2015, 7, 6836–6842 RSC
- Z. P. Zeng, S. F. Chen, T. T. Y. Tan and F. X. Xiao, Catal. Today, 2018, 315, 171–183 CrossRef CAS
- S. Sahu, B. Behera, T. K. Maiti and S. Mohapatra, Chem. Commun., 2012, 48, 8835–8837 RSC
- H. Huang, Y. Xu, C. J. Tang, J. R. Chen, A. J. Wang and J. J. Feng, New J. Chem., 2014, 38, 784–789 RSC
- V. N. Mehta, S. Jha, H. Basu, R. K. Singhal and S. K. Kailasa, Sens. Actuators, B, 2015, 213, 434–443 CrossRef CAS
- X. Feng, Y. Q. Jiang, J. P. Zhao, M. Miao, S. M. Cao, J. H. Fang and L. Y. Shi, RSC Adv., 2015, 5, 31250–31254 RSC
- B. D. Yin, J. H. Deng, X. Peng, Q. Long, J. N. Zhao, Q. J. Lu, Q. Chen, H. T. Li, H. Tang, Y. Y. Zhang and S. Z. Yao, Analyst, 2013, 138, 6551–6557 RSC
- M. J. Krysmann, A. Kelarakis and E. P. Giannelis, Green Chem., 2012, 14, 3141–3145 RSC
- L. Wang, H. S. Zhou and A. Chem, Anal. Chem., 2014, 86, 8902–8905 CrossRef CAS PubMed
- Z. Y. Gao, X. R. Wang, J. L. Chang, D. P. Wu, L. Wang, X. Liu, F. Xu, Y. M. Guo and K. Jiang, RSC Adv., 2015, 5, 48665–48674 RSC
- S. Y. Park, H. U. Lee, E. S. Park, S. C. Lee, J. W. Lee, S. W. Jeong, C. H. Kim, Y. C. Lee, Y. S. Huh and J. Lee, ACS Appl. Mater. Interfaces, 2014, 6, 3365–3370 CrossRef CAS PubMed
- G. S. Tong, J. X. Wang, R. B. Wang, X. Q. Guo, L. He, F. Qiu, G. Wang, B. S. Zhu, X. Y. Zhu and T. Liu, J. Mater. Chem. B, 2015, 3, 700–706 RSC
- T. Rustad, J. Environ. Agric. Food Chem., 2003, 4, 458–463 Search PubMed
- V. Manikkam, M. L. Mathai, W. A. Street, O. N. Donkor and T. Vasiljevic, Food Res. Int., 2016, 23, 1614–1622 CAS
- X. D. He, H. T. Li, Y. Liu, H. Huang, Z. H. Kang and S. T. Lee, Colloids Surf., B, 2011, 87, 326–332 CrossRef CAS PubMed
- Z. C. Yang, M. Wang, A. M. Yong, S. Y. Wong, X. H. Zhang, H. Tan, A. Y. Chang, X. Li and J. Wang, Chem. Commun., 2011, 47, 11615–11617 RSC
- C. Wang, T. T. Hu, Z. Q. Wen, J. D. Zhou, X. J. Wang, Q. Wu and C. X. Wang, J. Colloid Interface Sci., 2018, 521, 33–41 CrossRef CAS PubMed
- S. Sahu, B. Behera, T. K. Maiti and S. Mohapatra, Chem. Commun., 2012, 48, 8835–8837 RSC
- Y. P. Hu, J. Yang, J. W. Tian, L. Jia and J. S. Yu, Carbon, 2014, 77, 775–782 CrossRef CAS
- H. B. Xu, S. H. Zhou, L. L. Xiao, H. H. Wang, S. Z. Li and Q. H. Yuan, J. Mater. Chem. C, 2015, 3, 291–297 RSC
- T. T. Xu, J. X. Yang, J. M. Song, J. S. Chen, H. L. Niu, C. J. Mao, S. Y. Zhang and Y. H. Shen, Sens. Actuators, B, 2017, 243, 863–872 CrossRef CAS
- W. Liu, H. P. Diao, H. H. Chang, H. J. Wang, T. T. Li and W. L. Wei, Sens. Actuators, B, 2017, 241, 190–198 CrossRef CAS
- Y. B. Wang, Q. Chang and S. L. Hu, Sens. Actuators, B, 2017, 253, 928–933 CrossRef CAS
- Y. Zhang, Z. Y. Gao, W. Q. Zhang, W. Wang, J. L. Chang and J. Kai, Sens. Actuators, B, 2018, 262, 928–937 CrossRef CAS
- S. Liu, J. Q. Tian, L. Wang, Y. W. Zhang, X. Y. Qin, Y. L. Luo, A. M. Asiri, A. O. Al-Youbi and X. P. Sun, Adv. Mater., 2012, 24, 2037–2041 CrossRef CAS PubMed
- P. J. S. Rana, P. Singh and P. Kar, J. Mater. Chem. B, 2016, 4, 5929–5937 RSC
- G. Gao, Y. W. Jiang, H. R. Jia, J. J. Yang and F. G. Wu, Carbon, 2018, 134, 232–243 CrossRef CAS
- B. F. Shi, Y. B. Su, L. L. Zhang, M. J. Huang, R. J. Liu and S. L. Zhao, ACS Appl. Mater. Interfaces, 2016, 8, 10717–10725 CrossRef CAS PubMed
- Y. H. Yang, J. H. Cui, M. T. Zheng, C. F. Hu, S. Z. Tan, Y. Xiao, Q. Yang and Y. L. Liu, Chem. Commun., 2012, 48, 380–382 RSC
- M. J. Krysmann, A. Kelarakis, P. Dallas and E. P. Giannelis, J. Am. Chem. Soc., 2012, 134, 747–750 CrossRef CAS PubMed
- R. Atchudan, T. N. J. I. Edison, K. R. Aseer, S. Perumal, N. Karthik and Y. R. Lee, Biosens. Bioelectron., 2018, 99, 303–311 CrossRef CAS PubMed
- Y. P. Sun, B. Zhou, Y. Lin, W. Wang, K. A. S. Fernando, P. Pathak, M. J. Meziani, B. A. Harruff, X. Wang, H. F. Wang, P. G. Luo, H. Yang, M. E. Kose, B. L. Chen, L. M. Veca and S. Y. Xie, J. Am. Chem. Soc., 2006, 128, 7756–7757 CrossRef CAS PubMed
- C. J. Li, Y. Q. Wang, X. J. Zhang, X. L. Guo, X. X. Kang, L. B. Du and Y. Liu, J. Colloid Interface Sci., 2018, 526, 487–496 CrossRef CAS PubMed
- X. W. Zhu, Z. Zhang, Z. J. Xue, C. H. Huang, Y. Shan, C. Liu, X. Y. Qin, W. S. Yang, X. Chen and T. Wang, Anal. Chem., 2017, 89, 12054–12058 CrossRef CAS PubMed
- C. X. Wang, Y. J. Huang, K. L. Jiang, M. G. Humphrey and C. Zhang, Analyst, 2016, 141, 4488–4494 RSC
- M. Shamsipur, K. Molaei, F. Molaabasi, M. Alipour, N. Alizadeh, S. Hosseinkhani and M. Hosseini, Talanta, 2018, 183, 122–130 CrossRef CAS PubMed
- T. Madrakian, S. Maleki, S. Gilak and A. Afkhami, Sens. Actuators, B, 2017, 247, 428–435 CrossRef CAS
- G. F. Shen, T. T. Liu, Q. Wang, M. Jiang and J. H. Shi, J. Photochem. Photobiol., B, 2015, 153, 380–390 CrossRef CAS PubMed
- Y. H. Liu, W. X. Duan, W. Song, J. J. Liu, C. L. Ren, J. Wu, D. Liu and H. L. Chen, ACS Appl. Mater. Interfaces, 2017, 9, 12663–12672 CrossRef CAS PubMed
- Y. S. Yuan, J. Jiang, S. P. Liu, J. D. Yang, H. Zhang, J. J. Yan and X. L. Hu, Sens. Actuators, B, 2017, 242, 545–553 CrossRef CAS
Footnote |
| † Electronic supplementary information (ESI) available: Fig. S1–S10. See DOI: 10.1039/c8ra09471c |
| This journal is © The Royal Society of Chemistry 2019 |