 Open Access Article
Colloidal CdxZn1−xS nanocrystals as efficient photocatalysts for H2 production under visible-light irradiation†
JingJing Xiang,
Hanbin Wang *,
Xina Wang,
Xu Chen,
Tianci Wu,
Houzhao Wan,
Yongzheng Liu and
Hao Wang
 *
*
Hubei Collaborative Innovation Center for Advanced Organic Chemical Materials, Faculty of Physics and Electronic Science, Hubei University, Wuhan, 430062, China. E-mail: 123272314@qq.com; nanoguy@126.com
First published on 30th January 2019
Abstract
CdxZn1−xS nanocrystals with sizes ranging from 3–11 nm were synthesized by a simple organic solution method. The nanocrystals possess a cubic zinc-blende structure and the bandgap blue-shifts from 2.1 eV to 3.4 eV by increasing the composition of Zn ions in the solid solutions. After a facile ligand exchange process, the photocatalytic activity for H2 production of the CdxZn1−xS nanocrystals was investigated under visible-light irradiation (λ ≥ 420 nm) with Na2SO3/Na2S as the electron donor. It was found that the Cd0.8Zn0.2S had the highest photoactivity with H2 evolution rate of 6.32 mmol g−1 h−1. By in situ adding Pt precursors into the reaction solution, inhomogenous Pt–CdxZn1−xS nanoheterostructures were formed, which accounted for a 30% enhancement for the H2 evolution rate comparing with that of pure Cd0.8Zn0.2S nanocrystals. This work highlights the use of facile organic synthesis in combination with suitable surface modification to enhance the activity of the photocatalysts.
Introduction
Hydrogen, as a clean and renewable fuel, occupies an important position in the research of future energy. The mass production of hydrogen by traditional stream reforming process is uneconomical and nonrenewable while photocatalytic water splitting methods have shown great potential for the production of hydrogen in a clean, sustainable and economic manner.1–3 To make full use of solar energy, numerous visible-light-driven photocatalysts have been developed among which CdS has attracted intensive study. However, CdS always suffers from photocorrosion in catalytic reactions and alloying CdS with other metal sulfides such as ZnS, In2S3 and MnS is effective to enhance its activity as well as stability.4–7 In this regard, CdxZn1−xS solid solutions have been extensively studied due to their controllable band structure and better activity.8,9 So far, CdxZn1−xS nanostructures with various morphologies and structures were synthesized and high photoactivity was obtained in solid solutions with special compositions. For example, volvox-like CdxZn1−xS was synthesized through a template-free ethylene glycol process and Cd0.57Zn0.43S nanospheres showed the highest activity with a hydrogen production rate of 1.76 mmol g−1 h−1.10 A hybrid structure of Cd0.5Zn0.5S quantum dots on 2D graphitic carbon nitride were synthesized by an in situ growth hydrothermal method. The composites exhibited the highest H2 generation rate of 33.41 mmol g−1 h−1 under visible irradiation.11 The graphene–ZnCdS composites were prepared by hydrothermal method and the highest H2 production value of 1.06 mmol g−1 h−1 was achieved on 0.5 wt% graphene loaded Zn0.5Cd0.5S sample.12 Zn0.5Cd0.5S solid solutions with zinc blende/wurtzite (ZB/WZ) twin-induced crystal structure were reported by some groups and the type-II staggered band alignment between the ZB and WZ segments greatly improved the charge separation process in hydrogen production.13–15There have been many reports on Cd1−xZnxS solid solutions for photocatalytic H2 production under visible-light irradiation. In most previous work, the synthetic protocols often involved with solvothermal and hydrothermal methods. On the other hand, the organic solution synthesis (including hot injection method) has emerged as a potential route for efficient photocatalysts. The high temperature synthesis in the chelating regents favors the formation of crystals with good crystallinity and well-controlled size, two of which are critical factors determining the photoactivity of the catalysts. There still limit reports on the organic solution route for high-efficient photocatalysts. For example, monodispersive Cu2ZnSnS4 nanoparticles were fabricated by a colloidal method and after Pt loading the Pt–Cu2ZnSnS4 nanoheterostructures showed the highest H2 evolution rate of 1.02 mmol g−1 h−1.16 The CuGaS2–ZnS heterostructures were synthesized by an organic solution route, and after surface modification the rate of hydrogen production was measured to be 750 μmol g−1 h−1 under visible light.17 In most of the organic synthesis, the photocatalysts suffered from low yield and complicated operation, and these drawbacks should be fully addressed to extend their capability in the exploit of green energy materials.
In the present work, a convenient organic solution method was employed to synthesize zinc-blende structured Cd1−xZnxS nanocrystals (NCs) with size ranging from 3 nm to 11 nm. The bandgap of Cd1−xZnxS solid solutions was easily tuned by changing their composition and the photocatalytic activity of the nanocrystals was investigated after a ligand exchanging process. It was shown that the Cd0.8Zn0.2S sample possessed the highest activity with H2 production rate of 6.32 mmol g−1 h−1. After directly reducing 2 wt% Pt precursors in the reaction solution, inhomogeneous Pt–Cd0.8Zn0.2S nanoheterostructures were formed, which accounted for 30% enhancement for the H2 evolution rate comparing with that of pure Cd0.8Zn0.2S NCs. The work highlights the use of facile organic synthesis cooperated with suitable surface modification to hence the activity of the semiconductors.
Experimental
Synthetic procedures
Firstly, a certain amount of Cd(CH3COO)2 and Zn(CH3COO)2 was dissolved in 30 mL oleylamine in a 100 mL three-necked flask. The molar ratio of Cd![[thin space (1/6-em)]](https://www.rsc.org/images/entities/char_2009.gif) :
:![[thin space (1/6-em)]](https://www.rsc.org/images/entities/char_2009.gif) Zn was tuned by changing the amount of Cd(CH3COO)2 and Zn(CH3COO)2 while the total molar of Cd + Zn precursors remained constant. The mixed solution was magnetically stirred and heated to 140 °C under the protection of N2, then 10 mL of 0.4 M sulfur solution in oleylamine was poured into the Cd(CH3COO)2 + Zn(CH3COO)2 solution. The mixture was heated from 140 °C to 280 °C for 1 h with heating rate of 5 °C min−1. After the reaction, CdxZn1−xS nanocrystals were formed and cooled to room temperature. The precipitates were washed with 50 mL of ethanol for three times to remove the redundant oleylamine and by-products. The yellow or orange products were dispersed in hexane. For the preparation of Pt–CdxZn1−xS nanoheterostructures, a small quantity of Pt(acac)2 was added into the CdxZn1−xS solution in oleylamine at 140 °C and heated to 280 °C again for 30 min. The products were cleaned following the washing process of CdxZn1−xS.
Zn was tuned by changing the amount of Cd(CH3COO)2 and Zn(CH3COO)2 while the total molar of Cd + Zn precursors remained constant. The mixed solution was magnetically stirred and heated to 140 °C under the protection of N2, then 10 mL of 0.4 M sulfur solution in oleylamine was poured into the Cd(CH3COO)2 + Zn(CH3COO)2 solution. The mixture was heated from 140 °C to 280 °C for 1 h with heating rate of 5 °C min−1. After the reaction, CdxZn1−xS nanocrystals were formed and cooled to room temperature. The precipitates were washed with 50 mL of ethanol for three times to remove the redundant oleylamine and by-products. The yellow or orange products were dispersed in hexane. For the preparation of Pt–CdxZn1−xS nanoheterostructures, a small quantity of Pt(acac)2 was added into the CdxZn1−xS solution in oleylamine at 140 °C and heated to 280 °C again for 30 min. The products were cleaned following the washing process of CdxZn1−xS.
Ligand exchange procedure
The above nanocrystals should be dissolved in water for photocatalytic H2 production. The hydrophobic surface of particles is converted to hydrophilic surface by a simple ligand exchange procedure. In detail, 15 mL of CdxZn1−xS/Pt–CdxZn1−xS solutions in hexane were adding 10 mL 3-MPA and the mixture was stirred for 10 hours. Ligand exchange was completed as yellow particles were transferred from dispersing in hexane to dispersing in water. After the upper hexane was removed the nanocrystals were precipitated by centrifugation at 3000 rpm and further washed with alcohol for two times and with deionised water for one time. The final products were dried at 70 °C for 2 h in a vacuum oven.Photocatalytic H2 generation and EIS measurements
For the photocatalytic experiments, 50 mg of CdxZn1−xS powder was dispersed in 100 mL of deionised water, with 0.25 M Na2S and 0.35 M Na2SO3 as hole scavengers. A 300 W halogen lamp with a cutoff filter (>420 nm, Newport) was used to irradiate the samples. Photocatalytic reaction was conducted in a quartz reactor under continuous magnetic stirring (1500 rpm) during light irradiation. The irradiation intensity was measured to be 300 mW cm−2 by optical power meter at 20 °C. The amount of evolved hydrogen was analysed by online gas chromatograph (GC-2014C, Shimadzu, TCD and 5 Å molecular sieve column). The electrochemical impedance spectroscopy (EIS) measurements were conducted by electrochemical analyzer. The working electrode were made by blade-coating the photocatalysts onto FTO substrates and sintering at 400 °C for 30 min. A platinum sheet was used as the counter electrode while an Ag/AgCl electrode as reference in a standard three-electrode system. The EIS data were analysed with Zview software. The EIS frequency ranged from 0.1 to 100![[thin space (1/6-em)]](https://www.rsc.org/images/entities/char_2009.gif) 000 Hz, and the alternating current signal amplitude was 10 mV.
000 Hz, and the alternating current signal amplitude was 10 mV.
Characterization techniques
The structural and composition characterizations of the CdxZn1−xS NCs were analysed by transmission electron microscopy (TEM, JEM-2100F) equipped with energy dispersive spectroscopy (EDS). Elemental analysis was also carried out on an X-ray fluorescence spectrum (XRF, XRF1800). The phase of the CdxZn1−xS solid solutions was identified by X-ray diffraction (XRD, Bruker D8) with Cu Kα1 radiation. The UV-Vis absorption spectra of the samples were recorded by UV-Vis spectrophotometer (UV-3600, Shimadzu). BET specific surface areas were measured through the nitrogen adsorption–desorption isotherms on a micrometrics ASAP 2020 M apparatus.Results and discussion
Crystalline phase and structures
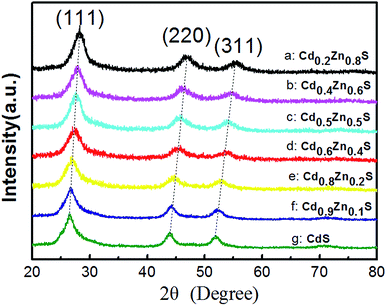
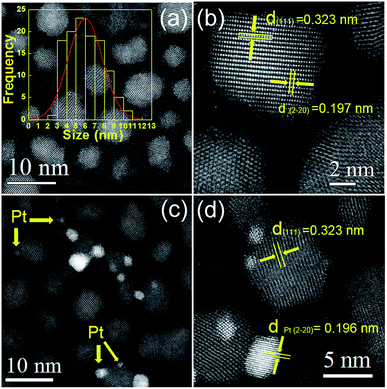
Fig. 1 shows the XRD patterns of as-synthesized CdxZn1−xS photocatalysts. All the samples are identified as cubic zinc-blende phase, of which the three main diffraction peaks, such as (111), (220) and (311) are observed. The diffraction peaks of CdxZn1−xS photocatalysts shift to lower angles as the value of x increase, indicating the formation of single-phase CdxZn1−xS solid solutions. The average nanocrystal size was ranging from 3.8–12.2 nm according to the Debye–Scherrer equation, indicating that the oleylamine provided a strong coordinate environment to restrict the crystal growth of CdxZn1−xS. The bonding characteristics of the CdxZn1−xS NCs were characterized by X-ray photoelectron spectroscopy (XPS). Fig. S1† shows the XPS spectra of the Zn 2p3/2 and Cd 3d5/2 peaks located at 1021.6 eV and 404.5 eV respectively, indicating that Zn and Cd ions exist in the 2+ formal oxidation state in a S2− surrounding environment.18The microstructures of the nanocrystals were analyzed by STEM with high-angle annular dark field (HAADF) mode. It's known that in HAADF image, the heavy elements show brighter contrast compared with the light elements due to different Z contrast. Such advantages help to distinguish noble metal cocatalysts onto the CdxZn1−xS NCs and additionally, provide higher contrast between the CdxZn1−xS NCs and carbon film. The HADDF image of pure CdxZn1−xS NCs was shown in Fig. 2a. Single-crystalline CdxZn1−xS particles with size between 3 nm to 11 nm were well-dispersed on carbon film. The HRTEM images of several CdxZn1−xS nanoparticles are shown in Fig. 2b. The clear lattice fringe of the single particles reveals the good crystallization of the samples. The labeled inter-fringe distance is measured to be 0.323 nm and 0.197 nm, respectively, matching well with the (111) and (2−20) lattice spacing of CdxZn1−xS solid solution with cubic phase. The composition of the CdxZn1−xS samples was analyzed by EDS and XRF and in comparison with the stoichiometric ratio of the precursors. As listed by Table 1, the Cd/Zn ratio determined by EDS are slightly lower than those of precursors, while the Cd![[thin space (1/6-em)]](https://www.rsc.org/images/entities/char_2009.gif) :
:![[thin space (1/6-em)]](https://www.rsc.org/images/entities/char_2009.gif) Zn ratio determined by XRF were more close to their stoichiometric composition. There exists slight deviation between the bulk elemental composition (XRF) and surface elemental composition (EDX). Besides of the measuring error of the instruments, such deviation may be associated with the formation mechanism of the CdxZn1−xS nanocrystals. It was inferred that in organic solvents the Cd-rich cores were initially formed due to higher reactivity of Cd than Zn toward S. Then the Zn-rich outer layers were gradual formed on the Cd-rich core because of the rapid depletion of the Cd concentration in the reaction medium.19,20 Such formation mechanisms lead to the excess of Zn in the exterior of the CdxZn1−xS. Since EDX technology tends to obtain surface elemental composition of the materials, the ratio of Cd
Zn ratio determined by XRF were more close to their stoichiometric composition. There exists slight deviation between the bulk elemental composition (XRF) and surface elemental composition (EDX). Besides of the measuring error of the instruments, such deviation may be associated with the formation mechanism of the CdxZn1−xS nanocrystals. It was inferred that in organic solvents the Cd-rich cores were initially formed due to higher reactivity of Cd than Zn toward S. Then the Zn-rich outer layers were gradual formed on the Cd-rich core because of the rapid depletion of the Cd concentration in the reaction medium.19,20 Such formation mechanisms lead to the excess of Zn in the exterior of the CdxZn1−xS. Since EDX technology tends to obtain surface elemental composition of the materials, the ratio of Cd![[thin space (1/6-em)]](https://www.rsc.org/images/entities/char_2009.gif) :
:![[thin space (1/6-em)]](https://www.rsc.org/images/entities/char_2009.gif) Zn by EDX measurement is reasonably lower than the stoichiometric ratio.
Zn by EDX measurement is reasonably lower than the stoichiometric ratio.
| Sample | Precursor composition of CdxZn1−xS | Cd/Zn atomic ration | BET surface area (m2 g−1) | |
|---|---|---|---|---|
| XRF ratio | EDS ratio | |||
| a | Cd0.2Zn0.8S | 1.86![[thin space (1/6-em)]](https://www.rsc.org/images/entities/char_2009.gif) : :![[thin space (1/6-em)]](https://www.rsc.org/images/entities/char_2009.gif) 8.14 8.14 |
1.9![[thin space (1/6-em)]](https://www.rsc.org/images/entities/char_2009.gif) : :![[thin space (1/6-em)]](https://www.rsc.org/images/entities/char_2009.gif) 8.1 8.1 |
89.5 |
| b | Cd0.4Zn0.6S | 3.77![[thin space (1/6-em)]](https://www.rsc.org/images/entities/char_2009.gif) : :![[thin space (1/6-em)]](https://www.rsc.org/images/entities/char_2009.gif) 6.23 6.23 |
3.9![[thin space (1/6-em)]](https://www.rsc.org/images/entities/char_2009.gif) : :![[thin space (1/6-em)]](https://www.rsc.org/images/entities/char_2009.gif) 6.1 6.1 |
95.8 |
| c | Cd05Zn0.5S | 4.91![[thin space (1/6-em)]](https://www.rsc.org/images/entities/char_2009.gif) : :![[thin space (1/6-em)]](https://www.rsc.org/images/entities/char_2009.gif) 5.09 5.09 |
4.8![[thin space (1/6-em)]](https://www.rsc.org/images/entities/char_2009.gif) : :![[thin space (1/6-em)]](https://www.rsc.org/images/entities/char_2009.gif) 5.2 5.2 |
113.3 |
| d | Cd0.6Zn0.4S | 6.31![[thin space (1/6-em)]](https://www.rsc.org/images/entities/char_2009.gif) : :![[thin space (1/6-em)]](https://www.rsc.org/images/entities/char_2009.gif) 3.69 3.69 |
5.6![[thin space (1/6-em)]](https://www.rsc.org/images/entities/char_2009.gif) : :![[thin space (1/6-em)]](https://www.rsc.org/images/entities/char_2009.gif) 4.4 4.4 |
109.0 |
| e | Cd0.8Zn0.2S | 8.34![[thin space (1/6-em)]](https://www.rsc.org/images/entities/char_2009.gif) : :![[thin space (1/6-em)]](https://www.rsc.org/images/entities/char_2009.gif) 1.64 1.64 |
7.3![[thin space (1/6-em)]](https://www.rsc.org/images/entities/char_2009.gif) : :![[thin space (1/6-em)]](https://www.rsc.org/images/entities/char_2009.gif) 2.7 2.7 |
122.5 |
| f | Cd0.9Zn0.1S | 9.20![[thin space (1/6-em)]](https://www.rsc.org/images/entities/char_2009.gif) : :![[thin space (1/6-em)]](https://www.rsc.org/images/entities/char_2009.gif) 0.80 0.80 |
8.7![[thin space (1/6-em)]](https://www.rsc.org/images/entities/char_2009.gif) : :![[thin space (1/6-em)]](https://www.rsc.org/images/entities/char_2009.gif) 1.3 1.3 |
115.7 |
The HAADF images of the 2 wt% Pt–CdxZn1−xS were also presented in Fig. 2. It's interesting to observe inhomogeneous metal–semiconductor heterostructures among many bare CdxZn1−xS NCs. As shown by Fig. 2c and d, Pt nanoparticles with size between 1 to 5 nm attached tightly with bigger CdxZn1−xS particles, forming typical metal–semiconductor heterostructures. Such architectures are different from those fabricated by two step colloidal approaches,21 implying inhomogeneous deposition of Pt atoms on the CdxZn1−xS surface with high surface energy. The Pt nanoparticles in the heterostructures have larger size compared with those fabricated by photoreduction methods. Traditional photoreduction of H2PtCl6 could result small Pt nanoparticles or clusters on photocatalysts. However, the loose interface by chemical adsorption may create a space barrier between Pt and semiconductors, which hinders the directional migration of electrons between them. In contrast, the separation the photogenerated carriers would be more efficient in nanoheterostructures due to the tightly bonded metal–semiconductor interface.16 It should note that our experiments adopted a convenient procedure to form Pt–CdxZn1−xS heterostructures and such synthetic protocols might benefit to yield hetero-structured photocatalysts in a cheap and simple way.
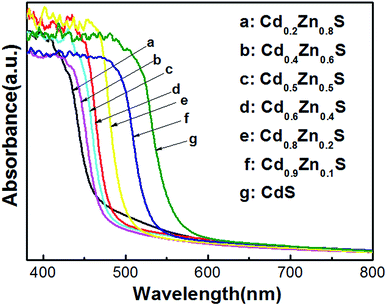
The diffuse UV-visible absorption spectra of CdxZn1−xS photocatalysts were plotted in Fig. 3. The absorption edges of the as-synthesized CdxZn1−xS photocatalysts obviously red-shifted as the ratio of Cd/Zn increased, indicated the atomic level incorporation between CdS and ZnS components. Tauc equation was used to estimate the band gap of the samples by plotting (αhν)2 as a function of hν.22 The bandgap pure CdS and ZnS nanocrystals were calculated to be 2.10 eV and 3.4 eV, respectively, being consistent with those fabricated by solvothermal or hydrothermal methods.10,23 As will be shown in following part, the optimal photoactivity of the solid solutions was achieved on sample Cd0.8Zn0.2S with bandgap of 2.43 eV, suggesting that it possessed optimized conduction band level and band gap among the samples.
The BET surface area of the CdxZn1−xS NCs after ligand exchange were measured by nitrogen adsorption–desorption method. As given in Table 1, the surface areas of the nanocrystals were in the range of 89.5–122.5 m2 g−1, with the Cd0.8Zn0.2S sample showed the largest value. Such high surface area is in accordance with the small size of the CdxZn1−xS NCs, which offer a convenient path for the diffusion of photogenerated carriers and provide more active sites for efficient photocatalytic reaction.
Photocatalytic activity
Before photocatalytic measurement, the hydrophilic surface of CdxZn1−xS NCs was converted into hydrophobic surface by a ligand-exchange process. Such process was achieved via replacing the amino ligand (NH2) of oleylamine by thiol ligand of 3-MPA. The scheme in Fig. 4 illustrates the ligand-exchange process of oleylamine-capped CdxZn1−xS nanocrystals by using thiol ligands (3-MPA). As shown in Fig. 4, the as-prepared CdxZn1−xS and Pt–Cd0.8Zn0.2S nanocrystals dispersed well in hexane and were soluble in water after thiol ligands exchange.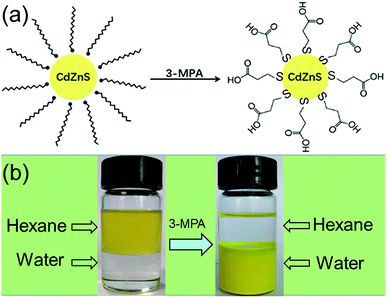 | ||
| Fig. 4 (a) Scheme illustrating the ligand exchange of oleylamine-capped CdZnS nanoparticles using 3-MPA; (b) photograph of Cd0.8Zn0.2S solutions before and after ligand exchange using 3-MPA. | ||
The photocatalytic reactions occurred in the Na2S/Na2SO3 sacrificial electron donor system can be expressed as following:23
| CdxZn1−xS + hν → e− + h+ | (1) |
| 2H2O + 2e− → H2 + 2OH− | (2) |
| 2S2− + 2h+ → S22− | (3) |
| S22− + SO32− → S2O32− + S2− | (4) |
| SO32− + S2− + 2h+ → S2O32− | (5) |
Therefore, the overall reaction of the photocatalytic system can be expressed by eqn (6).
| SO32− + S2− + 2H2O− → H2 + 2OH− + S2O32− | (6) |
The photocatalytic hydrogen production activity was measured under visible light in Na2S/Na2SO3 aqueous solution. As displayed in the Fig. 5a, the photocatalytic activity gradually enhances with increase of x values at the initial stage and reached the maximum of 6.32 mmol g−1 h−1 for Cd0.8Zn0.2S. This value is higher than our previous work on Cd0.5Zn0.5S solid solutions synthesized in ethylene glycol.24 Further increase of Cd content suppressed the hydrogen production of the CdxZn1−xS solid solutions. Pure CdS nanocrystals only yield a hydrogen evolution rate of 1.79 mmol g−1 h−1, demonstrating that alloying with ZnS is effective for the improvement of catalytic activity. The stability of the photocatalysts were tested in the experiments. Fig. S2† shows the results of the four-cycle test runs of the Cd0.8Zn0.2S sample with the same conditions from Fig. 5. It's found that the curves of H2 production rate of the photocatalysts are linear and no obvious decrease is observed for the photoactivity of the sample. This confirms the good stability for the samples during the photocatalytic reaction.
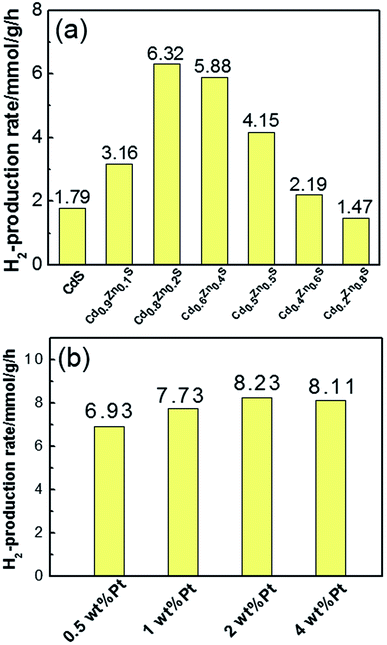 | ||
| Fig. 5 (a) Comparison of H2 production rates of CdxZn1−xS photocatalysts with different x value; (b) the H2 production rates of Pt–Cd0.8Zn0.2S nanocrystals with different Pt content. | ||
Fig. 5b shows the H2 evolution rate of Pt–Cd0.8Zn0.2S NCs with different Pt content. After loading 1 wt% Pt on Cd0.8Zn0.2S nanocrystals, the H2 evolution rate increased to 7.73 mmol g−1 h−1. As 2 wt% Pt was loaded on Cd0.8Zn0.2S nanocrystals the H2 evolution rate reached the highest value of 8.23 mmol g−1 h−1, which was increased by 30% compared with that of pure Cd0.8Zn0.2S nanocrystals. Further increase the content of Pt to 4 wt% the H2 evolution rate reduced slightly to 8.11 mmol g−1 h−1. Such decrease in photoactivity are probably caused by two factors. First, the loading of excessive Pt precursors led to independent nucleation of Pt atoms in oleylamine, which had not contribution to the photoactivity. Second, the free and attached Pt nanoparticles had optical shield effects on CdxZn1−xS NCs since they could scatter or absorb incident light,25 thus decreased the number of photons absorbed by CdxZn1−xS NCs. In a comparison experiment, Pt (2 wt%) was photodeposited in situ on the MPA-3 capped CdxZn1−xS nanocrystals from the precursor of H2PtCl6. The improvement of H2 production rate was measured to be 12% compared with pure Cd0.8Zn0.2S sample, suggesting the inefficient contact of Pt and Cd0.8Zn0.2S nanocrystals by this method.
It was found that the H2 production rate of the CdxZn1−xS decreased as the samples were over-cleaned by ethanol and water. This implies that the loss of 3-MPA molecules influences the activity of CdxZn1−xS NCs. The effects of 3-MPA-capping on sulfides nanoparticles were studied by some reports. For instance, Jeong et al. conducted a series of electrical and optical measurements on MPA-treated PbS quantum dot films and demonstrated that 3-MPA capping could result in low densities of midgap states in PbS, which facilitate charge collection over relatively long distances outside the depletion region.26 It was also reported that 3-MPA was beneficial to prevent the recombination of electron and hole at surface sites of quantum dots and the aggregation via steric hindrance.27,28 Based on these observations, it's inferred that the capping of 3-MAP molecules have positive effects on the activity of CdxZn1−xS NCs since it might promote charge collection and transport processes in semiconductors, accelerating H2 evolution in the photocatalytic reaction. Such mechanisms have been confirmed in the development of quantum-dot-based solar cells (QDSCs). For example, high conversion efficiency was achieved on ZnCuInSe and CdSe cosensitized QDSCs with 3-MPA serving as an anchor to bind QDs to TiO2 surface.29 The 3-MPA capped ZnCuInS based QDSCs exhibited good photovoltaic performance and the presence of 3-MPS molecules suppress charge recombination and accelerate electron injection from QD to TiO2.30
To further investigate the role of heterostructures on the charge separation process of CdxZn1−xS NCs, the electrode charge-transfer properties of the Pt–CdxZn1−xS samples were studied by EIS. Shown in Fig. 6 are the EIS Nyquist plots and simulated equivalent-circuit of the Cd0.8Zn0.2S, 1 wt% and 2 wt% Pt–Cd0.8Zn0.2S films, respectively. The Rt of the Cd0.8Zn0.2S film has the largest value of 90![[thin space (1/6-em)]](https://www.rsc.org/images/entities/char_2009.gif) 990 Ω cm2 and the values of 1 wt% and 2 wt% Pt–Cd0.8Zn0.2S films were fitted to be 79
990 Ω cm2 and the values of 1 wt% and 2 wt% Pt–Cd0.8Zn0.2S films were fitted to be 79![[thin space (1/6-em)]](https://www.rsc.org/images/entities/char_2009.gif) 803 and 60551 Ω cm2, respectively. The smaller Rt value indicated that the electron–hole pairs in the Pt–Cd0.8Zn0.2S heterostructures possessed faster separation and transfer rate than that of Cd0.8Zn0.2S.31,32 The tendency is in line with the photoactivity of the samples, confirming the formation of Pt–CdxZn1−xS nanoheterostructures enhance the activity of CdxZn1−xS NCs. In such structures the Schottky barrier in the Pt–CdxZn1−xS interface promoted the photoexcited electron–hole pair separation and reduced the activation potentials for H2 evolution. As a result, the activity of the photocatalysts was improved. It is noteworthy that the activity improvement is not as novel as other photocatalysts do after Pt loading.33 Such difference could be understood based on the microstructures of the photocatalysts. On one hand the 3-MPA capped Cd0.8Zn0.2S NCs already have abundant hydrogen reactive sites at the surface. On the other hand only a part of CdxZn1−xS NCs in sample were successfully incorporation with Pt nanoparticle. These two factors finally contributed to limit increase for the activity of the Cd0.8Zn0.2S samples.
803 and 60551 Ω cm2, respectively. The smaller Rt value indicated that the electron–hole pairs in the Pt–Cd0.8Zn0.2S heterostructures possessed faster separation and transfer rate than that of Cd0.8Zn0.2S.31,32 The tendency is in line with the photoactivity of the samples, confirming the formation of Pt–CdxZn1−xS nanoheterostructures enhance the activity of CdxZn1−xS NCs. In such structures the Schottky barrier in the Pt–CdxZn1−xS interface promoted the photoexcited electron–hole pair separation and reduced the activation potentials for H2 evolution. As a result, the activity of the photocatalysts was improved. It is noteworthy that the activity improvement is not as novel as other photocatalysts do after Pt loading.33 Such difference could be understood based on the microstructures of the photocatalysts. On one hand the 3-MPA capped Cd0.8Zn0.2S NCs already have abundant hydrogen reactive sites at the surface. On the other hand only a part of CdxZn1−xS NCs in sample were successfully incorporation with Pt nanoparticle. These two factors finally contributed to limit increase for the activity of the Cd0.8Zn0.2S samples.
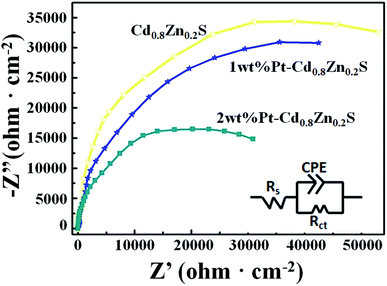 | ||
| Fig. 6 The EIS Nyquist plots and equivalent circuit of the Cd0.8Zn0.2S, 1 wt% and 2 wt% Pt–Cd0.8Zn0.2S films. | ||
Conclusions
CdxZn1−xS nanocrystals with size ranging from 3–11 nm were synthesized in oleylamine at 280 °C by using Cd(CH3COO)2 and Zn(CH3COO)2 as the metal precursors and Na2S as the sulfur source. The hydrophilic surface of CdxZn1−xS NCs was converted into hydrophobic surface by using 3-MPA as the ligand-exchange regent. It was found that CdxZn1−xS NCs with the x value of 0.8 showed the highest photocatalytic H2 production rate (6.32 mmol g−1 h−1) under visible light. The formation of Pt–CdxZn1−xS heterostructures were achieved by in situ adding of Pt(acac)2 into the reaction solution and the 2 wt% Pt–Cd0.8Zn0.2S sample reached the highest H2 evolution rate (8.23 mmol g−1 h−1). The high activity of the photocatalysts were attributed to the small size, good crystallite as well as 3-MPA capping of the nanocrystals. The simple and cheap method for colloidal metal–semiconductors heterostructures in our work provides a new insight for photocatalytic hydrogen production from water splitting.Conflicts of interest
There are no conflicts to declare.Acknowledgements
The authors acknowledge financial support from Hubei Provincial Department of Education (No. D20171006).Notes and references
- H. Ahmad, S. K. Kamarudin, L. J. Minggu and M. Kassim, Renewable Sustainable Energy Rev., 2015, 43, 599–610 CrossRef CAS.
- S. Chen, S. S. Thind and A. Chen, Electrochem. Commun., 2016, 63, 10–17 CrossRef CAS.
- S. Chen, T. Takata and K. Domen, Nat. Rev. Mater., 2017, 2, 17050–17067 CrossRef CAS.
- Q. Li, X. Li, S. Wageh, A. A. Al-Ghamdi and J. Yu, Adv. Energy Mater., 2015, 5, 1500010–1500038 CrossRef.
- Y. Huang, Y. Liu, D. Zhu, Y. Xin and B. Zhang, J. Mater. Chem. A, 2016, 4, 13626–13635 RSC.
- S. B. Wang, B. Y. Guan, Y. Lu and X. W. D. Lou, J. Am. Chem. Soc., 2017, 139, 17305–17308 CrossRef CAS PubMed.
- W. Y. Lim and M. H. G. W. Ho, Dalton Trans., 2015, 44, 10991–10996 RSC.
- D. Dai, H. Xu, L. Ge, C. Han, Y. Gao, S. Li and Y. Lu, Appl. Catal., B, 2017, 217, 429–436 CrossRef CAS.
- H. L. Guo, H. Du, Y. F. Jiang, N. Jiang, C. C. Shen, X. Zhou, Y. N. Liu and A. W. Xu, J. Phys. Chem. C, 2016, 121, 107–114 CrossRef.
- H. Zhou, Q. Liu, W. Liu, J. Ge, M. Lan, C. Wang, J. Geng and P. Wang, Chem.–Asian J., 2014, 9, 811–818 CrossRef CAS PubMed.
- L. Yao, D. Wei, Y. Ni, D. Yan and C. Hu, Nano Energy, 2016, 26, 248–256 CrossRef CAS.
- J. Zhang, J. Yu, M. Jaroniec and J. R. Gong, Nano Lett., 2012, 12, 4584–4589 CrossRef CAS PubMed.
- M. Liu, D. Jing, Z. Zhou and L. Guo, Nat. Commun., 2013, 4, 2278–2286 CrossRef PubMed.
- M. Liu, L. Wang, G. Lu, X. Yao and L. Guo, Energy Environ. Sci., 2011, 4, 1372–1378 RSC.
- B. J. Ng, L. K. Putri, X. Y. Kong, K. P. Y. Shak, P. Pasbakhsh, S. P. Chai and A. R. Mohamed, Appl. Catal., B, 2017, 224, 360–367 CrossRef.
- X. Yu, A. Shavel, X. An, Z. Luo, M. Ibáñez and A. Cabot, J. Am. Chem. Soc., 2014, 136, 9236–9239 CrossRef CAS PubMed.
- X. Yu, X. An, A. Shavel, M. Ibáñez and A. Cabot, J. Mater. Chem. A, 2014, 2, 12317–12322 RSC.
- E. Dutková, P. Baláž, P. Pourghahramani, A. V. Nguyen, V. Šepelák, A. Feldhoff, J. Kováč and A. Šatka, Solid State Ionics, 2008, 179, 1242–1245 CrossRef.
- J. Y. Ouyang, C. I. Ratcliffe, D. Kingston, B. Wilkinson, J. Kuijper, X. H. Wu, J. A. Ripmeester and K. Yu, J. Phys. Chem. C, 2008, 112, 4908–4919 CrossRef CAS.
- X. H. Zhong, Y. Y. Feng, W. Knoll and M. Y. Han, J. Am. Chem. Soc., 2003, 125, 13559–13563 CrossRef CAS PubMed.
- Y. Huang, J. Chen, W. Zou, L. X. Zhang, L. Hu, R. B. Yu, J. X. Deng and X. R. Xing, Dalton Trans., 2015, 44, 10991–10996 RSC.
- X. Yu, X. An, A. Genç, M. Ibáñez, J. Arbiol, Y. Zhang and A. Cabot, J. Phys. Chem. C, 2015, 119, 21882–21888 CrossRef CAS.
- C. C. Chan, C. C. Chang, C. H. Hsu, Y. C. Weng, K. Y. Chen, H. H. Lin, W. C. Huang and S. F. Cheng, Int. J. Hydrogen Energy, 2014, 39, 1630–1639 CrossRef CAS.
- X. Zhou, X. Wang, X. Feng, K. Zhang, X. Peng, H. Wang, C. Liu, Y. Han, H. Wang and Q. Li, ACS Appl. Mater. Interfaces, 2017, 9, 22560–22567 CrossRef CAS PubMed.
- X. Wang, G. Liu, Z. G. Chen, F. Li, G. Q. Lu and H. M. Cheng, Electrochem. Commun., 2009, 11, 1174–1178 CrossRef CAS.
- K. S. Jeong, J. Tang, H. Liu, J. Kim, A. W. Schaefer, K. Kemp, L. Levina, X. Wang, S. Hoogland and R. Debnath, ACS Nano, 2012, 6, 89–99 CrossRef CAS PubMed.
- G. M. Durán, M. R. Plata, M. Zougagh, A. M. Contento and Á. Ríos, J. Colloid Interface Sci., 2014, 428, 235–241 CrossRef PubMed.
- S. Jagadeeswari, M. A. Jhonsi, A. Kathiravan and R. Renganathan, J. Lumin., 2011, 131, 597–602 CrossRef CAS.
- W. Wang, W. Feng, J. Du, W. Xue, L. Zhang, L. Zhao, Y. Li and X. Zhong, Adv. Mater., 2018, 30, 1705746–1705753 CrossRef PubMed.
- L. Yue, H. Rao, J. Du, Z. Pan, J. Yu and X. Zhong, RSC Adv., 2018, 8, 3637–3645 RSC.
- Q. Li, H. Meng, J. Yu, W. Xiao, Y. Zheng and J. Wang, Chem.–Eur. J., 2014, 20, 1176–1185 CrossRef CAS.
- J. Low, J. Yu, M. Jaroniec, S. Wageh and A. A. Alghamdi, Adv. Mater., 2017, 29, 1601694–1601714 CrossRef PubMed.
- S. R. Lingampalli, U. K. Gautam and C. N. R. Rao, Energy Environ. Sci., 2013, 6, 3589–3594 RSC.
Footnote |
| † Electronic supplementary information (ESI) available. See DOI: 10.1039/c8ra09408j |
| This journal is © The Royal Society of Chemistry 2019 |

