 Open Access Article
Electrochemical performance of graphene-coated activated mesocarbon microbeads as a supercapacitor electrode
Hongyan Xia *,
Jiajun Hu,
Jiajia Li and
Kai Wang
State Key Laboratory for Mechanical Behavior of Materials, Xi'an Jiaotong University, Xi'an 710049, China. E-mail: hyxia0707@xjtu.edu.cn; Fax: +86 29 82663453; Tel: +86 29 82667942
First published on 1st March 2019
Abstract
Hybrid activated carbon/graphene materials are prospective candidates for use as high performance supercapacitor electrode materials, since they have the superior characteristics of high surface area, abundant micro/mesoporous structure due to the presence of activated carbon and good electrical conductivity as a result of the presence of graphene. In this work, the electrochemical performance of facile and low-cost graphene-coated activated mesocarbon microbeads (g-AM) is carefully studied. The results show that g-AM can only be formed at a very high temperature over a long activation time, resulting in the formation of a large pore size and low specific surface area, further resulting in poor electrochemical performance (110 F g−1 at 0.1 A g−1 in 6 M KOH solution). Ball milling for a short time is an effective way to improve the electrochemical performance (191 F g−1 at 0.1 A g−1 in 6 M KOH solution). Moreover, due to the strong resistance to aggregation and good electrical conductivity of graphene flowers, the g-AM had nearly 100% rate capability when increasing the current density from 5 to 50 A g−1. The as-assembled two-electrode symmetric supercapacitor exhibits a high energy and power density (5.28 W h kg−1 at 10![[thin space (1/6-em)]](https://www.rsc.org/images/entities/char_2009.gif) 000 W kg−1) in organic LiPF6 electrolyte, due to its better electrical conductivity. It is expected that this type of hybrid structure holds great potential for scalable industrial manufacture as supercapacitor electrodes.
000 W kg−1) in organic LiPF6 electrolyte, due to its better electrical conductivity. It is expected that this type of hybrid structure holds great potential for scalable industrial manufacture as supercapacitor electrodes.
1. Introduction
Owing to their long cycle life, high power density, and short charging/discharging times, supercapacitors (SCs) hold great promise for wide applications as electrical power devices, and have been considered as a new and promising substitute energy system to replace fossil fuels in the future. Based on their energy storage mechanism, supercapacitors are generally classified as either electric double-layer capacitors (EDLCs) or pseudo-capacitors. In EDLCs, the charges are accumulated at the electrode/electrolyte interface as a result of the pure electrostatic attraction of the ions from the electrolyte, thus forming an electrochemical double layer. In order to achieve a high performance, the EDLC electrode materials should have critical features: (i) high specific surface areas (SSA) with abundant micropores and mesopores for charge storage, (ii) a small particle size and appropriate pore structure for fast charge/discharge, and (iii) excellent electronic/ionic conductivity for high rate capability.1–4Among various materials, carbon-based materials, especially activated carbon (AC), are the most prospective candidates for EDLC electrodes, as they have the superior characteristics of a high surface area, abundant micro/mesoporous structure, excellent chemical stability, as well as being low in cost. However, the imperfect tortuous pore structure and poor electrical conductivity of these materials increases the difficulty in transporting electrolyte ions into micropores and/or interior structure at higher scan rates, leading to their limited power density and rate capability.5,6 To resolve these shortcomings, many efforts have been focused on developing new kinds of hybrid electrode materials, such as activated carbon/CNTs, activated carbon/graphene and so on.
Due to their excellent electrical conductivity and readily accessible surface area, carbon nanotubes (CNTs) have also been considered as candidates for high-power electrode materials, but the limited surface area (∼50–1315 m2 g−1) and entanglement in CNTs restrict their use as a high performance EDLC.1 Graphene is another very promising electrode material, which has a high theoretical specific surface area (2630 m2 g−1), chemical stability and excellent electrical conductivity.7 Up to now, graphene has been mostly prepared from graphene oxide (GO), as it has a low cost for mass production.8 However, the true SSA values of graphene derived from GO are far below 2630 m2 g−1 due to aggregation. Aggregation seriously deteriorates the electrochemical performance of graphene as a supercapacitor electrode material, such as the capacitance value of ∼132 F g−1 in 1 M H2SO4 electrolyte,9 194 F g−1 in 2 M H2SO4 electrolyte,10 128 F g−1 in 1.0 M NaNO3,11 and 205 F g−1 in an aqueous KOH electrolyte solution.12 Although chemical activation and the forming of a 3D highly porous structure are effective methods for increasing the SSA of graphene,13–15 the degree of improvement in the performance is still mismatched with the fabrication costs.
Activated mesocarbon microbeads (MCMB) are one kind of AC, which are low in cost, have a high SSA value (over 3000 m2 g−1), a high micro- and mesoporous fraction, and have thus been extensively studied as a EDLC electrode.16–18 Huang et al.19 studied the capacitance behavior of MCMB activated by KOH with various mass ratios and activation temperatures, and showed that the sample with a 4![[thin space (1/6-em)]](https://www.rsc.org/images/entities/char_2009.gif) :
:![[thin space (1/6-em)]](https://www.rsc.org/images/entities/char_2009.gif) 1 mass ratio of KOH to MCMB and activation temperature of 800 °C had the highest specific capacitance (150 F g−1 at a current density of 0.5 A g−1 in 6 M KOH solution). Wu et al.20 prepared expanded mesocarbon microbeads (EMCMBs) with graphene oxide sheets using a simple solution-based oxidative process, and the specific capacitance of the EMCMBs was 43 F g−1 at a current density of 5 A g−1 in 1 M KOH solution. Cheng et al.21 prepared graphitized MCMB (g-MCMB)-based nanostructure hybrids using a simple chemical vapor deposition method. The result for g-MCMB with CNTs produced the largest specific capacitance of 303 F g−1 at a current density of 0.5 A g−1 in Na2SO4 solution.
1 mass ratio of KOH to MCMB and activation temperature of 800 °C had the highest specific capacitance (150 F g−1 at a current density of 0.5 A g−1 in 6 M KOH solution). Wu et al.20 prepared expanded mesocarbon microbeads (EMCMBs) with graphene oxide sheets using a simple solution-based oxidative process, and the specific capacitance of the EMCMBs was 43 F g−1 at a current density of 5 A g−1 in 1 M KOH solution. Cheng et al.21 prepared graphitized MCMB (g-MCMB)-based nanostructure hybrids using a simple chemical vapor deposition method. The result for g-MCMB with CNTs produced the largest specific capacitance of 303 F g−1 at a current density of 0.5 A g−1 in Na2SO4 solution.
Recently, we obtained graphene flower-coated activated carbon by activation of MCMB (g-AM) with KOH at a high temperature, which showed a high specific surface area (1855 m2 g−1) and pore volume (1.18 cm3 g−1).22 This kind of material is easy to prepare and is a hybrid structure of 3D graphene flowers and porous AC. Compared with other AC doped with graphene, the porous graphene flowers in this work have a stronger resistance to aggregation, and thus can provide stable ion transfer pathways and short paths for ion diffusion.23 Meanwhile, graphene, with its relatively high electrical conductivity, can bridge AC particles and improve the rate capability and power density of the AC. The surface of the graphene flowers contains a few oxygen-containing functional groups, which can also provide an excellent electrochemical performance during charge–discharge process.24,25 Therefore, it is expected that this kind of material with a hybrid structure is a prospective candidate for use as a facile and low-cost EDLC electrode with a high performance. In this study, the effect of activation temperature and time, and ball milling treatment on the electrochemical performance of g-AM was investigated in a three-electrode system in 6 M KOH solution, and subsequently, the energy and power density were further evaluated in a two-electrode symmetrical cell in a lithium-based organic electrolyte, to explore the application potential.
2. Experimental
2.1. Sample preparation
MCMB powder derived from coal pitch, with a mean size of 8.0 μm, was used as a raw carbonaceous material. The detailed procedure of the activation of MCMB for preparing g-AM was the same as detailed in the literature.22 The activation temperatures used were 800 and 1000 °C, and the activation times were 0, 0.5, and 1 h. In order to investigate the effect of ball milling on the microstructure evolution and electrochemical performance of g-AM, some MCMB was also wet ball milled for several hours (0, 2, 6, 12, 24, and 50 h; here 0 h means no ball milling was conducted) into a smaller size in alcohol before activation. The samples in this work were designated as AMxy-T (activated at 800 °C) and g-AMxy-T (activated at 1000 °C), where x is the ball milling time (h), y is the activation time (h), and T is the activation temperature (°C).2.2. Characterization
The change in the morphology of the activated carbon derived from MCMB under different activation conditions and different ball milling times was investigated by field-emission scanning electron microscopy (FE-SEM, S4800, Japan) and high-resolution transmission electron microscopy (HRTEM; JEM-2100F, JEOL, Japan). X-ray photo electron spectroscopy (XPS; AXIS ULtrabld, Kratos, UK) was also used to analyze the chemical composition of the activated samples. Raman spectroscopy was used to evaluate the defect degree of graphene-coated activated carbon using a laser Raman spectrophotometer (HR800, HORIBA, France), with 633 nm laser wavelength excitation and 17 mW laser power. The surface area and pore size distribution of activated carbon were obtained from N2 gas adsorption isotherms measured at 77 K using an ASAP 2020 gas adsorption surface area analyzer. In order to investigate the change in the electrical conductivity of the samples under the different activation conditions, the electrical conductivity was measured using the DC four-probe method, where the used samples were molded by cold isostatic pressing of 50 mg powders at 120 MPa for 4 min and then slowly relieving the pressure.2.3. Electrochemical tests
The electrochemical measurements were carried out on an electrochemical workstation (CHI660D, Shanghai Chenhua, China) using a three-electrode system and a symmetrical two-electrode cell. The three-electrode system was set up with 6 M KOH solution serving as the electrolyte, a platinum plate as the counter electrode, and Hg/HgO as the reference electrode. The working electrode was prepared by loading a mixture of 85 wt% g-AM powder, 10 wt% Super P and 5 wt% PTFE binder in alcohol on the Ni foam current collector, followed by drying at 120 °C for 12 h to remove the solvent and finally, pressing the ensemble together under a pressure of around 10 MPa. The mass loading of the g-AM was set to be approximately 3 mg and the working area of the electrode was kept at around 10 × 10 mm2. The electrochemical properties of the samples were investigated by cyclic voltammetry (CV) and galvanostatic charge/discharge (GCD) measurements, as well as electrochemical impedance spectroscopy (EIS). The specific capacitance (C, F g−1) of the electrode was calculated from the GCD curves based on the following equation: where I (A g−1), t (s), ΔV (V) and m (g) are the discharge current, the discharge time, the discharge potential excluding the IR drop and the mass of the active material, respectively.
To investigate the power density and energy density of the electrode, symmetrical two-electrode cells were assembled using CR2016 coin-type cells under inert argon gas. The carbon electrodes were prepared by mixing the g-AM, carbon black, and polyvinylidene fluoride (PVDF) binder in an 85![[thin space (1/6-em)]](https://www.rsc.org/images/entities/char_2009.gif) :
:![[thin space (1/6-em)]](https://www.rsc.org/images/entities/char_2009.gif) 10
10![[thin space (1/6-em)]](https://www.rsc.org/images/entities/char_2009.gif) :
:![[thin space (1/6-em)]](https://www.rsc.org/images/entities/char_2009.gif) 5 weight ratio in N-methyl-2-pyrrolidinone (NMP). The homogeneous slurry with active material of about 3–4 mg was loaded onto a Ni current collector with a diameter of 12 mm, just as processed in the three-electrode system. Electrochemical tests were processed using 1 M organic LiPF6 in an EC/DEC mixture (EC
5 weight ratio in N-methyl-2-pyrrolidinone (NMP). The homogeneous slurry with active material of about 3–4 mg was loaded onto a Ni current collector with a diameter of 12 mm, just as processed in the three-electrode system. Electrochemical tests were processed using 1 M organic LiPF6 in an EC/DEC mixture (EC![[thin space (1/6-em)]](https://www.rsc.org/images/entities/char_2009.gif) :
:![[thin space (1/6-em)]](https://www.rsc.org/images/entities/char_2009.gif) DEC = 1
DEC = 1![[thin space (1/6-em)]](https://www.rsc.org/images/entities/char_2009.gif) :
:![[thin space (1/6-em)]](https://www.rsc.org/images/entities/char_2009.gif) 1 volumetric ratio) as the electrolyte, with a potential range of between 0 and 3 V. The current density and specific capacitance values were calculated based on the weight of the active g-AM materials.
1 volumetric ratio) as the electrolyte, with a potential range of between 0 and 3 V. The current density and specific capacitance values were calculated based on the weight of the active g-AM materials.
3. Results and discussion
3.1. Electrochemical performance in a three-electrode system
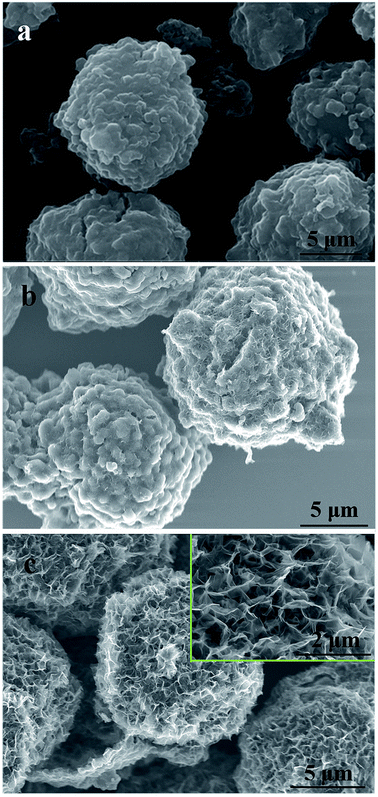 | ||
| Fig. 1 SEM images of activated MCMB under different activation conditions: (a) 800 °C for 1 h; (b) 1000 °C for 0 h; (c) 1000 °C for 1 h. | ||
TEM images of g-AM synthesized for various activation times were also recorded. As shown in Fig. 2(a)–(c), the lateral size of the graphene layers increased and the thickness decreased upon an increase in the activation time. From the high magnification images shown in Fig. 2(d)–(d), the number of graphene layers was determined at around 15 layers with an interlayer spacing of 0.354 nm at an activation time of 0 h, while the number of graphene layers decreased to around 8 layers with an increased interlayer distance of 0.366 nm at an activation time of 1 h. This means that there was intercalation and etching of metallic potassium in the carbon layers at high temperature activation.22 In addition, lots of defects in the graphene layer demonstrate its amorphous structure after activation.
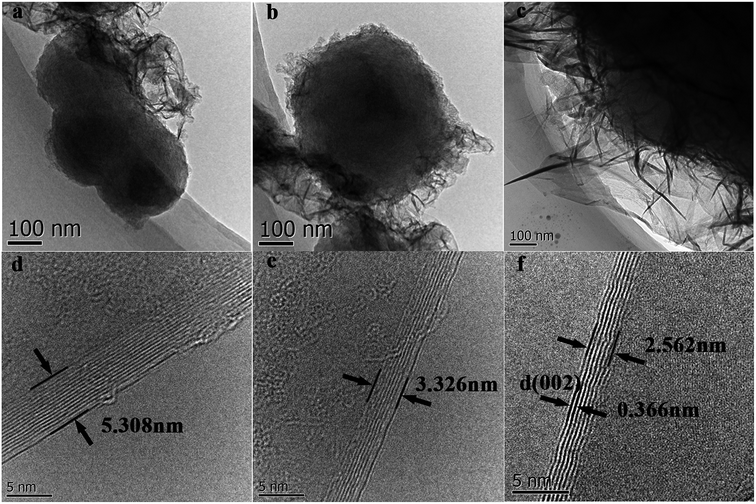 | ||
| Fig. 2 TEM and HRTEM images of g-AM samples at varied activation time: (a) and (d) 0 h; (b) and (e) 0.5 h; (c) and (f) 1 h. | ||
Electrochemical performance is closely related with the microstructure of the porous electrodes. Raman spectra of the samples activated at 1000 °C at various activation times were recorded and are shown in Fig. 3(a). All of the samples exhibited three Raman bands at around 1350 cm−1, 1580 cm−1 and 2700 cm−1 corresponding to the D, G and 2D bands, respectively. The D/G peak intensity ratios (ID/IG) of the activated MCMB were 0.33, 0.16 and 0.41 for activation times of 0, 0.5 and 1 h, respectively. This revealed that the quality of graphene was the best when the activation time was 0.5 h, and that the number of defects increased under the etching of KOH when the time was over 0.5 h. Besides, it was observed that the 2D peak shifted to a lower wavenumber value, indicating that the number of layers was reduced with activation time, which was in good agreement with the TEM results.
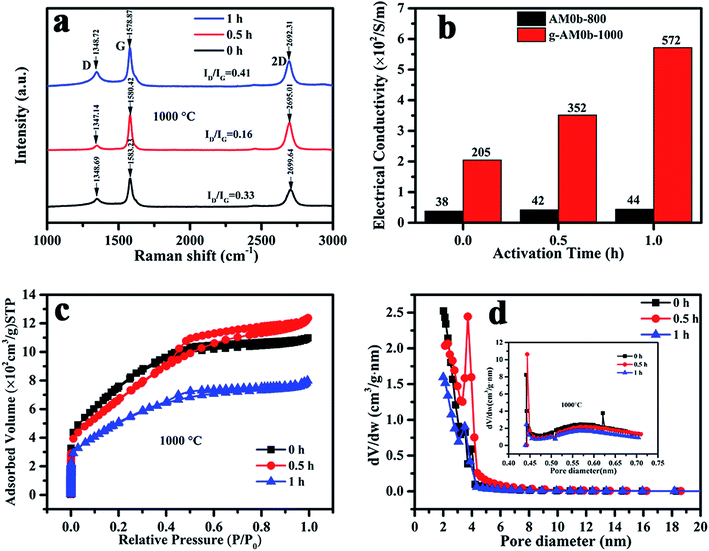 | ||
| Fig. 3 (a) Raman spectra; (b) electric conductivity; (c) nitrogen adsorption–desorption isotherms and (d) pore size distribution of activated MCMB with varied activation temperature and time. | ||
Nitrogen adsorption–desorption isotherms and the pore size distributions of MCMB activated at 1000 °C for various times (0, 0.5, and 1 h) are presented in Fig. 3(c) and (d). It can be seen that micro- and mesopores coexist in the samples. When activated for 1 h, the micro- and mesopore contents were much lower than in the other two samples that had shorter activation times. The BET specific surface areas were 2720, 2436 and 1855 m2 g−1, and the average diameters were 2.46, 3.0 and 2.55 nm, respectively, for activation times of 0, 0.5 and 1 h. Here, it should be noted that the structure of MCMB activated at 800 °C for 1 h was previously characterized by Raman and XPS spectroscopies and nitrogen adsorption–desorption measurements in our previous study.22 The results showed that the carbon had more microporous content, when the specific surface area was 2122 m2 g−1 and the average diameter was 2.13 nm.
The electrochemical performances of g-AM at different activation temperatures and times were investigated by recording CV and GCD curves. It was shown that the materials activated at different temperature and time revealed similar CV and GCD behavior, as seen in Fig. 4. It was supposed that MCMB activated at 1000 °C, especially for 1 h, should have a superior electrochemical performance because of the existence of graphene; but unfortunately, the test did not show the expected results. After calculating the discharge curves of the galvanostatic profiles in Fig. 4(c) and (d), the specific capacitances were found to be 226, 241, and 265 F g−1 at 0.1 A g−1, and 169, 168 and 221 F g−1 at 1 A g−1 when the samples were activated at 800 °C for 0, 0.5 and 1 h, respectively, generally presenting an increasing trend with time. When activated at 1000 °C, the specific capacitances were 178, 147 and 110 F g−1 at 0.1 A g−1, and 142, 128, and 100 F g−1 at 1 A g−1 for activation times of 0, 0.5 and 1 h, respectively, showing a decreasing trend with time. It is worth emphasizing that upon increasing the current density from 0.1 to 1 A g−1, the retention of the specific capacitances was 80%, 87% and 90% upon increasing the activation time at 1000 °C. This means that the rate capacity of activated MCMB was improved due to the existence of graphene, compared to AM0b1h-800 (below 83%, obtained from the above values). The higher rate capacity of g-AM-1000 was considered to be related to the electrical conductivity. Fig. 3(b) shows the electrical conductivity of AM-800 and g-AM-1000 at various activation times using the DC four-probe method. It is remarkable that the electrical conductivity of the samples activated at 1000 °C was much higher than that of other samples activated at 800 °C, and that also the value increased with a prolonging of the activation time. The reason for this may be that the content of graphene increased with activation time at 1000 °C, although the quality was the best for an activation time of 0.5 h.
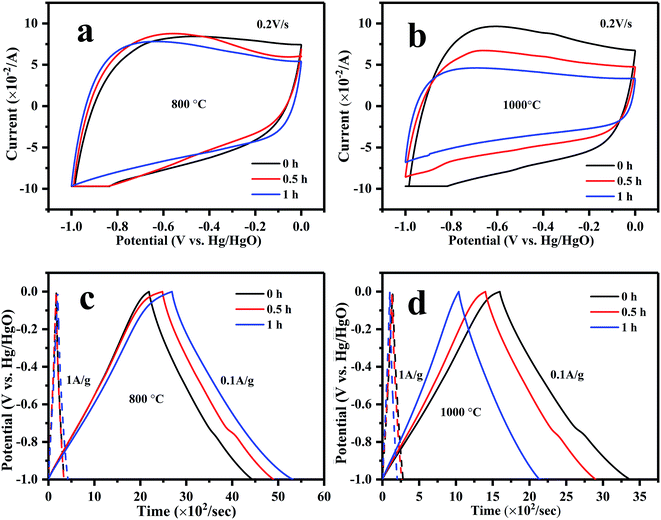 | ||
| Fig. 4 (a) CV and (c) GCD curves of MCMB activated at 800 °C; (b) CV and (d) GCD curves of MCMB activated at 1000 °C with varied activation time. | ||
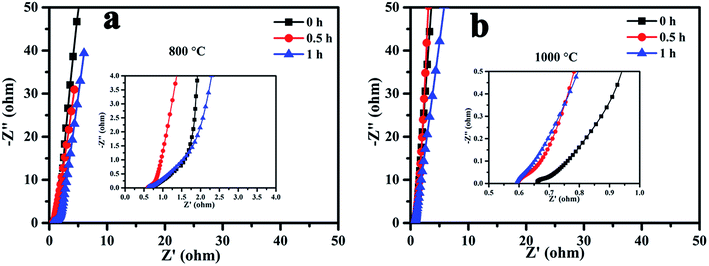
To further investigate the charge transfer resistance and ion diffusion performance of the MCMB at different activation temperatures and times, electrochemical impedance spectroscopy (EIS) was carried out and the results are presented in Fig. 5. In the low frequency region, all of the samples exhibited an oblique line, which indicated ideal capacitive behavior. In the high frequency region, the intercept of the plot at the Z′ axis represented the equivalent series resistance (ESR), which is the sum of the internal resistance of the activated materials, electrolyte resistance and the contact resistance located between the activated sample and current collector.26 As shown in Fig. 5(a) and (b), the ESR values of the samples activated at 1000 °C decreased with activation time, and were less than those of samples activated at 800 °C. The ESR value was found to be 0.6 Ω at an activation temperature of 1000 °C for 1 h. The presence of nearly no high frequency loop for all of the samples indicated good electrode–current collector contact,27,28 probably as a result of the excellent conductivity of the graphene on the surface.
We can see that the formation of graphene requires processing at a high temperature for a long activation time. However, a high temperature and long activation time can result in a large pore size and low SSA. Good specific capacitance is mainly related to a highly effective SSA, suitable pore size distribution and excellent electrical conductivity. The measured specific capacitance was proportional to SSA when activated at 1000 °C. At this temperature, although there was lots of graphene on the surface, especially when activated for 1 h, the large mean pore diameter or low SSA meant that the electrochemical performance was not very good. Thus, it is essential to find an effective method to further improve the electrochemical performance of g-AM.
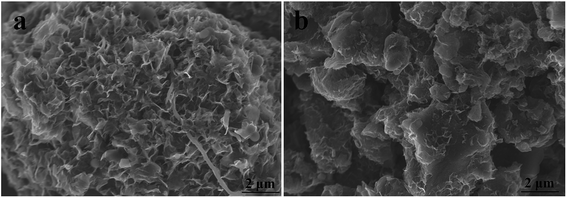 | ||
| Fig. 6 SEM images of activated MCMB at different ball milling hours: (a) 6 h; (b) 24 h. The activation temperature and time were 1000 °C and 1 h. | ||
Fig. 7(a) shows that the yield of activated carbon sharply decreased from 31 to 15%, especially above 12 h. It is supposed that when the ball milling time is increased, the increase in the degree of disorder makes it difficult to form graphene and more contact surface with KOH makes it easy to chemically etch MCMB, thus resulting in a decreased activation yield. Raman spectra were used to characterize the defect quality of activated MCMB with graphene, as shown in Fig. 7(b). A huge monotonic increase in ID/IG from 0.11 to 0.92 was observed for ball milling times of 2 to 50 h, indicating that the amorphous characteristics became more remarkable. Meanwhile, the much broader and lower G and 2D peaks for the samples revealed the higher degree of disorder in the activated carbon with ball milling time. This should also indicate the decreasing trend of the graphene content in the activated g-AM.
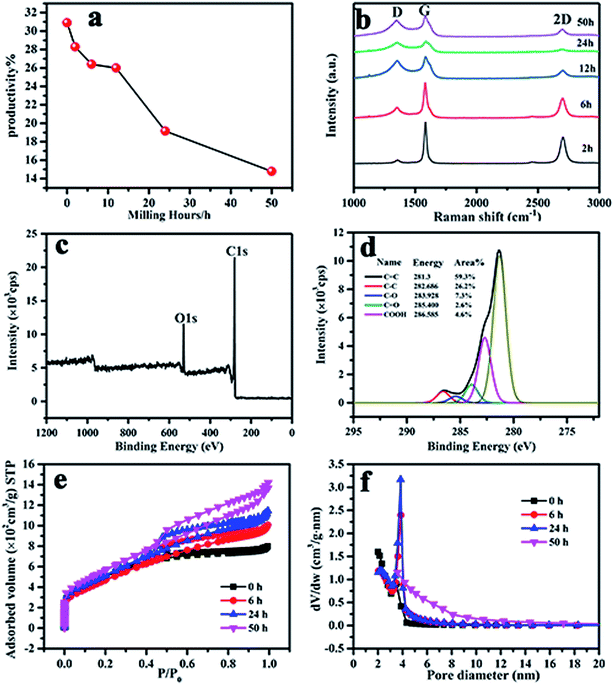 | ||
| Fig. 7 (a) The yield; (b) Raman; (c) and (d) XPS spectra of the g-AM24b1h-1000; (e) N2 adsorption isotherms versus relative pressure; and (f) BJH mesopore size distributions of the g-AM. | ||
As reported in many literature studies,31,32 heteroatom doping can greatly enhance the overall specific capacitance of carbon materials by improving the surface wettability and accessibility of the active surface area to the electrolyte solution. To detect the heteroatom state of the inner parts obtained after ball milling, the XPS spectra of activated g-AM for a ball milling time of 24 h (named as g-AM24b1h-1000) were recorded and are presented in Fig. 7(c) and (d). The sample mainly shows peaks for C 1s and O 1s, with similar patterns to those of the sample that had not undergone any ball milling treatment.22 The relative content of the surface groups of the sample was obtained by measuring the relative peak areas. Compared to g-AM without ball milling (g-AM0b1h-1000), the content of sp2 hybridized C![[double bond, length as m-dash]](https://www.rsc.org/images/entities/char_e001.gif) C, related to the graphitic structure, increased from 54.0% (without ball milling) to 59.3% (ball milling 24 h). Similarly, the content of sp3 hybridized C–C, corresponding to defects in the activated carbon, also increased from 21.3 to 26.2%. Accordingly, the oxygen-containing functional groups of C–O, C
C, related to the graphitic structure, increased from 54.0% (without ball milling) to 59.3% (ball milling 24 h). Similarly, the content of sp3 hybridized C–C, corresponding to defects in the activated carbon, also increased from 21.3 to 26.2%. Accordingly, the oxygen-containing functional groups of C–O, C![[double bond, length as m-dash]](https://www.rsc.org/images/entities/char_e001.gif) O, and COOH contents of g-AM24b1h-1000 were observed to totally decrease, with values of 7.3, 2.6, and 4.6%, respectively, compared to g-AM0b1h-1000, for which the values were 11.1, 4.6, and 5.3%, correspondingly. This means that the oxygen-containing group content in the inner of g-AM was lower than that on the surface.
O, and COOH contents of g-AM24b1h-1000 were observed to totally decrease, with values of 7.3, 2.6, and 4.6%, respectively, compared to g-AM0b1h-1000, for which the values were 11.1, 4.6, and 5.3%, correspondingly. This means that the oxygen-containing group content in the inner of g-AM was lower than that on the surface.
The nitrogen adsorption–desorption isotherms and corresponding pore size distribution curves of the g-AM at different ball milling times were tested and the results are shown in Fig. 7(e) and (f). The uptake adsorption at low relative pressure P/P0 below 0.1, which was ascribed to micropore structure, increased with an increase in the ball milling time. Along with the increase in relative pressure, steady increases in the adsorption capacity were seen in the mesopore range. At a relative pressure above 0.5, activated g-AM samples showed more obvious increases in N2 adsorption capacity with an increase in the ball milling time, suggesting that the pore volume and the number of mesopores increased. A summary of the data on the pore structures for KOH-activated g-AM at different milling times is listed in Table 1. A general increasing trend in the BET surface area, pore volume, and average pore size was observed for the samples with prolonged ball milling time. This evidence was probably due to the reduced MCMB particle size as a result of the ball milling method, and thus the increased contact surface between KOH and MCMB, which influenced the pore structure.
| Specimens | Activation temperature (°C) | Ball milling time (h) | Specific capacitance at 0.1 A g−1 | SBET (m2 g−1) | Vtotal (cm3 g−1) | Vmicro (cm3 g−1) | Micropore content | DAve (nm) |
|---|---|---|---|---|---|---|---|---|
| g-AM0b1h-1000 (ref. 22) | 1000 | 0 | 110 | 1855 | 1.18 | 0.34 | 0.29 | 2.55 |
| g-AM6b1h-1000 | 1000 | 6 | 191 | 1708 | 2.03 | 0.31 | 0.15 | 3.45 |
| g-AM24b1h-1000 | 1000 | 24 | 130 | 1875 | 2.29 | 0.35 | 0.15 | 3.54 |
| g-AM50b1h-1000 | 1000 | 50 | 122 | 2091 | 2.59 | 0.53 | 0.20 | 3.94 |
| g-AM6b1h-800 | 800 | 6 | 297 | 2692 | 1.46 | 0.51 | 0.35 | 2.18 |
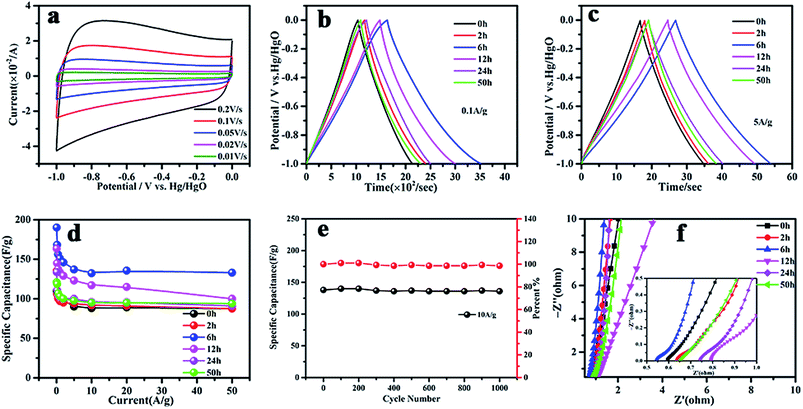
Electrochemical CV and GCD measurements on samples at different ball milling times in 6 M KOH aqueous electrolyte are shown in Fig. 8. The CV curves were measured at scan rates of 0.01–0.2 V s−1 over a potential range of −1.0 to 0 V. It can be seen that all of the samples exhibited an approximately rectangular-like shape, as expected for conventional activated carbon materials (Fig. 8(a)). The GCD results in Fig. 8(b) and (c) show that g-AM6b1h-1000 has the best electrochemical performance, with specific capacitances of 191 and 135 F g−1 at current densities of 0.1 and 5 A g−1, respectively. When increasing the current density from 5 to 50 A g−1, g-AM6b1h-1000 showed good rate capability, and the value of the specific capacitance showed almost no downward trend at a higher current density, with a retention of almost 100% of its capacitance at 5 A g−1 (Fig. 8(d)). Meanwhile, the cycling stability of g-AM6b1h-1000 showed that the retention rate of the specific capacitance was nearly 100% after 1000 cycles at a current density of 10 A g−1 (Fig. 8(e)). The high rate capability should be attributed to the suitable pore structure and graphene morphology on the surface. Here, the graphene flowers coated on AC had a porous structure and strong resistance to aggregation, tending to have stable accessible ion transfer pathways for efficiently transporting electrolyte ions to the interior surface. Meanwhile, the excellent conductivity also contributed to the decrease in the ion transfer resistance.33,34
The Nyquist plots of the g-AM in Fig. 8(f) show that each plot is composed of a nearly vertical line at low frequency and a semicircle at high frequency. The vertical line indicates the capacitive behavior and diffusion impedance of the g-AM.35 It can be seen that g-AM6b1h-1000 has the highest slope in the low-frequency region among all of the samples, as the pore structure of g-AM6b1h-1000 was suitable for ions to diffuse into the KOH aqueous electrolyte. The semicircles indicate the charge transfer resistance formed at the electrode/electrolyte interface.36,37 It can be seen that the diameters of the semicircles for g-AM2b1h-1000, g-AM6b1h-1000 and g-AM24b1h-1000 were less than for the others, of which the Rs of g-AM6b1h-1000 in the high frequency region was 0.54 Ω. From the above results, we can see the good electronic/ionic conductivity of g-AM6b1h-1000, which should benefit from the excellent conductivity of graphene on the surface.
Based on the SEM, Raman, XPS, BET surface area and pore size distribution results, g-AM6b1h-1000 did not show special and superior structure characteristics compared to the other samples. We measured the electrical conductivity of bulk samples of the different g-AM powders and found that g-AM6b1h-1000 has the best conductivity, which should play a very important role in improving the electrochemical performance, as shown in Fig. 9. Besides, the ball milling method made g-AM smaller, increasing the contact areas between the particles and shortening the ion diffusion pathway. When the ball milling time was further prolonged beyond 6 h, the amount of graphene decreased, leading to a decrease in the electrical conductivity. Thus, ball milling for a suitable time is very important for improving the specific capacitive performance for graphene-covered porous carbon architectures.
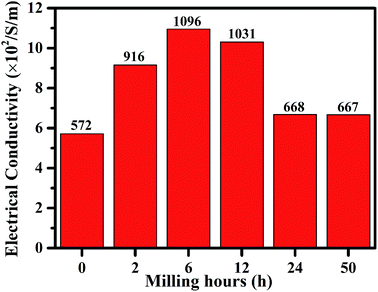 | ||
| Fig. 9 The electric conductivity of g-AM with different ball milling time when activated at 1000 °C for 1 h. | ||
For comparison, ball milling treatment was also conducted for AM activated at 800 °C for 1 h. We were delighted to find that ball milling for 6 h also improved the performance of AM. It can be seen in Table 1 that the SSA increased from 2122 to 2692 m2 g−1 after the ball milling treatment, coupled with an increase in the specific capacitance from 265 to 297 F g−1 at a current density of 0.1 A g−1.
3.2. Electrochemical properties in a two-electrode system
In order to evaluate the energy and power density, a two-electrode symmetrical cell was further constructed in a lithium-based organic electrolyte (1 mol L−1 LiPF6 in EC/DEC), where the voltage was varied from 0 to 3 V, as seen in Fig. 10. Here, two samples of g-AM6b1h-1000 and AM6b1h-800 were tested. AM6b1h-800 had good electrochemical performance in 6 M KOH aqueous solution, but had no or a small amount of graphene; the g-AM6b1h-1000 had a large amount of graphene, but the electrochemical performance in 6 M KOH was relatively low. Compared to 6 M KOH aqueous electrolyte, CV plots of the AM6b1h-800 electrodes were dramatically distorted over the whole potential range at various sweep rates in lithium-based organic electrolyte. Such behavior can be ascribed to the increased ohmic drop and limited ion transport within the tortuous pore structure. For the g-AM6b1h-1000 electrode, only a limited distortion of the CV curves was observed, demonstrating its excellent capacitive performance due to facile ion transport in the open pore structure and good electrode conductivity (Fig. 10(a)).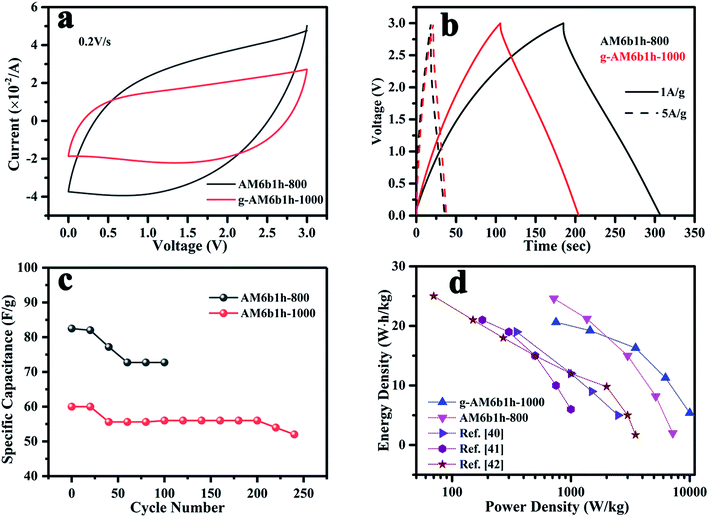 | ||
| Fig. 10 (a) CV curves of samples at scan rate of 0.2 V s−1; (b) GCD curves of samples at current densities of 1 and 5 A g−1; (c) the cycle performance of samples at 5 A g−1; (d) Ragone plots. | ||
The capacitance for a single electrode Cs (F g−1) can be calculated based on the galvanostatic charge–discharge curves as Cs = 4IΔt/(mΔV), where I (A) is the applied current density, Δt (s) the discharge time, m (g) the total mass of the active material on the two electrodes, and ΔV the voltage decrease excluding the IR drop during discharge. Fig. 10(b) shows the specific capacitances were 100 and 84 F g−1 at a current density of 1 A g−1 for AM6b1h-800 and g-AM6b1h-1000. The values are much lower than those measured in the three-electrode system, which should be caused by the remarkable difference between the electrolytes and configurations.38 Besides, it was noted that the voltage drop at the beginning of the discharge for AM6b1h-800 was larger than for g-AM6b1h-1000 at a current density of 1 A g−1, suggesting their higher equivalent series resistances in the symmetrical cells. Although the capacitance of AM6b1h-800 was higher than g-AM6b1h-1000, the cyclability of g-AM6b1h-1000 was more stable. It can be seen that g-AM6b1h-1000 has a stable electrochemical performance above 200 cycles, while the other is only stable below 120 cycles (Fig. 10(c)).
Fig. 10(d) shows the relationship between the energy density and the power density of g-AM. The energy density E was calculated as E = (1/2)C(ΔV)2, where C is the capacitance of the two-electrode capacitor (1/4 single electrode capacitance) and ΔV is the voltage decrease at discharge. The power density P can be described as P = E/Δt, where E is the energy density and Δt is the discharge time.39 Compared with other literature studies,40–42 our prepared g-AM showed a better performance. Although the energy density of AM6b1h-800 was higher at a low power density, which was about 23.36 W h kg−1 at 715 W kg−1, with an increase in the power density, the energy density quickly decreased, to produce a value of 2.08 W h kg−1 at 7500 W kg−1. In contrast, the performance of g-AM6b1h-1000 was more stable, producing a value of 20.63 W h kg−1 at 750 W kg−1 and 5.28 W h kg−1 at 10![[thin space (1/6-em)]](https://www.rsc.org/images/entities/char_2009.gif) 000 W kg−1.
000 W kg−1.
4. Conclusions
The effects of activation temperature and time, and ball milling treatment on the electrochemical performance of activated MCMB were investigated. The results show that graphene-coated AM can only be formed at a very high temperature with long activation time. However, such activation conditions produced larger sized pores and a low specific surface area, leading to poor electrochemical performance. The specific capacitance of graphene-coated AM (110 F g−1 at 0.1 F g−1) was much more inferior than AM (265 F g−1 at 0.1 F g−1) in 6 M KOH solution. Ball milling for a short time was an effective way of improving the electrochemical performance. The g-AM and AM samples with ball milling times of 6 h showed the highest specific capacitances of 191 and 297 F g−1 at 0.1 A g−1 in 6 M KOH solution. Moreover, due to the strong resistance to aggregation and good electrical conductivity, the g-AM showed nearly 100% rate capability when increasing the current density from 5 to 50 A g−1. The as-assembled two-electrode g-AM symmetrical supercapacitors exhibit a twice higher energy density at a high power density (5.28 W h kg−1 at 10![[thin space (1/6-em)]](https://www.rsc.org/images/entities/char_2009.gif) 000 W kg−1) than AM (2.08 W h kg−1 at 7500 W kg−1) in organic LiPF6 electrolyte. It is expected that this type of hybrid structure is a prospective candidate for use as a facile and low-cost EDLC electrode, holding great potential for scalable industrial manufacture.
000 W kg−1) than AM (2.08 W h kg−1 at 7500 W kg−1) in organic LiPF6 electrolyte. It is expected that this type of hybrid structure is a prospective candidate for use as a facile and low-cost EDLC electrode, holding great potential for scalable industrial manufacture.
Conflicts of interest
There are no conflicts to declare.Acknowledgements
The authors are grateful to the National Natural Science Foundation of China (No. 51202181) and the Fundamental Research Funds for the Central University (XJJ2018127).References
- N. Choudhary, C. Li, J. Moore, N. Nagaiah, L. Zhai, Y. Jung and J. Thomas, Adv. Mater., 2017, 29, 1605336 CrossRef PubMed.
- M. Yu, J. Li and L. J. Wang, Chem. Eng. J., 2017, 310, 300–306 CrossRef CAS.
- Z. Chen, J. Wen, C. Z. Yan, L. Rice, H. Sohn, M. Q. Shen, M. Cai, B. Dunn and Y. F. Lu, Adv. Energy Mater., 2011, 1, 551–556 CrossRef CAS.
- L. L. Zhang and X. S. Zhao, Chem. Soc. Rev., 2009, 38, 2520–2531 RSC.
- K. Kierzek, E. Frackowiak, G. Lota, G. Gryglewicz and J. Machnikowski, Electrochim. Acta, 2004, 49, 515–523 CrossRef CAS.
- H. B. Li, M. H. Yu, F. X. Wang, P. Liu, Y. Liang, J. Xiao, C. X. Wang, Y. X. Tong and G. W. Yang, Nat. Commun., 2013, 4, 1894 CrossRef CAS PubMed.
- Y. W. Zhu, S. Murali, W. W. Cai, X. S. Li, J. W. Suk, J. R. Potts and R. S. Ruoff, Adv. Mater., 2010, 22, 3906 CrossRef CAS PubMed.
- M. Segal, Nat. Nanotechnol., 2009, 4, 612 CrossRef CAS PubMed.
- L. T. Le, M. H. Ervin, H. W. Qiu, B. E. Fuchs and W. Y. Lee, Electrochem. Commun., 2011, 13, 355–358 CrossRef CAS.
- K. Zhang, L. Mao, L. L. Zhang, H. S. O. Chan, X. S. Zhao and J. S. Wu, J. Mater. Chem., 2011, 21, 7302–7307 RSC.
- X. Y. Peng, X. X. Liu, D. Diamond and K. T. Lau, Carbon, 2011, 49, 3488–3496 CrossRef CAS.
- Y. Wang, Z. Q. Shi, Y. Huang, Y. F. Ma, C. Y. Wang, M. M. Chen and Y. S. Chen, J. Phys. Chem. C, 2009, 113, 13103–13107 CrossRef CAS.
- Y. W. Zhu, S. Murali, M. D. Stoller, K. J. Ganesh, W. W. Cai, P. J. Ferreira, A. Pirkle, R. M. Wallace, K. A. Cychosz, M. Thommes, D. Su, E. A. Stach and R. S. Ruoff, Science, 2011, 332, 1537–1541 CrossRef CAS PubMed.
- J. Xu, Z. Tan, W. Zeng, G. Chen, S. Wu, Y. Zhao, K. Ni, Z. C. Tao, M. Ikram, H. X. Ji and Y. W. Zhu, Adv. Mater., 2016, 28, 5222–5228 CrossRef CAS PubMed.
- T. Y. Kim, G. Jung, S. Yoo, K. S. Suh and R. S. Ruoff, ACS Nano, 2013, 7, 6899–6905 CrossRef CAS PubMed.
- Z. Shen and R. Xue, Fuel Process. Technol., 2003, 84, 95–103 CrossRef CAS.
- J. Yang, Z. Shen and Z. Hao, Carbon, 2004, 42, 1872–1875 CrossRef CAS.
- F. Li, W. Chi, Z. Shen, Y. Wu, Y. Liu and H. Liu, Fuel Process. Technol., 2010, 91, 17–24 CrossRef CAS.
- C. C. Huang and Y. Z. Chen, J. Taiwan Inst. Chem. Eng., 2013, 44, 611–616 CrossRef CAS.
- M. S. Wu and Y. H. Fu, Nanoscale, 2014, 6, 4195–4203 RSC.
- Y. L. Cheng, Q. L. Zhang, C. Q. Fang, J. Chen, S. H. Guo and X. C. Che, J. Alloys Compd., 2017, 724, 443–449 CrossRef CAS.
- H. Y. Xia, K. Wang, S. H. Yang, Z. Q. Shi, H. J. Wang and J. P. Wang, Microporous Mesoporous Mater., 2016, 234, 384–391 CrossRef CAS.
- J. J. Yoo, K. Balakrishnan, J. Huang, V. Meunier, B. G. Sumpter, A. Srivastava, M. Conway, A. L. M. Reddy, J. Yu, R. Vajtai and P. M. Ajayan, Nano Lett., 2011, 11, 1423–1427 CrossRef CAS PubMed.
- S. Zhang, X. Shi, R. Wrobel, X. Chen and E. Mijowska, Electrochim. Acta, 2019, 294, 183–191 CrossRef CAS.
- Q. Zhou, M. Wu, M. Zhang, G. Xu, B. Yao, C. Li and G. Shi, Materials Today Energy, 2017, 6, 181–188 CrossRef.
- Y. Cheng, Q. Zhang, C. Fang and S. Guo, J. Electrochem. Soc., 2017, 164, 1845–1851 CrossRef.
- C. Portet, M. A. Lillo-Rodenas, A. Linares-Solano and Y. Gogotsi, Phys. Chem. Chem. Phys., 2009, 11, 4943–4945 RSC.
- J. Chmiola, G. Yushin, Y. Gogotsi, C. Portet, P. Simon and P. L. Taberna, Science, 2006, 313, 1760–1763 CrossRef CAS PubMed.
- Y. G. Wang, M. Egashira, S. Ishida, Y. Korai and I. Mochida, Carbon, 1999, 37, 307–314 CrossRef CAS.
- T. Q. Li, C. Y. Wang, X. J. Liu, J. M. Zheng and H. Wang, Fuel Process. Technol., 2005, 87, 77–83 CrossRef CAS.
- U. B. Nasini, V. Gopal Bairi, S. Kumar Ramasahayam, S. Bourdo, T. Viswanathan and A. U. Shaikh, J. Power Sources, 2014, 250, 257–265 CrossRef CAS.
- W. Li, D. Chen, Z. Li, Y. Shi, Y. Wan and G. Wang, et al., Carbon, 2007, 45, 1757–1763 CrossRef CAS.
- S. Zhang, X. Z. Shi, R. Wrobel, X. C. Chen and E. Mijowska, Electrochim. Acta, 2019, 294, 183–191 CrossRef CAS.
- Y. H. Lu, S. L. Zhang, J. M. Yin, C. C. Bai, J. H. Zhang, Y. X. Li, Y. Yang, Z. Ge, M. Zhang, L. Wei, M. X. Ma, Y. F. Ma and Y. S. Chen, Carbon, 2017, 124, 64–71 CrossRef CAS.
- L. Hao, X. Li and L. Zhi, Adv. Mater., 2013, 25, 3899–3904 CrossRef CAS PubMed.
- K. Kierzek, E. Frackowiak, G. Lota, G. Gryglewicz and J. Machnikowski, Electrochim. Acta, 2004, 49, 515–523 CrossRef CAS.
- D. Bhattacharjya and J. S. Yu, J. Power Sources, 2014, 262, 224–231 CrossRef CAS.
- L. Qie, W. Chen, H. Xu, X. Xiong, Y. Jiang, F. Zou, X. Hu, Y. Xin, Z. Zhang and Y. Huang, Energy Environ. Sci., 2013, 6, 2497–2504 RSC.
- W. Xing, S. Z. Qiao, R. G. Ding, F. Li, G. Q. Lu, Z. F. Yan and H. M. Cheng, Carbon, 2006, 44, 216–224 CrossRef CAS.
- C. H. Lai, D. Ashby, M. Moz, Y. Gogotsi, L. Pilon and B. Dunn, Langmuir, 2017, 33, 9407–9415 CrossRef CAS PubMed.
- X. L. Wang, G. Li, Z. Chen, V. Augustyn, X. M. Ma, G. Wang, B. Dunn and Y. F. Lu, Adv. Energy Mater., 2011, 1, 1089–1093 CrossRef CAS.
- J. Come, V. Augustyn, J. Woung Kim, P. Rozier, P. L. Taberna, P. Gogotsi, J. W. Long, B. Dunn and P. Simon, J. Electrochem. Soc., 2014, 161, A718–A725 CrossRef CAS.
| This journal is © The Royal Society of Chemistry 2019 |

