 Open Access Article
Enrichment and separation of steroidal saponins from the fibrous roots of Ophiopogon japonicus using macroporous adsorption resins†
Yi-Feng Zhouacd,
Li-Ling Wang *b,
Li-Chun Chen
 acd,
Tie-bing Liuacd,
Ru-Yi Shaacd and
Jian-Wei Maoacd
aSchool of Biological and Chemical Engineering, Zhejiang University of Science and Technology, No. 318 Liuhe Road, Hangzhou, 310023, China
bZhejiang Academy of Forestry, No. 399 Liuhe Road, Hangzhou, 310023, China. E-mail: echo22239@163.com
cZhejiang Provincial Key Lab for Chemical and Biological Processing Technology of Farm Produces, No. 318 Liuhe Road, Hangzhou, 310023, China
dZhejiang Province Collaborative Innovation Center of Agricultural Biological Resources Biochemical Manufacuring, No. 318 Liuhe Road, Hangzhou, 310023, China
First published on 26th February 2019
Abstract
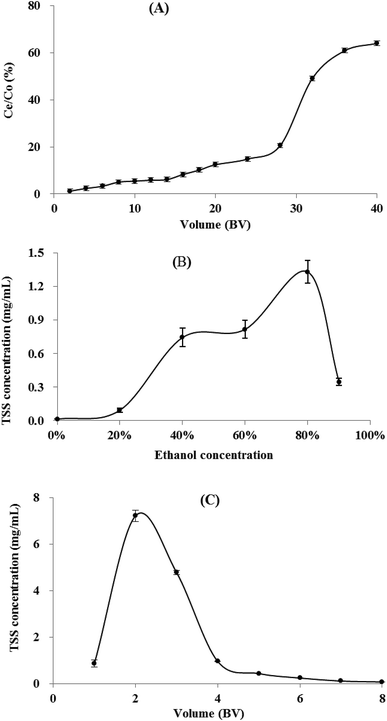
In this study, a simple and effective strategy for the enrichment of total steroidal saponins (TSS) from the fibrous roots of Ophiopogon japonicus (L. f.) Ker-Gawl. (FROJ) using macroporous adsorption resin was systematically developed. XAD-7HP resin was selected from six macroporous resins for further study because of the highest static adsorption and desorption capacities. The static adsorption of TSS on XAD-7HP resin fitted well to the Langmuir isotherm model and pseudo second-order kinetic model; the thermodynamics test showed that the adsorption process was spontaneous and exothermic. The dynamic tests on XAD-7HP resin columns demonstrated that the breakthrough volume was 16 bed volume (BV), and 6 BV of 80% ethanol was suitable for dynamic desorption. In a lab scale-up separation under optimal dynamic conditions, the content of TSS in the resin-enrichment fraction increased from 1.83% in the crude extracts to 13.86% by 7.59-fold with a recovery yield of 82.68%. Three steroidal saponins were obtained from the resin-enrichment fraction, and showed protective effects against oxidized low-density lipoprotein (ox-LDL) induced human umbilical vein endothelial cell (HUVEC) injury. Overall, these results suggested that XAD-7HP resin chromatography was an effective strategy for the large scale enrichment of TSS from FROJ, which showed the potential for functional food and pharmaceutical application.
1. Introduction
The tuberous roots of Ophiopogon japonicus (L. f.) Ker-Gawl., as a famous traditional medicine (known as Maidong in Chinese), have been used in China to cure acute coughs, sore throats and cardiovascular diseases including thrombotic diseases for many centuries.1–4 They have also been used as functional food and local medicine in Japan, Vietnam, etc.5 Steroidal saponins, homoisoflavonoids and polysaccharides are the main active ingredients of O. japonicus; steroidal saponins are also known as pharmacodynamic substances for cardiovascular protection and anti-inflammation.5,6 Previous studies have indicated that the natural products from the fibrous roots of O. japonicus (FROJ) were similar to those in the tuberous roots of O. japonicus, and several steroidal saponins were obtained from FROJ.7–14 Therefore, FROJ could be an important source for research and development in functional food and pharmaceutical applications, which can also reduce the consumption of the medicinal parts of tuberous roots and take full advantage of the plant resources.With excellent selectivity, high recovery and efficiency, macroporous adsorption resins are successfully applied for enrichment and separation of natural products, such as flavonoids,15,16 alkaloids,17 saponins,18 polyphenols,19,20 organic acid,21,22 polysaccharides,23,24 etc., from the natural complex extracts. To our knowledge, though macroporous resins have previously used in the purification process of the steroidal saponins from O. japonicus, there is little research on the adsorption and desorption behaviors of steroidal saponins on macroporous resins. In this study, the static and dynamic adsorption/desorption characteristics of total steroidal saponins (TTS) from FROJ have been systematically investigated. In addition, three steroidal saponins were obtained from the resin-enrichment fraction, and their bioactivities of endothelium protection were evaluated in vitro.
2. Experimental
2.1 Chemicals and apparatus
Macroporous resins of DM301, X-5 and S-8 were purchased from Anhui Sanxing Resin technology Company, China. Macroporous resins of XAD16, XAD1180 and XAD-7HP was obtained from H&E Company, Beijing, China. All these resin were pretreated before use. The resins were successively soaked in ethanol (95%, v/v), 5% HCl and 5% NaOH for 12 h, and washed thoroughly with pure water after every soak step. Finally, the resins were dried by an oven at 60 °C to constant weight.The reference substance of ruscogenin was purchased from the National Institutes for Food and Drug Control (Beijing, China). HPLC grade acetonitrile was obtained from TEDIA Company (Fairfield, OH, USA). The pure water was prepared by a Millipore Direct-Q3 water system (Bedford, MA, USA). Silica gel (200–300 mesh, Marine Chemical Factory, Qingdao, China) and ODS silica gel (50 mesh, YMC, Tokyo, Japan) were applied for column chromatography (CC) for the resin enrichment fraction. Fractions obtained from CC were analyzed by TLC using silica gel GF 254 plates (Marine Chemical Factory, Qingdao, China). All other solvents used in this study were of analytical grade from Lingfeng Chemical Reagent Company (Shanghai, China).
A TGCXZ-2B ultrasonic-assisted extraction equipment (Hongxianglong technology company, Beijing, China) was used for extraction of FROJ. The UV spectra were analyzed by a UV-2600 spectrophotometer (Shimadzu Corporation, Tokyo, Japan). A LC-8A preparative high-performance liquid chromatography (PHPLC) and a LC-20AD HPLC were used for HPLC purification and analysis, respectively (Shimadzu Corporation, Tokyo, Japan). The HPLC-MS analysis was applied on a Xevo G2-XS QTOF Mass Spectrometer (Waters Corporation, Milford, USA) in negative mode. The nuclear magnetic resonance (NMR) spectrometer determined by a Bruker Avance 500 NMR (Bruker Corporation, Faellanden, Switzerland).
2.2 Preparation of sample solution
The FROJ was obtained from farms of Cixi city (Zhejiang province, China) in May 2016. The samples were ground into powders and stored in the desiccator until use. The powdered FROJ were extracted with 10-fold volumes of 80% ethanol in batches. The crude extracts were immediately filtrated, concentrated and dried. The pure water was added to obtain TSS solutions at different concentrations.2.3 Determination of TSS content
2.4 Static adsorption and desorption tests
The static absorption capacity was calculated with the formula:
 | (1) |
The static absorption capacity was calculated with the formula as follows:
 | (2) |
 | (3) |
The Langmuir model and its rearranged linear form can be expressed as
 | (4) |
 | (5) |
The Freundlich model and its rearranged linear form can be expressed as
| Qe = KFCe1/n | (6) |
ln![[thin space (1/6-em)]](https://www.rsc.org/images/entities/char_2009.gif) Qe = ln Qe = ln![[thin space (1/6-em)]](https://www.rsc.org/images/entities/char_2009.gif) KF +1/n KF +1/n![[thin space (1/6-em)]](https://www.rsc.org/images/entities/char_2009.gif) ln ln![[thin space (1/6-em)]](https://www.rsc.org/images/entities/char_2009.gif) Ce Ce
| (7) |
In addition, the adsorption thermodynamics were calculated with the equations as follows:
ΔG = −RT![[thin space (1/6-em)]](https://www.rsc.org/images/entities/char_2009.gif) ln ln![[thin space (1/6-em)]](https://www.rsc.org/images/entities/char_2009.gif) Kc Kc
| (8) |
 | (9) |
To understand the mechanism involved in the adsorption process, the adsorption kinetics data were further fitted by the pseudo-first and pseudo-second-order models.
The pseudo first order model
ln(Qe − Qt) = ln![[thin space (1/6-em)]](https://www.rsc.org/images/entities/char_2009.gif) Qe − K1t Qe − K1t
| (10) |
The pseudo second order model
 | (11) |
2.5 Dynamic adsorption and desorption tests
During the dynamic adsorption and desorption process, 1 g pre-treated XAD-7HP resins (1 BV = 5 mL) were loaded onto a series of PE columns (1.6 cm × 5 cm), and the flow rate was kept at 2 BV h−1.2.6 Lab scale-up enrichment and further isolation of steroidal saponins
To validate the optimum dynamic conditions, a lab scale-up separation was conducted on a glass column (6 cm × 100 cm) at a constant flow rate of 2 BV h−1. 32 L sample solution with TSS concentration 1.245 mg mL−1 (equal to 600 g FROJ extract) was subjected to a XAD7HP resin column (1 BV = 2 L). After the sample adsorption finished, the column was successively eluted by 4 BV of pure water, 4 BV of 20% ethanol and 6 BV of 80% ethanol. The resin-enrichment fraction of 80% ethanol effluents was collected, concentrated and dried to analyze TSS contents and recoveries.The resin-enrichment fraction was further isolated as the method described by Wu et al. with some modifications.4 The fraction (28 g) was subjected to silica gel column chromatography eluted with CHCl3–MeOH–H2O (90![[thin space (1/6-em)]](https://www.rsc.org/images/entities/char_2009.gif) :
:![[thin space (1/6-em)]](https://www.rsc.org/images/entities/char_2009.gif) 10
10![[thin space (1/6-em)]](https://www.rsc.org/images/entities/char_2009.gif) :
:![[thin space (1/6-em)]](https://www.rsc.org/images/entities/char_2009.gif) 1 to 10
1 to 10![[thin space (1/6-em)]](https://www.rsc.org/images/entities/char_2009.gif) :
:![[thin space (1/6-em)]](https://www.rsc.org/images/entities/char_2009.gif) 90
90![[thin space (1/6-em)]](https://www.rsc.org/images/entities/char_2009.gif) :
:![[thin space (1/6-em)]](https://www.rsc.org/images/entities/char_2009.gif) 5, v/v) to afford eleven sub-fractions (SF. a–k). SF. e was subjected to ODS column eluted with a gradient MeOH–H2O (20
5, v/v) to afford eleven sub-fractions (SF. a–k). SF. e was subjected to ODS column eluted with a gradient MeOH–H2O (20![[thin space (1/6-em)]](https://www.rsc.org/images/entities/char_2009.gif) :
:![[thin space (1/6-em)]](https://www.rsc.org/images/entities/char_2009.gif) 80 to 100
80 to 100![[thin space (1/6-em)]](https://www.rsc.org/images/entities/char_2009.gif) :
:![[thin space (1/6-em)]](https://www.rsc.org/images/entities/char_2009.gif) 0, v/v) to afford four fractions (SF. e1–4). Fr. e3 was further purified using a PHPLC with CH3CN–H2O (40
0, v/v) to afford four fractions (SF. e1–4). Fr. e3 was further purified using a PHPLC with CH3CN–H2O (40![[thin space (1/6-em)]](https://www.rsc.org/images/entities/char_2009.gif) :
:![[thin space (1/6-em)]](https://www.rsc.org/images/entities/char_2009.gif) 60, v/v) to afford S1 (41.6 mg). Similarly, SF. f and SF. g were firstly separated on an ODS column with a gradient MeOH–H2O (20
60, v/v) to afford S1 (41.6 mg). Similarly, SF. f and SF. g were firstly separated on an ODS column with a gradient MeOH–H2O (20![[thin space (1/6-em)]](https://www.rsc.org/images/entities/char_2009.gif) :
:![[thin space (1/6-em)]](https://www.rsc.org/images/entities/char_2009.gif) 80 to 100
80 to 100![[thin space (1/6-em)]](https://www.rsc.org/images/entities/char_2009.gif) :
:![[thin space (1/6-em)]](https://www.rsc.org/images/entities/char_2009.gif) 0, v/v) to afford four fractions (SF. f1-4, SF. g1-4), respectively; then, S2 (23.8 mg) and S3 (41 mg) were accordingly obtained from SF. f2 and SF. g2 by PHPLC with CH3CN–H2O (40: 60, v/v).
0, v/v) to afford four fractions (SF. f1-4, SF. g1-4), respectively; then, S2 (23.8 mg) and S3 (41 mg) were accordingly obtained from SF. f2 and SF. g2 by PHPLC with CH3CN–H2O (40: 60, v/v).
2.7 The effect of three steroidal saponins on oxidized low-density lipoprotein (ox-LDL)-induced human umbilical vein endothelial cells (HUVECs) injury
The HUVECs and their specific medium catalog No. CM-0122 were obtained from Procell Life Science & Technology Co., Ltd. (Wuhan, China). Cell culture and viability measurement were carried out according to previous studies with some modifications.27 After cultured in a humidified incubator with 5% CO2 (37 °C) for several days, HUVECs were enzymatically harvested and counted in a haemocytometer and subcultured in 96-well plates at a density of about 5 × 10³ cell per well. Subsequently, a series of concentrations of three steroidal saponins (S1, S2 and S3 with 0, 10, 20, 40 and 50 μmol L−1) were added and cultivated for 24 h in the medium. Then, the HUVECs incubated with ox-LDL (50 μg mL−1) for 60 min. Finally, the medium was discarded and 100 μL fresh medium containing 10% Cell Counting Kit-8 (CCK-8) was added to each well for further 1 h at 37 °C. The absorbance was determined at a wavelength of 450 nm with a Thermo Varioskan Flash (Waltham, MA, USA).2.8 Statistical analysis
The analyses were conducted in triplicate in the Section 2.4 and 2.5, and were performed for five independent experiments in the Section 2.7. The experimental results were represented as the mean ± standard deviation. The significance of the difference between the experimental runs was identified based on one-way analysis of variance.3. Results and discussion
3.1 The preliminary selection of the resins
The static adsorption and desorption capacities are the important indexes for selection of the macroporous adsorption resin, and they are related with their physical and chemical properties of polarities, surface area and average pore diameter, etc. Considering steroidal saponins comprised of both non-polar sapogenin skeleton and polar sugar chains, six resins with different characteristics (Table 1) were selected in this study.| Resins | Polarity | Surface area (m2 g−1) | Average pore diameter (nm) |
|---|---|---|---|
| XAD16 | Non-polar | 800 | 15 |
| X-5 | Non-polar | 500–600 | 29–30 |
| XAD1180 | Non-polar | 450 | 40 |
| XAD-7HP | Weak-polar | 500 | 45 |
| DM301 | Moderately-polar | 330–380 | 13–17 |
| S-8 | Polar | 100–120 | 28–30 |
As shown in Fig. 1, the weak-polar XAD-7HP and non-polar XAD-1180 displayed higher adsorption capacities than other four resins, which implied that the polarities of resins is not the only factor affecting the TSS adsorption on resins. The higher adsorption capacity of TSS on the two resins may be explained by their relatively greater pore diameter and surface area as described in previous studies.28–30
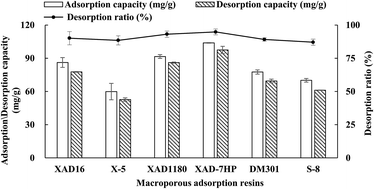 | ||
| Fig. 1 Adsorption, desorption capacities and desorption ratio of total steroidal saponins (TSS) from the fibrous roots of Ophiopogon japonicus (FROJ) on different resins (n = 3). | ||
Meanwhile, XAD-7HP also had the highest desorption capacitates and desorption ratio, although all the desorption radios of six resins were nearly 90% (Fig. 1). Therefore, XAD-7HP was chosen to study the adsorption and desorption behaviors of steroidal saponins.
3.2 Adsorption isotherms of TSS on XAD-7HP resin
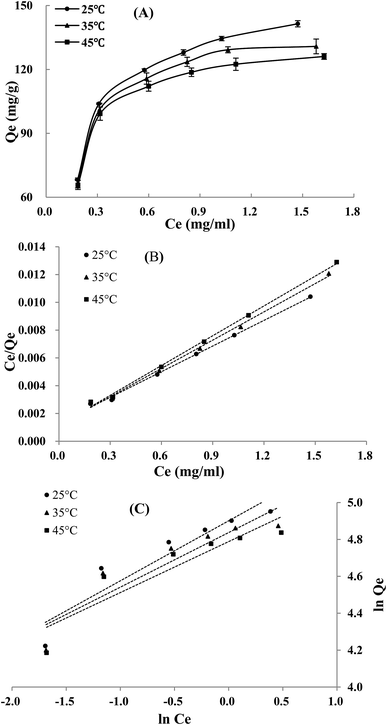
The adsorption isotherms of TSS on XAD-7HP resin at three temperatures are shown in Fig. 2A. The adsorption capacity of TSS on XAD-7HP resin increased rapidly with the increment of initial concentration, and increased slowly after the initial TSS concentration higher than 1.245 mg mL−1; moreover, the rise of temperature decreased the adsorption capacity on the resin at accordingly initial concentration, indicating an exothermic adsorption process. In views of these experimental results, the initial TSS concentration at 1.245 mg mL−1 and temperature at 25 °C were selected for further tests, respectively.As listed in Table 2, Qm in Langmuir equation is decreased with the increasing temperature, which was consistent with the experimental results; the 1/n < 1 in Freundlich equation suggested that the steroidal saponins in sample solution can be easily adsorbed on the XAD-7HP resin. As illustrated in the linear plots of Langmuir model (Fig. 2B) and Freundlich model (Fig. 2C), the Langmuir model had a better correlation with high correlation coefficient (R2 > 0.99) (Table 2) within the concentration and temperature ranges in this study. Therefore, there may be a monolayer adsorption behavior involved in the steroidal saponins of FROJ solution adsorption onto the XAD-7HP resins.
| Temperature (°C) | Langmuir equation | Freundlich equation | ||||
|---|---|---|---|---|---|---|
| KL | Qm | R2 | KF | 1/n | R2 | |
| 25 | 0.210 | 161.29 | 0.997 | 134.44 | 0.325 | 0.884 |
| 35 | 0.176 | 147.06 | 0.996 | 126.13 | 0.296 | 0.846 |
| 45 | 0.167 | 138.89 | 0.997 | 120.10 | 0.276 | 0.836 |
3.3 Adsorption thermodynamics on XAD7HP resin
As presented in Table 3, the parameters of the adsorption thermodynamics revealed the inherent energy change in the adsorption process. The negative values of ΔG showed the adsorption of the steroidal saponins is spontaneous at three different temperatures. The value of ΔH was negative, indicating the adsorption process is exothermic and relative lower temperature is beneficial for the TSS adsorption on XAD-7HP resin. The result is consistent with the findings in adsorption isotherms. Besides, the positive value of ΔS implied the increasing randomness at the resin-solute interface when the solutes were adsorbed onto the absorbent.31,32| T(°C) | ΔG (kJ mol−1) | ΔH (kJ mol−1) | ΔS (J mol−1 K−1) |
|---|---|---|---|
| 25 | −4.948 | −1.338 | 21.085 |
| 35 | −5.151 | ||
| 45 | −5.370 |
3.4 Static adsorption and desorption kinetics on XAD-7HP resin
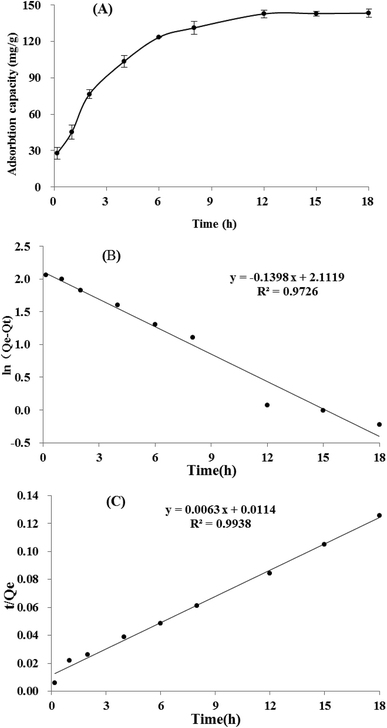
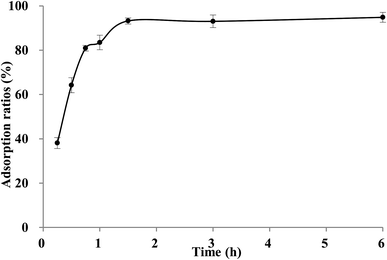
It could be seen in Fig. 3A, the adsorption capacity of TSS on XAD-7HP resin increased significantly within the first 6 h, then rised slowly thereafter, and reached equilibrium at approximately 12 h. The long equilibrium time may be attributing to too many impurities and low concentration of TSS in crude extract. Based on the adsorption data above, two linear correlation plots of the pseudo first-order model and the pseudo second-order model are illustrated in Fig. 3B and C, and the model rate constants are shown in Table 4. The adsorption kinetics is fitted well to the pseudo second-order model with the better correlation index (R2 = 0.9938), which indicated the adsorption process may be controlled by two or more rate-limiting steps. Similar observation was made in previous studies using XAD7HP resins on anthocyanin from jamun.33 Meanwhile, the desorption process of TSS on XAD-7HP was completed within 2 h (Fig. 4), which suggested a good and fast desorption effect of TSS from the resins.| Model | K | Qe | R2 |
|---|---|---|---|
| Pseudo first order | 0.3219 | 129.39 | 0.9726 |
| Pseudo second order | 0.0063 | 158.73 | 0.9938 |
3.5 Dynamic adsorption/desorption of TSS on XAD-7HP resin column
3.6 Lab scale-up separation and identification of three steroidal saponins
The scale-up dynamic enrichment was carried out according to the optimal parameters in dynamic adsorption and desorption tests. As listed in Table 5, the TSS content increased from 1.83% (w/w) to 13.86% with a recovery yield of 82.68% after the resin enrichment. After further separation and purification, three steroidal saponins (S1–3) were isolated from the XAD-7HP resin-enrichment fraction (Fig. S1†).| Weight (g) | Content (%) | Recovery (%) | |
|---|---|---|---|
| FROJ | 600.00 | 0.83 | |
| Crude extract | 268.80 | 1.83 | 98.52 |
| TSS-enrichment fraction | 29.27 | 13.86 | 82.68 |
S1 was isolated as an amorphous solid and gave a positive Liebermann–Burchard reaction. Its molecular formula was assigned to be C45H72O19 by the HRESI-QTOF-MS quasi-molecular ion peak at m/z 961.4681 [M + COOH]− (Fig. S2†). The 1H-NMR spectrum of S1 shows four methyl groups of δ 0.68 (3H, d, J = 5.5 Hz), 1.28 (3H, d, J = 7.2 Hz), 1.11 (3H, s) and 1.15 (3H, s) and one olefinic proton of 5.43 (1H, br.s), indicating the sapogenin skeleton character of S1. The 13C-NMR spectrum displayed 45 carbon signals, including 27 carbons of steroidal skeleton and the other 18 carbons due to three monosaccharide moieties (Table S1†). According to the above MS and NMR data analysis and comparison of the NMR data with a previous report,34 S1 was identified as cixi-ophiopogon C.
Similarly, by comparing with the published data of MS, 1H NMR and 13C NMR in previous literatures,4,35 their structures were identified as cixi-ophiopogon B (S2), and pennogenin-3-O-α-L-rhamnopyranosyl-(1 → 2)-[β-D-xylopyranosyl-(1 → 3)]-[β-D-glucopyranosyl-(1 → 4)]-β-D-glucopyranoside (S3) (Fig. 6), respectively. These characteristic steroidal saponins were previously isolated only from Ophiopogon japonicus cultivated in Zhejiang province, China.4,35
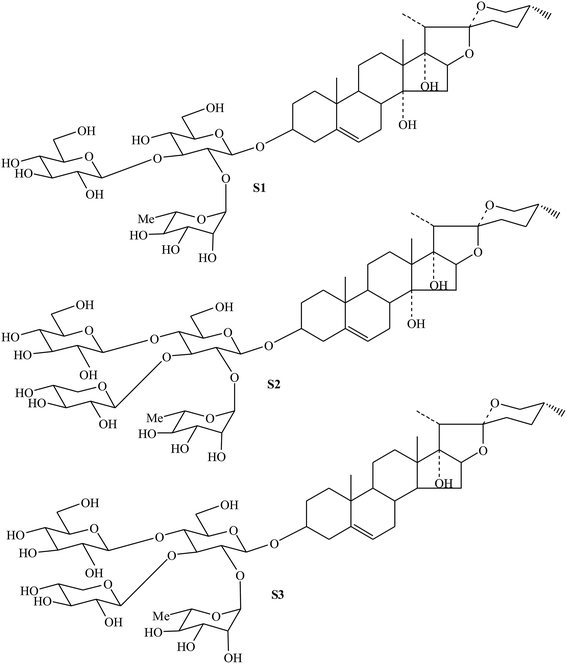 | ||
| Fig. 6 Chemical structures of steroidal saponins (S1, S2 and S3) from resin-enrichment fraction in FROJ. | ||
3.7 The inhibition of three steroidal saponins on ox-LDL-induced HUVECs injury
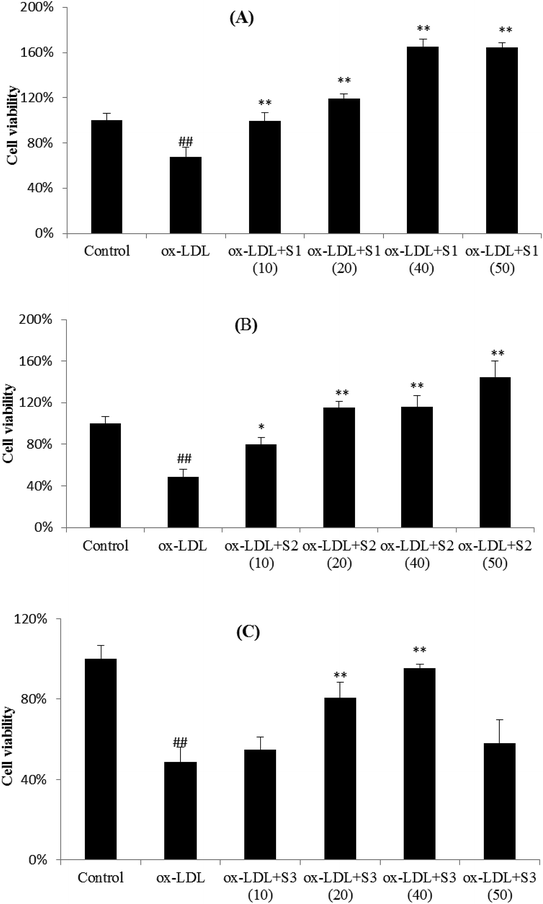
Research in recent years suggests that atherosclerosis begins with endothelial cell injury, and ox-LDL, as the markers and detectors of atherosclerosis, participated in the occurrence and development of the atherosclerosis. Ox-LDL can induce vascular endothelial cells (EC) and mononuclear macrophages to express adhesion molecules, chemotactic cytokines, proinflammatory factor and other mediators of inflammatory responses. Therefore, ox-LDL is the potential inducers of inflammatory process and a strong inducer of endothelial cell adhesion. In vitro experiments showed that ox-LDL could directly damage the surface layer of EC and induce the expression of ICAM-1, VCAM-1, and E-selectin in blood vessels, which promotes the infiltration of immune cells, monocyte and lymphocyte adhesion to endothelial, and then migrated into the subcutaneous. Monocytes differentiate into macrophages, which expresses and recognizes the scavenger receptor of ox-LDL, cholesterol deposition, foam cells formation and then atherosclerosis occurs.36–38 Therefore, the injury model of cardiovascular endothelial cells caused by ox-LDL is often used to study the mechanism of cardiovascular diseases, so as to find potential compound for the treatment of cardiovascular diseases.As shown in Fig. 7, ox-LDL was able to cause the significant decrease in cell viability as compared with unstimulated cells, and pretreatment of cells with three steroidal saponins markedly attenuated the ox-LDL effects on cell injury in a dose-dependent manner. It can be seen that the cell viability of HUVECs slightly increased after treatment with 10 μmol L−1 of three compounds, and gradually grew up from 20 to 40 μmol L−1, then reached a fairly peak value (except for a decrease of S3 at 50 μmol L−1). The relatively lower inhibition of S3 also indicated that C14–OH in sapogenin skeleton probably play an important role in cell viability. As another steroidal glycoside and an active component extracted from O. japonicus, Ophiopogonin D (OP-D) has previously been proved to be capable of protecting endothelial cells from H2O2-induced oxidative stress, which directly inhibits mitochondrial ROS generation stimulated by H2O2 and also inhibits H2O2-induced inflammatory responses and redox-sensitive signal transduction.39 In our experimental results, it also suggested that three steroidal saponins can effectively protected HUVEC cells from ox-LDL-induced cell death, and may be pharmacodynamics substances for cardiovascular protection in Zhejiang O. japonicus.
4. Conclusions
In summary, XAD-7HP resin was chosen as the optimal macroporous resin for TSS enrichment from the FROJ. The static and dynamic adsorption characteristics of systematically investigated. With the optimal conditions in lab scale-up separation, the contents of TSS in the resin-enrichment fraction increased 7.59-folds and the recovery was 82.68%. Three characteristic steroidal saponins were obtained from the resin -enrichment fraction, and showed protective effects against ox-LDL-induced endothelium injury. Therefore, XAD-7HP adsorption resin is an effective strategy for enrichment of TSS from FROJ, and FROJ has the potential for functional food and pharmaceutical application.Conflicts of interest
We declare that we have no conflict of interest.Acknowledgements
This research was supported by Zhejiang Provincial Natural Science Foundation of China (No. LY16C020002), Zhejiang Science and Technology Project (No. 2018C02054) and National Key Research and Development Program of China (2017YFF0207804, 2016YFF0201904).Notes and references
- Y. F. Zhou, J. Qi, D. N. Zhu and B. Y. Yu, Chin. J. Nat. Med., 2008, 6(3), 201–204 CrossRef CAS.
- Y. Liu, L. Z. Meng, S. X. Xie, T. H. Xu, L. K. Sun, T. H. Liu, Y. J. Xu and D. M. Xu, J. Asian Nat. Prod. Res., 2014, 16(10), 982–990 CrossRef CAS PubMed.
- L. Wang, X. L. Jiang, W. M. Zhang, F. Li, A. A. Khan, X. Liu, K. Yu and M. H. Wang, Phytochemistry, 2017, 136, 125–132 CrossRef CAS PubMed.
- Y. Wu, S. X. Bi, Z. Huang, J. Qi and B. Y. Yu, RSC Adv., 2018, 8, 2498–2505 RSC.
- M. H. Chen, X. J. Chen, M. Wang, L. G. Lin and Y. T. Wang, J. Ethnopharmacol., 2016, 181, 193–213 CrossRef CAS PubMed.
- B. Y. Yu, Chin. J. Nat. Med., 2007, 5(1), 10–14 Search PubMed.
- Y. F. Zhou, J. Qi, D. N. Zhu and B. Y. Yu, Chin. Chem. Lett., 2008, 19(9), 1086–1088 CrossRef CAS.
- C. L. Duan, X. F. Ma, Y. Jiang, J. X. Liu and P. F. Tu, J. Asian Nat. Prod. Res., 2010, 12(9), 745–751 CrossRef CAS PubMed.
- C. L. Duan, Y. J. Li, P. Li, Y. Jiang, J. X. Liu and P. F. Tu, Helv. Chim. Acta, 2010, 93, 227–232 CrossRef CAS.
- C. L. Duan, Y. Wang, X. F. Ma, Y. Jiang, J. X. Liu and P. F. Tu, Chem. Nat. Compd., 2012, 48(4), 613–615 CrossRef CAS.
- S. Lan, F. Yi, L. Shuang, C. J. Wang and X. W. Zheng, Fitoterapia, 2013, 85, 57–63 CrossRef CAS PubMed.
- Z. Y. Kang, M. J. Zhang, J. X. Wang, J. X. Liu, C. L. Duan and D. Q. Yu, J. Asian Nat. Prod. Res., 2013, 15(12), 1230–1236 CrossRef CAS PubMed.
- T. Feng, S. Lan, C. J. Wang, F. Yi and X. W. Zheng, Chem. Nat. Compd., 2014, 50(4), 732–734 CrossRef CAS.
- J. Qi, Z. F. Hu, Y. F. Zhou, Y. J. Hu and B. Y. Yu, Chem. Pharm. Bull., 2015, 63(3), 187–194 CrossRef CAS PubMed.
- Y. Dong, M. Zhao, D. X. Sun-Waterhouse, M. Z. Zhuang, H. P. Chen, M. Y. Feng and L. Z. Lin, Food Chem., 2015, 168, 538–545 CrossRef CAS PubMed.
- P. Huang, Q. Zhang, H. Y. Pan, L. J. Luan, X. S. Liu and Y. J. Wu, Sep. Purif. Technol., 2017, 175, 203–212 CrossRef CAS.
- Q. J. Cao, L. S. Wang, H. U. Rashid, H. M. Liang, X. Liu and P. Xie, Sep. Sci. Technol., 2018, 53(5), 745 CrossRef CAS.
- Y. Kong, M. M. Yan, W. Liu, C. Y. Chen, B. S. Zhao, Y. G. Zu, Y. J. Fu, M. Luo and M. Wink, J. Sep. Sci., 2010, 33, 2278–2286 CrossRef CAS PubMed.
- L. Xi, T. H. Mu and H. N. Sun, Food Chem., 2015, 172, 166–174 CrossRef CAS PubMed.
- J. Kim, M. Yoon, H. Yang, J. Jo, D. Han, Y. J. Jeon and S. Cho, Food Chem., 2014, 162, 135–142 CrossRef CAS PubMed.
- P. C. Sun, Y. Liu, Y. T. Yi, H. J. Li, P. Fan and C. H. Xia, Food Chem., 2015, 168, 55–62 CrossRef CAS PubMed.
- M. Yang, F. Zou, Q. X. Shi, S. M. Ji, X. Y. Wang, X. L. Xiang, W. Li, S. H. Jin, R. Z. Huang and C. W. Song, J. Liq. Chromatogr. Relat. Technol., 2018, 41(4), 188–195 CrossRef CAS.
- Y. Q. Xu, F. Cai, Z. Y. Yu, L. Zhang, X. G. Li, Y. Yang and G. J. Liu, Food Chem., 2016, 194, 650–658 CrossRef CAS PubMed.
- Y. Y. Shi, T. T. Liu, Y. Han, X. F. Zhu, X. J. Zhao, X. J. Ma, D. Y. Jiang and Q. H. Zhang, Food Chem., 2017, 217, 461–468 CrossRef CAS PubMed.
- Chinese Pharmacopoeia Commission, Pharmacopoeia P. R. China, China Medical Science and Technology Press, vol. I, 2015, pp. 155–156 Search PubMed.
- Y. F. Wu, L. Zhang, J. W. Mao, S. H. Liu, J. Huang, Y. R. You and L. H. Mei, J. Chromatogr. B: Anal. Technol. Biomed. Life Sci., 2016, 1028, 231–236 CrossRef PubMed.
- Y. L. Zhang, X. Q. Cao, W. W. Zhu, Z. H. Liu, H. H. Liu, Y. D. Zhou, Y. J. Cao, C. F. Liu and Y. Xie, Oxid. Med. Cell. Longevity, 2016, 2016, 1–13 Search PubMed.
- J. L. Pan, Y. Yang, R. Zhang, H. W. Yao, K. K. Ge, M. Y. Zhang and L. Ma, J. Chromatogr. B: Anal. Technol. Biomed. Life Sci., 2017, 1070, 7–14 CrossRef CAS PubMed.
- Y. Chen, W. J. Zhang, T. Zhao, F. Li, M. Zhang, J. Li, Y. Zou, W. Wang, S. J. Cobbina, X. Y. Wu and L. Q. Yang, Food Chem., 2016, 194, 712–722 CrossRef CAS PubMed.
- K. K. Li, X. L. Zhou, C. L. Liu, X. R. Yang, X. Q. Han, X. G. Shi, X. H. Song, C. X. Ye and C. H. Ko, J. Chromatogr. B: Anal. Technol. Biomed. Life Sci., 2016, 1011, 6–13 CrossRef CAS PubMed.
- L. Y. Yao, Y. X. Zhu, C. Q. Liu, R. H. Jiao, Y. H. Lu and R. X. Tan, J. Chromatogr. B: Anal. Technol. Biomed. Life Sci., 2015, 989, 122–128 CrossRef CAS PubMed.
- X. Jin, M. Y. Liu, Z. X. Chen, R. K. Mao, Q. H. Xiao, H. Gao and M. J. Wei, J. Chromatogr. B: Anal. Technol. Biomed. Life Sci., 2015, 1002, 113–122 CrossRef CAS PubMed.
- C. Jampani, A. Naik and K. Raghavarao, Sep. Purif. Technol., 2014, 125, 170–178 CrossRef CAS.
- Y. Y. Wang, J. Z. Xu, L. Zhang and H. B. Qu, Nat. Prod. Res., 2011, 25(1), 31–35 CrossRef PubMed.
- J. J. Chen, Z. L. Zhu and S. D. Luo, Acta Bot. Yunnanica, 2000, 22(1), 97–102 CAS.
- E. O. Apostolov, S. V. Shah, E. Ok and A. G. Basnakian, Arterioscler., Thromb., Vasc. Biol., 2007, 27(4), 826–832 CrossRef CAS PubMed.
- S. J. Lin, S. K. Shyue, P. L. Liu, Y. H. Chen, H. H. Ku, J. W. Chen, K. B. Tam and Y. L. Chen, J. Mol. Cell. Cardiol., 2004, 36(1), 129–139 CrossRef CAS PubMed.
- H. C. Ou, F. P. Chou, W. H. Sheu, S. L. Hsu and W. J. Lee, Arch. Toxicol., 2007, 81(6), 421–432 CrossRef CAS PubMed.
- J. Qian, F. Jiang, B. Wang, Y. Yu, X. Zhang, Z. Yin and C. Liu, J. Ethnopharmacol., 2010, 128, 438–445 CrossRef CAS PubMed.
Footnote |
| † Electronic supplementary information (ESI) available. See DOI: 10.1039/c8ra09319a |
| This journal is © The Royal Society of Chemistry 2019 |

