DOI:
10.1039/C8RA09206K
(Paper)
RSC Adv., 2019,
9, 790-800
Thermal decomposition behavior and kinetics of nanocomposites at low-modified ZnO content
Received
7th November 2018
, Accepted 19th December 2018
First published on 7th January 2019
Abstract
In this study, a titanate coupling agent (TCA) was used to modify the surface of nano ZnO. The thermal properties of room temperature vulcanized silicone rubber (RTV) nanocomposites with modified nano ZnO were compared at nano-filler weight fractions ranging from 0% to 2%. The results indicated that the titanate coupling agent was successfully grafted on the surface of nano ZnO. The size and shape of the nanoparticles were not changed after modification and all particles were about 36 nm. With increasing amounts of nanoparticles, the initial thermal decomposition temperature increased from 344.6 °C to 420 °C and reached maximum at 1.5% ZnO addition. The thermal decomposition process of RTV can be divided into three different stages. In the first stage, the temperatures at maximum decomposition rate (T1max) for the five samples were similar. In the second and third stages, T2max and T3max increased 79.1 °C and 88.9 °C, respectively, upon addition of the modified nano ZnO. The thermal decomposition kinetics results showed that the activation energy (Eα) of RTV was lower than that of 1% ZnO/RTV at the low thermal conversion rate (α). The average Eα values of the two samples were similar, at 144.29 kJ mol−1 and 146.78 kJ mol−1, respectively. The kinetic energy index (n) of RTV was 3.84. Compared to pure RTV, 1% ZnO/RTV showed a more complex thermal decomposition process, as its n value was 0.66 higher than that of RTV. Comparing Eα and n values, it was found that the nanocomposites were less likely to transform into an activated complex due to their higher potential energy barrier.
Introduction
Nano ZnO is a multifunctional inorganic nanoparticle with a particle size ranging from 1 nm to 100 nm. Due to its grain refinement, nano ZnO has outstanding physical and chemical properties, such as chemical stability, low dielectric constant, high luminous transmittance, high catalytic activity, effective antibacterial and bactericidal ability, and intense ultraviolet and infrared absorption.1 To date, nano ZnO has been used in catalysts, gas sensors, semiconductors, varistors, piezoelectric devices, antibacterial and bactericidal agents, field-emission displays and UV-shielding materials.2–6 Presently, inorganic nanoparticle-filled polymers are still an area of research interest.7–14 Mohammad A. Rafiee studied the effect of low nanographene content on the mechanical properties of epoxy and analyzed the influence of nanoparticle weight fraction on its Young's modulus;15 Du Boxue et al. studied the effect of nano SiO2 on the suppression of electrical branches in RTV and the mechanism of nano SiO2 on the resistance of electric tree aging in RTV materials.16 However, there have been few studies on nano ZnO/RTV material systems.
As an outdoor hydrophobic coating, RTV is damaged by ultraviolet light and high temperatures, shortening its operating life. Research on nano ZnO/RTV material systems explores the ability of nano ZnO to improve the thermal property and service life of RTV in practical applications. Moreover, nano ZnO is expected to be a nano-filler that enhances the thermal properties of materials, laying the foundation for future high thermal conductivity organic insulation materials.17–21
However, the high surface energy of the nanoparticles results in their agglomeration, whether dispersed in organic solvent or matrices.22–24 There are different methods to decrease the agglomeration of nanoparticles. In this study, the surface of ZnO was chemically modified by a titanate coupling agent before adding to the RTV. FTIR, Raman, BET, XPS, TEM and XRD tests were performed to confirm the grafting of titanate coupling agent onto the surface of ZnO. The dispersion of nano ZnO in the material was observed by SEM. Finally, the decomposition behaviors and kinetics of nano ZnO/RTV system and pure RTV were investigated by multi-heating rate dynamic TGA to evaluate thermal stability and examine the decomposition mechanism.
Materials and methods
Materials
One-part silicone rubber (RTV107), with a viscosity of 4000 cps, was provided by Shenzhen Hongyejie Technology Co., Ltd, China. Nano ZnO with an average particle diameter of 50 nm was supplied by Dingxin Wear-resistant Metal Materials Co., Ltd, China and dried at 100 °C in vacuum for 1 h before use. The titanate coupling agent (TCA) used as a surface treatment agent was purchased from Guangzhou Congyuan Instrument Co., Ltd, China.
Sample preparation
Modified nano ZnO was prepared by combining the nanoparticles with the titanate coupling agent at a ratio of 100![[thin space (1/6-em)]](https://www.rsc.org/images/entities/char_2009.gif) :
:![[thin space (1/6-em)]](https://www.rsc.org/images/entities/char_2009.gif) 3 in acetone solution. After mixing in a high-speed mechanical agitator for two hours at 30 °C, the mixed liquor was suction filtered and rinsed 3 times with anhydrous ethanol. Finally, the modified nanoparticles were dried in a vacuum oven at 130 °C for 24 h.
3 in acetone solution. After mixing in a high-speed mechanical agitator for two hours at 30 °C, the mixed liquor was suction filtered and rinsed 3 times with anhydrous ethanol. Finally, the modified nanoparticles were dried in a vacuum oven at 130 °C for 24 h.
The nanocomposites were prepared by the following procedure: for the uniform dispersion of the fillers in the RTV matrix, two different types of processing techniques, namely mechanical mixing and sonication, were applied. Then, the mixture was evacuated and poured into a pre-heated mold to accelerate gelation and prevent precipitation of fillers. The weight proportions of nano ZnO-TCA were 0.5%, 1%, 1.5% and 2%. Specimens of pure RTV were also prepared for comparison. Before experiments, the specimens were wiped with pure ethanol, and then dried in a desiccator at room temperature for over 24 hours.
Measurements
X-ray diffraction (XRD) studies. XRD studies were performed on a Rigaku X-ray diffractometer (Miniflex, UK) using Cu Kα radiation (λ = 0.154 nm) at a scanning rate of 0.0524°/1 (min) and a step time of 15.045 s from 3° to 90° of 2θ.
FTIR study. The treated and untreated samples were ground and FTIR spectra were recorded using a KBr pellet in a Nicolet (Impact 410) FTIR spectrometer.
Transmission electron microscopy (TEM) study. Transmission electron microscopy (TEM) was performed using a JEOL 2100F instrument. The sample was prepared by ultrasonically dispersing nano ZnO in ethanol.
BET specific surface area study. BET surface areas of the powders were measured by the Brunauer–Emmett–Teller isotherm technique with nitrogen adsorption (BET, ASAP2020M, Micromeritics, USA).
X-ray photoelectron spectroscopy (XPS) study. The surface element compositions of the samples were analyzed via X-ray photoelectron spectroscopy (XPS, Thermo Fisher K-Alpha, Thermo Fisher Scientific, Waltham, MA, USA) with a monochromatic Al Kα source (hν = 1486.8 eV) for the excitation of photoelectrons.
Raman spectroscopy study. An RM2000 microscopic confocal Raman spectrometer was utilized with an argon ion laser beam operating at 514.5 nm. The spectral band pass was 100 μm and the integration time was 1 s for each incremental step of 1 cm−1. The spectral resolution was 1 cm−1.
Thermogravimetric study. Thermogravimetric analysis (TGA) was performed at 10 °C min−1 under air using a NETZSCH TG 209F1 Libra equipment. The test temperature ranged from 30 °C to 800 °C with a precision of 0.2 °C. The mass of samples was 10 mg.
Scanning electron microscopy (SEM) study. Scanning electron microscopy (SEM) was performed using a LEO 1530 VP instrument. The samples were gold-coated with an IB-3 ionic sputtermeter.
Result and discuss
X-ray diffraction analysis
XRD patterns of nano ZnO and nano ZnO-TCA are presented in Fig. 1. The XRD pattern of ZnO shows typical peaks at 2θ = 31.7°, 33.9°, 36.2°, 47.3°, 56.4°, 62.7° and 67.8° corresponding to the (1 0 0), (0 0 2), (1 0 1), (1 0 2), (1 1 0), (1 0 3) and (1 1 2) crystallographic planes, respectively, which can be indexed to hexagonal wurtzite ZnO (JCPDS, 36-1451). The pattern of nano ZnO-TCA presented the same peaks as nano ZnO (Fig. 1).
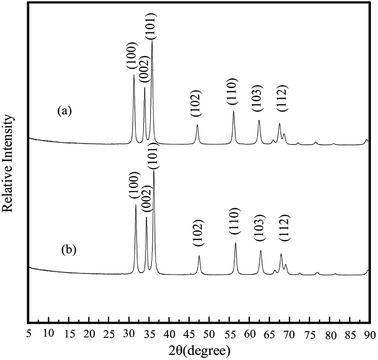 |
| | Fig. 1 XRD patterns of (a) nano ZnO-TCA and (b) nano ZnO. | |
Scherrer eqn (1) was used to predict the sizes of the two nanoparticles.
| |
D = Kλ/(B![[thin space (1/6-em)]](https://www.rsc.org/images/entities/char_2009.gif) cos(θ)) cos(θ))
| (1) |
where
D (nm) represents the size of the nanoparticle,
K is the Scherrer constant,
λ (nm) is the wavelength of the X-ray,
B (rad) is the half-height width of the measured sample diffraction peak (using double line and instrument factor corrections), and
θ (°) is the Bragg diffraction angle.
Substituting the diffraction data in eqn (1), the sizes of nano ZnO and nano ZnO-TCA are 36.1 nm and 35.8 nm, respectively.
Characterization of nano ZnO-TCA
Fourier transform infrared spectroscopy (FT-IR) was performed to confirm the presence of TCA in modified ZnO. Fig. 2 shows FT-IR spectra of TCA, nano ZnO- and titanate-modified ZnO (ZnO-TCA). The bands at 3485 cm−1 and 3475 cm−1 are attributed to stretching vibrations of the –OH group on the surface of ZnO nanoparticles. The bands at 2961 cm−1 and 2934 cm−1 are related to the vibrations of –CH3 and –CH2 groups. The spectrum of TCA shows a band at 1035 cm−1 characteristic of P–O–Ti groups.
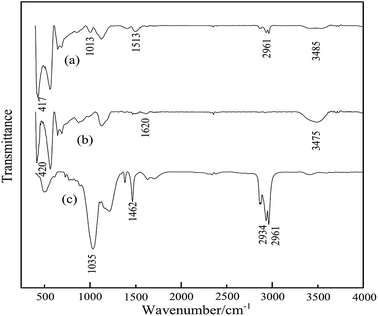 |
| | Fig. 2 FTIR spectra of (a) nano ZnO-TCA, (b) nano ZnO and (c) titanate coupling agent (TCA). | |
Compared to the FTIR spectrum of nano ZnO, the –OH peak of nano ZnO-TCA near 3485 cm−1 decreased significantly. This shows that the –OH group on the surface of the nano ZnO was used to form the Ti–O–Zn bond. In addition, the characteristic peak of titanate coupling agent appeared at about 1013 cm−1 in the spectrum of nano ZnO-TCA. A band at about 2961 cm−1 appeared in the spectrum of nano ZnO-TCA but was absent in nano ZnO. All the above-mentioned data indicate the titanate coupling agent was successfully chemically grafted on nano ZnO.
XPS analysis
XPS analysis of nano ZnO before and after organic surface modification was performed. Fig. 3 and 4 were obtained by taking adventitious carbon (electron binding energy 284.8 eV) as the internal standard. The XPS spectra of C1s and O1s were separated by Gaussian fitting. The results are listed in Table 1. The electron binding energies of both C–C structure and C–H structure were around 284.5 eV, so the C–H bond in the modifier could be quantitatively expressed. The peaks of C1s at 286.4 eV and 288.6 eV are contributed to C–O and ester-group structures, respectively. During modification, the hydroxyl group on the nanoparticle surface combined with the coupling agent to form ester-group structure, resulting in an increase in the area ratio of ester-group structure to C–O structure. There are two types of O on the surface of particles before and after modification. The peak of O1s at 530.2 eV came from the lattice O in ZnO and the other peak came from the surface hydroxyl oxygen. After modification, the O content in the lattice was significantly reduced, indicating that the organic layer coating weakened the lattice O signal. Table 2 shows the content of each element on the surfaces of the nanoparticles before and after modification. The results show that the ratio of O element to Zn element increased after modification, while C element was not analyzed due to interference from the substrate. The above results all prove the chemical combination of titanate coupling agent and nano ZnO.
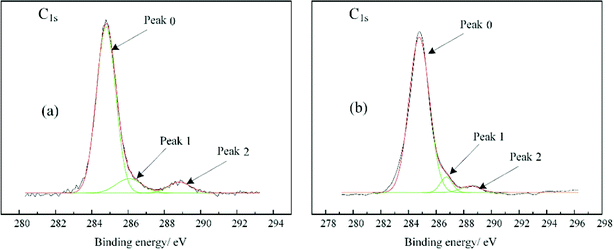 |
| | Fig. 3 XPS spectra of C1s. (a) Nano ZnO; (b) nano ZnO modified with TCA. | |
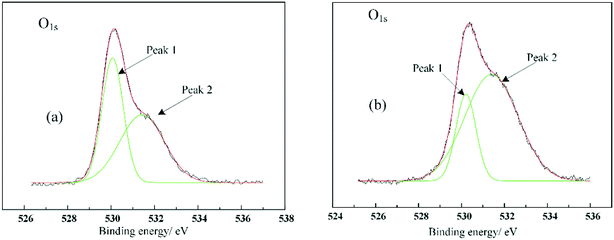 |
| | Fig. 4 XPS spectra of O1s. (a) Nano ZnO; (b) nano ZnO modified with TCA. | |
Table 1 Fitting parameters for the C1s and O1s peaks
| Element |
Sample |
Eb1/eV |
Eb2/eV |
Area1/% |
Area2/% |
Area1/area2 |
| C 1s |
Unmodified |
286.06 |
288.83 |
9.67 |
6.49 |
1.61 |
| Modified |
286.73 |
288.49 |
5.38 |
3.65 |
1.47 |
| O 1s |
Unmodified |
530.07 |
531.42 |
46.95 |
53.05 |
0.89 |
| Modified |
530.21 |
531.40 |
23.62 |
76.38 |
0.31 |
Table 2 Element content on the surface of ZnO and ZnO-TCA
| Sample |
Zn/% |
C/% |
O/% |
Ti/% |
| Unmodified |
30.15 |
37.67 |
32.17 |
0 |
| Modified |
28.29 |
34.95 |
36.31 |
0.46 |
Raman spectrum study
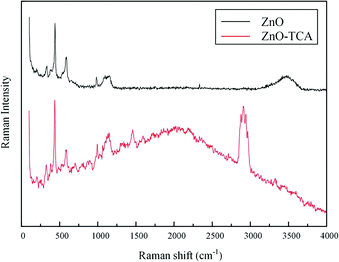
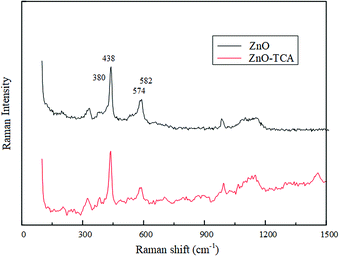
Fig. 5 shows the Raman spectra of nano ZnO-TCA and nano ZnO under the same experimental conditions. Compared to the Raman spectrum of nano ZnO, nano ZnO-TCA had a strong spectral band near 2900 cm−1 contributed by C–H. The change in the characteristic band near 3600 cm−1 indicated that the titanate coupling agent was grafted on the surface of nano ZnO. The results of the Raman spectra are similar to those of the infrared spectra mentioned above. Peaks at 101 cm−1, 380 cm−1, 438 cm−1, 574 cm−1, and 582 cm−1 are the first-order scattering bands of nano ZnO, which belong to E2 (low), A1 (TO), E2 (high), A1 (LO) and E1 (LO) symmetry vibration bands, respectively. After the coupling agent treatment, Raman spectrum showed no change. All the samples showed the characteristic peaks at 329 cm−1, 382 cm−1, 437 cm−1 and 574 cm−1, which indicate that the symmetry of ZnO was damaged but with no significant effect on the lattice structure. Research shows that the peak at 437 cm−1 is the characteristic E2 (high) band of ZnO hexagonal wurtzite phase, mainly associated with movement of the O atom. The increase in E2 peak intensity after modification indicated that the surface-grafted organic molecules inhibited internal and interfacial polarization and enhanced the homeostatic dipole moment in nano-ZnO (Fig. 6).
 |
| | Fig. 5 Raman spectra of nano ZnO and nano ZnO-TCA. | |
 |
| | Fig. 6 The enlarged Raman spectra of nano ZnO and nano ZnO-TCA. | |
TEM analysis
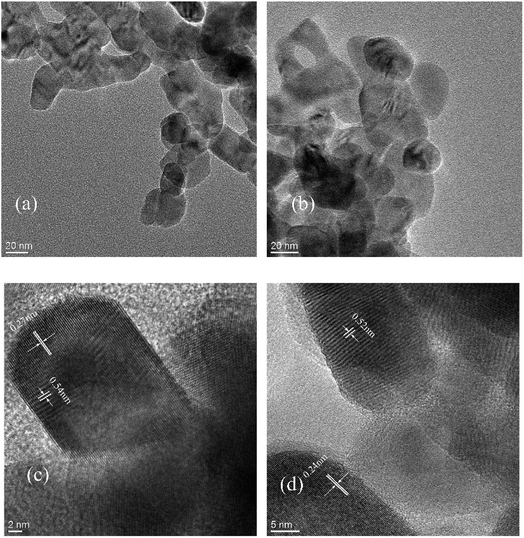
The most direct measurements of the size, shape, dimension, etc. of nano ZnO was made through TEM. Fig. 7 shows that the morphology of nano ZnO was hexagonal wurtzite with particle size about 36 nm; neither size nor shape were changed after surface modification. Fig. 7(c) and (d) show the lattice fringe spacing of nanoparticles before and after modification. The crystal spacings of ZnO-TCA (0001) and (0110) crystal surfaces were slightly smaller than those of nano ZnO before modification. It is obvious that the crystal of nano ZnO became denser after modification but did not change its crystal structure.
 |
| | Fig. 7 TEM of (a) nano ZnO and (b) nano ZnO-TCA; HRTEM of (c) nano ZnO and (d) nano ZnO-TCA. | |
BET analysis
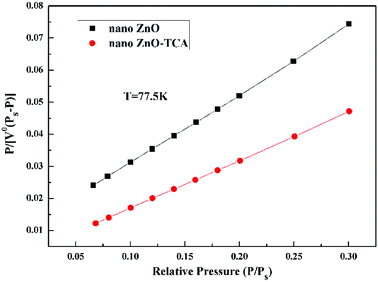
At low temperatures (78 K), the adsorption of N2 on a solid surface was physical adsorption. The force field at each point inside the solid was balanced by the forces in all directions, but the surface of the solid would adsorb gas due to the surface free energy force field. Under the condition of complete monolayer adsorption, the adsorption volume of nitrogen on the external and internal hole surfaces of nanopowder, with relative pressure P/Ps between 0.06 and 0.20, was tested by static constant volume method. Monolayer adsorption capacity could be determined by BET linear regression method from the adsorption isotherm. The specific surface area of the nanoparticle was calculated using the BET adsorption formula. The adsorption amount V0 is related to the relative pressure P/Ps of N2, subject to the BET formula:| |
 | (2) |
where P is the nitrogen pressure, Ps is the saturated vapor pressure, V0 is the equilibrium adsorption volume, C is a constant, and Vm is the monolayer saturated adsorption volume.
In accordance with the multi-point adsorption measurement results, P/[V0(Ps − P)] was plotted on the ordinate and P/Ps was plotted on the abscissa. The intercept of the line and the slope could be obtained by linear regression: b = 1/(Vm × C) and k = (C − 1)/(Vm × C). Then, single layer adsorption capacity Vm and BET parameter C were obtained. The specific surface area of the unit weight powder was obtained by the following formula:
| |
 | (3) |
where
σ is the single molecule cross-sectional area (16.2 × 10
−20 m
2),
N is Avogadro's constant (6.23 × 10
23 mol
−1),
V0 is the gas molar volume (22.4 × 10
−3 m
3), and
W is the test sample weight (g).
The multi-point adsorption results of nano zinc oxide are shown in Fig. 8. To conveniently compare BET curves of the two samples, the data in the figure were extracted and calculated in Table 3. The results show that BET surface area of nano ZnO increased from 19.54 m2 g−1 to 28.73 m2 g−1 after modification. It proves that surface modification could reduce the surface energy of nanoparticles and contribute to their dispersion, resulting in the adsorption of more gas at the same weight. The nano sizes of the two samples were 35.9 nm and 37.3 nm for nano ZnO and nano ZnO-TCA, respectively, which are consistent with the XRD results.
 |
| | Fig. 8 BET plots of nano ZnO and nano ZnO-TCA. | |
Table 3 BET experimental results of nano ZnO and nano ZnO-TCA
| Sample |
Material constant |
BET surface area (m2 g−1) |
Single point surface area (m2 g−1) |
Adsorption average pore width (nm) |
| Nano ZnO |
22.6869 |
19.54 |
17.57 |
35.9 |
| Nano ZnO-TCA |
75.7671 |
28.73 |
27.71 |
37.3 |
SEM analysis
Fig. 9 shows a scanning electron microscopy (SEM) image of a freeze-fractured nanocomposite sample with 1% weight nano ZnO. The image clearly displays nano ZnO particles protruding out of the fracture surface of the sample. The distribution was satisfactory, as the particles were isolated and scattered uniformly in the matrix.
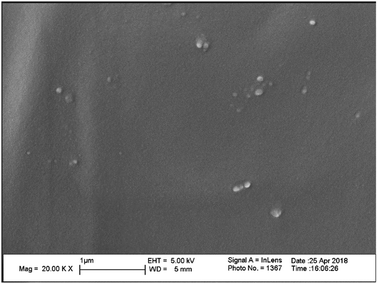 |
| | Fig. 9 SEM of 1% nano ZnO-TCA filled silicone rubber at 20![[thin space (1/6-em)]](https://www.rsc.org/images/entities/char_2009.gif) 000× magnification. 000× magnification. | |
Thermogravimetric analysis
Tanaka et al. determined the interfacial region of the surface area of particles based on the relationship between particle size and filling amount of nanoparticles. A 1% mass fraction would produce a 50% interfacial region within the material volume if the particle diameter was 10 nm. Based on colloidal chemistry, polymer chemistry and solid-state physics, Tanaka proposed a multi-core model theory for the interface of polymer nanocomposite dielectric materials. The model emphasized the interaction between polymer chain segments and nanoparticles after coupling agent action. The multi-core model proposes that the interfacial layer of nanocomposites was composed of a bond layer, binding layer and loose layer. Heat is transmitted by phonons in polymers. Filling nanoparticles lead to a large number of interfaces in the polymer. Thermal resistance between interfaces hinders the propagation of phonons, while the spread of phonons between nanoparticles is enhanced. According to the multi-core model, the coupling agent enhances the interfacial interaction between nanoparticles and polymer matrix, which reduces interfacial thermal resistance. Thus, modified nano ZnO improves the thermal conductivity and inhibits the thermal decomposition process of the material.
Thermogravimetric analysis (TGA) measurements were performed to obtain information on the thermal stability of five nanocomposite systems. Fig. 10 shows the TGA of all nanocomposites considered for this investigation. We define the initial decomposition temperature (Tinitial) as the temperature at 10% weight loss, Tnmax as the temperature of maximum rate of each degradation stage, and 50% weight loss as a marker for structural decomposition of the samples. The analysis results are listed in Table 4. Notably, the TG traces of the five RTV systems exhibited different profiles. However, most of them showed similar tendencies and the pyrolysis process of the individual nanocomposite could be divided into three stages during thermal decomposition. The first stage showed release of moisture and some thinners, generating a small hump in the DTG curve from 300 °C to around 400 °C. As the content of nano ZnO increased, the rate of the first decomposition stage of the composite decreased. The structural decomposition of the polymer and combustion of the material mainly occurred in the second and third stages. T2max and T3max of the nanocomposites were all higher than those of pure RTV and reach the highest temperatures with addition of 1.5% nano ZnO. According to the DTG curve, adding nano ZnO to RTV significantly enhanced its thermal stability. It might have produced chemical cross-linking points between the surface of the nanoparticle and the long chain of RTV, which increased the polymer's degree of cross-linking. Moreover, the thermal conductivity of nano ZnO particles is much higher than that of RTV, forming many cores for heat conduction in the material. With increasing amounts of nanoparticles, the density of cores increased, resulting in the enhancement of the material's heat conduction. However, as the content of nanoparticles further increased, the contact area between the nanoparticles and RTV reduced as a result of agglomeration of nanoparticles, lowering the thermal stability of the material.
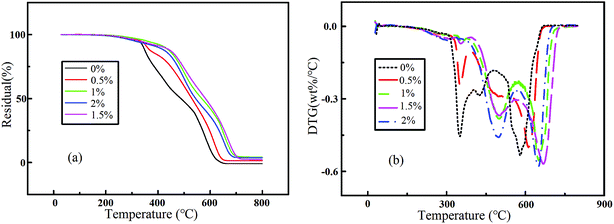 |
| | Fig. 10 (a) TGA curves and (b) DTG curves of five RTV systems with different nano ZnO contents. | |
Table 4 The thermal properties of five RTV systems with different nano ZnO contentsa
| Sample |
Tinitial (°C) |
T1max (°C) |
T2max (°C) |
T3max (°C) |
Residue (%) |
| 1st step |
2nd step |
3rd step |
| T1max, T2max and T3max are the maximum decomposition temperatures in the first, second, and third stages. |
| RTV |
344.6 |
348.6 |
425.6 |
583.4 |
−0.8 |
| 0.5% ZnO/RTV |
358.9 |
348.7 |
493.2 |
616.2 |
1.4 |
| 1% ZnO/RTV |
426.9 |
359.1 |
501.5 |
651.2 |
4.2 |
| 1.5% ZnO/RTV |
423.6 |
351.5 |
504.7 |
672.3 |
3.7 |
| 2% ZnO/RTV |
401.9 |
306.2 |
503.6 |
655.2 |
2.3 |
Kinetic model
FWO models. TGA was used to analyze the kinetics of thermal decomposition of polymer and the rate of decomposition is proportional to a that of a model mechanism. The rate constant could be described by the Arrhenius equation, which is a temperature dependent function, as follows:| |
 | (4) |
| |
 | (5) |
where f(α) and α are mechanism models with respect to rate of conversion and the weight loss fraction obtained by the ratio of the mass lost at the current time to the final mass lost at the end of decomposition reaction, respectively; A is the preexponential factor, Eα is the activation energy and R is the ideal gas constant. Combining eqn (4) with (5), eqn (6) is obtained:| |
 | (6) |
The reaction temperature is described by eqn (7), where T0 is the initial temperature before the material starts heating and β is the heating rate of experiments.
When the sample was heated at a constant rate (β) instead of constant temperature and basic eqn (7) was used, the new decomposition rate of polymer can be shown and the function of definite integration for eqn (8) is shown as eqn (9).
| |
 | (8) |
| |
 | (9) |
where
G(
α) is obtained by the integrated expression of function
f(
α).
In this study, the Flynn–Wall–Ozawa (FWO) method, which ignored the reaction mechanism of the thermal decomposition process of polymer, was used for kinetic analysis. The FWO method was obtained from eqn (9). The variables given in eqn (9) may be approximated and integrated to give the natural logarithm form as follows:
| |
 | (10) |
Under different heating rates, ln(β) versus 1/T data points should have a linear relationship at the degree of conversion. The activation energy Eα can be calculated by the slope of any conversions.
Master-plots method
Eqn (9) can be rearranged to the following form:| |
 | (11) |
where P(u) can be described as below:| |
 | (12) |
| |
 | (13) |
Substituting eqn (11) into eqn (10) yields the following expression:
| |
P(u) = 0.00484![[thin space (1/6-em)]](https://www.rsc.org/images/entities/char_2009.gif) exp(0.0156u) exp(0.0156u)
| (14) |
Assuming that Eα and A are invariable to reduce the complexity of calculations, the master plots method, dividing both sides of eqn (11) by a reference at point α = 0.1, was used to choose the appropriate kinetic model. Eqn (16) is obtained as below:
| |
 | (15) |
| |
 | (16) |
Substitute all mechanism models suitable for polymer thermal decomposition into G(α)/G(0.1) and a theoretical curve was created from this function. The experimental data were substituted in P(u)/P(0.1) from the TGA data at one of three heating rates. If the curve of P(u)/P(0.1) fits well with one of the curves of G(α)/G(0.1), that adaptive thermal decomposition kinetic model can be used to explain the thermal decomposition behavior of the polymer.
Kinetics analysis
In analysis of thermal decomposition kinetics, activation energy Eα, preexponential factor A and kinetic index n are three important parameters which describe the thermal decomposition behavior of a substance. Eα represents the minimum energy required to transform a substance from a steady state to an activated state; it is a good description of how easily a substance can be decomposed. In this paper, the FWO method was used to obtain activation energies Eα for RTV and its nanocomposites at three different heating rates. The thermal decomposition kinetic model of the polymer was obtained from the master-plots model.
Fig. 11 shows the dynamic TG curves of two RTV systems obtained at different heating rates from 10 °C min−1 to 25 °C min−1. It can be observed that a higher heating rate resulted in slower decomposition speeds for RTV and 1% ZnO/RTV; the Tinitial and Tmax of thermal decomposition shift to higher temperatures with increased heating rates.
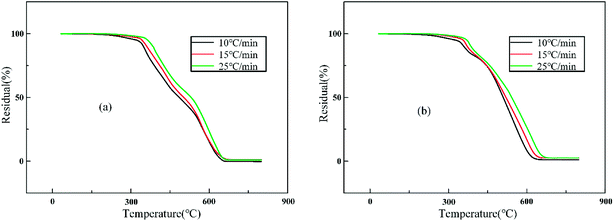 |
| | Fig. 11 TG curves of (a) RTV and (b) 1% ZnO/RTV at different heating rates. | |
For some complex organic polymers, the thermal decomposition process was complicated. It is difficult to obtain more information about the reaction mechanisms of RTV and its nanocomposites. So, FWO method was used to determine the activation energies. In this paper, three heating rates of 10 °C min−1, 15 °C min−1 and 25 °C min−1 from room temperature to 800 °C min−1 were applied to TGA. The activation energy Eα at different conversion rates could be obtained by the slope of ln(β) against 1/T.
Fig. 12 shows the linear correlations for ln(β) versus 1/T for thermal decomposition processes and the values of R2 for most curves range from 0.9057 to 0.9989, indicating that the TGA results are reliable. As shown in Table 2, the average Eα values of RTV and 1% ZnO/RTV were 144.92 kJ mol−1 and 146.78 kJ mol−1, respectively (Table 5).
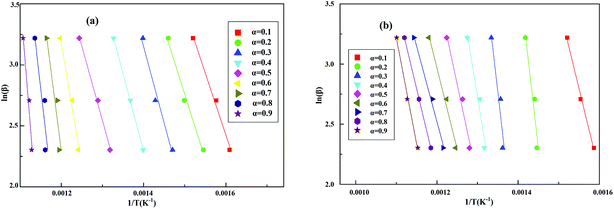 |
| | Fig. 12 Linear correlations for ln(β) versus 1/T in (a) RTV and (b) 1% ZnO/RTV. | |
Table 5 The Eα values of samples at 25 °C min−1 by FWO
| RTV |
1% ZnO/RTV |
| α |
FWO |
α |
FWO |
| Eα (kJ mol−1) |
R2 |
Eα (kJ mol−1) |
R2 |
| 0.1 |
78.52 |
0.9311 |
0.1 |
109.76 |
0.5531 |
| 0.2 |
82.58 |
0.9838 |
0.2 |
233.00 |
0.9963 |
| 0.3 |
97.01 |
0.9709 |
0.3 |
233.01 |
0.9876 |
| 0.4 |
98.38 |
0.9485 |
0.4 |
163.29 |
0.9484 |
| 0.5 |
94.18 |
0.9982 |
0.5 |
124.88 |
0.9213 |
| 0.6 |
155.75 |
0.9939 |
0.6 |
107.19 |
0.9812 |
| 0.7 |
203.33 |
0.9628 |
0.7 |
99.14 |
0.9057 |
| 0.8 |
228.27 |
0.9254 |
0.8 |
111.48 |
0.9257 |
| 0.9 |
266.30 |
0.9316 |
0.9 |
139.31 |
0.9649 |
| Average |
144.92 |
0.9607 |
Average |
146.78 |
0.9094 |
Thermal decomposition function
The Eα values of RTV and the nanocomposite are average values for the whole pyrolysis process calculated by FWO method. The values for plots of P(α)/P(0.1) against α at 25°C min−1 correspond to each fitted theoretical thermal decomposition model. The result shows that the Fn function had the highest fitting degree with experimental data. Substituting the Fn function into G(α), the kinetic exponent (n) and pre-exponential factor (A) can be obtained from eqn (17) as follows:| |
 | (17) |
Comparing the experimental data of RTV and its nanocomposite with the Fn thermal decomposition model, it was found that the fitting degree of the curve of Fn with the experimental values was less than 0.9. To obtain an optimal solution of n with the highest fitting degree, linear least-squares fitting procedure was utilized to fit the curve [(1 − α)1−n − 1]/(n − 1) with EαAP(u)/βR. The value of n was determined by the highest value of correlation coefficient (R) and A was obtained from eqn (17). As a result, the values of activation energy Eα, preexponential factor A and kinetic index n and the thermal decomposition equations at 25 °C min−1 for RTV and nanocomposite were obtained (Table 6). The results indicate that filling with nano ZnO made the thermal decomposition behavior of RTV more complicated (Fig. 13).
Table 6 Eα, n and A values obtained at 25 °C min−1 by master-plots method
| Sample |
Eα (kJ mol−1) |
A (s−1) |
n |
R |
Decomposition equation |
| RTV |
144.29 |
4.31 × 10¹⁰ |
3.84 |
0.9909 |
dα/dt = 4.31 × 10¹⁰![[thin space (1/6-em)]](https://www.rsc.org/images/entities/char_2009.gif) exp(−144.29 × 10³/(RT))(1 − α)3.84 exp(−144.29 × 10³/(RT))(1 − α)3.84 |
| 1% ZnO/RTV |
146.78 |
1.42 × 10¹⁰ |
4.50 |
0.9951 |
dα/dt = 1.42 × 10¹⁰![[thin space (1/6-em)]](https://www.rsc.org/images/entities/char_2009.gif) exp(−146.78 × 10³/(RT))(1 − α)4.50 exp(−146.78 × 10³/(RT))(1 − α)4.50 |
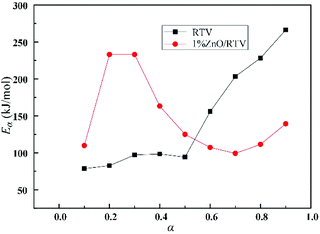 |
| | Fig. 13 Variation of effective activation energy (Eα) with conversion (α). | |
It has been reported that a pre-exponential factor A less than 109 s−1 indicates that the reaction was a surface reaction or that the polymer is a “tight” complex.25 A high A indicates a “loose” complex where there was no free translation on the surface of polymer. Moreover, the range of empirical first order A may vary from 104 to 1018 s−1; complex physical structures and decomposition processes may lead to variation in A with conversion.26 The present results are shown in Table 6. The A values of RTV and its nanocomposite were 4.31 × 10¹⁰ and 1.42 × 10¹⁰, respectively, and the thermal decomposition function indicates that RTV and its nanocomposites have multi-step degradation reaction chemistry and addition of nanoparticles made the materials “looser” and more complex (Fig. 14).
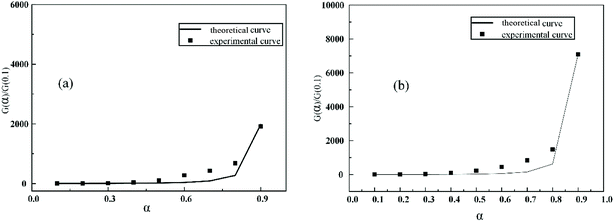 |
| | Fig. 14 Theoretical master-plots of G(α)/G(0.5) against α and experimental master-plots of experimental values against α for (a) RTV and (b) 1% ZnO/RTV at 25 °C min−1. | |
Compared with existing literature on similar studies,27–33 nano ZnO for the enhancement of the thermal stability of RTV had not been studied. Table 7 briefly lists the improved properties of several nanocomposites compared with those of pure samples. It is obvious that nano ZnO enhanced the UV-shielding and thermal stabilities of different materials. As an outdoor hydrophobic coating, RTV was damaged by ultraviolet light and high temperatures, which could shorten its operating life. Many nano fillers were used to improve the thermal stability of RTV, such as SiC, SiO2, BN and so on, but only nano ZnO also improved its UV-shielding. Presently, the thermal decomposition kinetics of RTV have not been studied. The results in this paper provide a direction for improving the thermal properties of RTV material and revealing its thermal decomposition mechanism.
Table 7 Effects of different nano fillers on the properties of polymers
| Nano filler |
Polymer |
Improved performance |
| ZnO |
PMMA |
Thermal stability |
| POM |
Thermal and mechanical |
| PS |
UV-shielding and thermal stability |
| Epoxy |
UV-shielding |
| SiC |
RTV |
Thermal stability |
| SiO2 |
RTV |
Mechanical and thermal |
| BN |
RTV |
Resistance to tracking and erosion |
| TiO2 |
RTV |
Super-hydrophobic surface |
Conclusions
Nano ZnO-TCA composite particles were prepared through radical copolymerization. The reaction does not alter the crystalline structure or size of the ZnO nanoparticles. The composite nanoparticles improved the thermal stability of RTV polymer to a certain extent, while agglomeration of particles was not conducive to thermal stability. The average Eα values of RTV and 1% ZnO/RTV, achieved by the FWO method, are 144.92 kJ mol−1 and 146.78 kJ mol−1, respectively. It was found that the order of reaction model provides a good description of the decomposition reaction rate. The obtained kinetics model for two RTV systems exhibited elevation of kinetic exponent when RTV was filled with nano ZnO-TCA.
Conflicts of interest
There are no conflicts to declare.
Abbreviations
| RTV | Room temperature vulcanized silicone rubber |
| TCA | Titanate coupling agent |
Acknowledgements
The financial and technical support of the National Engineering Laboratory Open Fund Project for Ultra High Voltage Engineering Technology (Kunming, Guangzhou, NEL201710) is also acknowledged.
References
- J. Sawai, Quantitative evaluation of antibacterial activities of metallic oxide powders (ZnO, MgO and CaO) by conductimetric assay, J. Microbiol. Methods, 2003, 54(2), 177–182 CrossRef CAS PubMed.
- M. N. Xiong, G. X. Gu, B. You and L. M. Wu, Preparation and characterization of poly(styrene butylacrylate) latex/nano-ZnO nanocomposites, J. Appl. Polym. Sci., 2003, 90(7), 1923–1931 CrossRef CAS.
- N. S. Ramgir, I. S. Mulla, K. Vijayamohanan, D. J. Late, A. B. Bhise, M. A. More and D. S. Joag, Appl. Phys. Lett., 2006, 88, 042107 CrossRef.
- N. S. Ramgir, D. J. Late, A. B. Bhise, M. A. More, I. S. Mulla, D. S. Joag and K. Vijayamohanan, J. Phys. Chem. B, 2006, 110, 18236–18242 CrossRef CAS PubMed.
- K. K. Naik, R. Khare, D. Chakravarty, M. A. More, R. Thapa, D. J. Late and C. S. Rout, Appl. Phys. Lett., 2014, 105, 233101 CrossRef.
- D. J. Late, P. Misra, B. N. Singh, L. M. Kukreja, D. S. Joag and M. A. More, Appl. Phys. A: Mater. Sci. Process., 2009, 95, 613–620 CrossRef CAS.
- L. F. Wu, X. M. Wang, L. Ning, J. J. Han, Z. Wan and M. Lu, Improvement of silicone rubber properties by addition of nano-SiO2 particles, J. Appl. Biomater. Funct. Mater., 2016, 14, S11–S14 CrossRef CAS PubMed.
- X. F. Wei, J. C. Wang and Y. Zhao, Study on the structure and properties of RTV/FR-DOMt nanocomposites, J. Exp. Nanosci., 2016, 11(13), 1058–1073 CrossRef CAS.
- J. J. Wang, G. Z. Li, L. J. Feng, X. L. Chao, K. Zhao and Y. N. Feng, Nano-graphite controlling properties of novel composites with damping-absorption functions and storage-loss behaviors: nano-graphite/PZT-PMN-PNN/RTV, Curr. Appl. Phys., 2017, 17(2), 130–136 CrossRef.
- Y. Liu, D. Zhang, H. Xu, S. M. Aie-Emran and B. X. Du, Characteristic Analysis of Surface Damage and Bulk Micro-Cracks of SiR/SiO2 Nanocomposites Caused by Surface Arc Discharges, IEEE Trans. Dielectr. Electr. Insul., 2016, 23(4), 2102–2109 CAS.
- B. X. Du and H. Xu, Effects of Thermal Conductivity on dc Resistance to Erosion of Silicone Rubber/BN Nanocomposites, IEEE Trans. Dielectr. Electr. Insul., 2014, 21(2), 511–518 CAS.
- J. J. Park and J. Y. Lee, Effect of Epoxy- modified Silicone-treated Micro-/Nano-Silicas on the Electrical Breakdown Strength of Epoxy/Silica Composites, IEEE Trans. Dielectr. Electr. Insul., 2017, 24(6), 3794–3800 CAS.
- J. L. Li, C. Peng, Z. W. Li, Z. J. Wu and S. C. Li, The improvement in cryogenic mechanical properties of nano-ZrO2/epoxy composites via surface modification of nano-ZrO2, RSC Adv., 2016, 6(66), 61393–61401 RSC.
- H. W. He, K. X. Li, J. Wang, G. H. Sun, Y. Q. Li and J. L. Wang, Study on thermal and mechanical properties of nano-calcium carbonate/epoxy composites, Mater. Des., 2011, 32(8–9), 4521–4527 CrossRef CAS.
- M. A. Rafiee, J. Rafiee, Z. Wang, H. H. Song, Z. Z. Yu and N. Koratkar, Enhanced Mechanical Properties of Nanocomposites at Low Graphene Content, ACS Nano, 2009, 3(12), 3884–3890 CrossRef CAS PubMed.
- B. X. Du, T. Han and J. G. Su, Tree Characteristics in Silicone Rubber/SiO2 Nanocomposites under Low Temperature, IEEE Trans. Dielectr. Electr. Insul., 2014, 21(2), 503–510 CAS.
- Y. H. Lee, M. Cho, J. D. Nam and Y. Lee, Effect of ZnO particle sizes on thermal aging behavior of natural rubber vulcanizates, Polym. Degrad. Stab., 2018, 148, 50–55 CrossRef CAS.
- P. Yang, Y. S. Wu, H. F. Xu, X. X. Xu, L. Q. Zhang and P. Li, Molecular dynamics simulation of thermal conductivity for the TiO2/ZnO nano-film interface, Acta Phys. Sin., 2011, 60(6), 066601 Search PubMed.
- Z. H. Wang, Y. L. Lu, J. Liu, Z. M. Dang, L. Q. Zhang and W. M. Wang, Preparation of Nano-Zinc Oxide/EPDM Composites with Both Good Thermal Conductivity and Mechanical Properties, J. Appl. Polym. Sci., 2011, 119(2), 1144–1155 CrossRef CAS.
- Y. Zhao, Y. K. Yan, A. Kumar, H. Wang, W. D. Porter and S. Priya, Thermal conductivity of self-assembled nano-structured ZnO bulk ceramics, J. Appl. Phys., 2012, 112(3), 034313 CrossRef.
- P. Yang, L. Q. Zhang, H. Y. Yang, D. J. Liu and X. L. Li, Experiment and prediction on thermal conductivity of Al2O3/ZnO nano thin film interface structure, Bull. Mater. Sci., 2014, 37(3), 449–454 CrossRef CAS.
- R. Li, J. Z. Pei and C. L. Sun, Effect of nano-ZnO with modified surface on properties of bitumen, Constr. Build. Mater., 2015, 98, 656–661 CrossRef.
- T. T. X. Hang, N. T. Dung, T. A. Truc, N. T. Duong, B. V. Truoc, P. G. Vu, T. Hoang, D. T. M. Thanh and M. G. Olivier, Effect of silane modified nano ZnO on UV degradation of polyurethane coatings, Prog. Org. Coat., 2015, 79, 68–74 CrossRef CAS.
- Z. B. Man, L. Deng, M. Yang, Y. H. Chen and Z. J. Jin, Effect of In Situ Surface-Modified Nano-Zinc Oxide on the Structure and Properties of Conventional Vulcanization in Natural Rubber, Rubber Chem. Technol., 2014, 87(1), 21–30 CrossRef CAS.
- S. C. Turmanova, S. D. Genieva, A. S. Dimitrova and L. T. Vlaev, Non-isothermal degradation kinetics of filled with rise husk ash polypropene composites, eXPRESS Polym. Lett., 2008, 2(2), 133–146 CrossRef CAS.
- R. Kaur, P. Gera, M. K. Jha and T. Bhaskar, Pyrolysis kinetics and thermodynamic parameters of castor (Ricinus communis) residue using thermogravimetric analysis, Bioresour. Technol., 2018, 250, 422–428 CrossRef CAS PubMed.
- D. K. Cai, X. S. Wen, L. Lan and J. H. Yu, Study on RTV silicone rubber/SiO2 electrical insulation nanocomposites, Proceedings of the 2004 IEEE International Conference on Solid Dielectrics, 2004, vol. 1 and 2, pp. 800–803 Search PubMed.
- D. Z. Chen, Y. Liu and C. Huang, Synergistic effect between POSS and fumed silica on thermal stabilities and mechanical properties of room temperature vulcanized (RTV) silicone rubbers, Polym. Degrad. Stab., 2012, 97(3), 308–315 CrossRef CAS.
- M. M. Demir, M. Memesa, P. Castignolles and G. Wegner, PMMA/zinc oxide nanocomposites prepared by in situ bulk polymerization, Macromol. Rapid Commun., 2006, 27(10), 763–770 CrossRef CAS.
- W. Gao, Q. Wang, S. Y. Yang, X. D. Deng and Z. M. Xie, Reinforcing action of RTV silicone rubber by calcium carbonate and silicon carbide fillers, Acta Polym. Sin., 2000, 1, 1–4 Search PubMed.
- Y. H. Hu, C. Y. Chen and C. C. Wang, Viscoelastic properties and thermal degradation kinetics of silica/PMMA nanocomposites, Polym. Degrad. Stab., 2004, 84(3), 545–553 CrossRef CAS.
- S. C. Liufu, H. N. Xiao and Y. P. Li, Thermal analysis and degradation mechanism of polyacrylate/ZnO nanocomposites, Polym. Degrad. Stab., 2005, 87(1), 103–110 CrossRef CAS.
- S. Wacharawichanant, S. Thongyai, A. Phutthaphan and C. Eiamsam-Ang, Effect of particle sizes of zinc oxide on mechanical, thermal and morphological properties of polyoxymethylene/zinc oxide nanocomposites, Polym. Test., 2008, 27(8), 971–976 CrossRef CAS.
|
| This journal is © The Royal Society of Chemistry 2019 |
Click here to see how this site uses Cookies. View our privacy policy here.  Open Access Article
 ,
Congzhen Xie*,
Leilei Zeng and
Huasong Xu
![[thin space (1/6-em)]](https://www.rsc.org/images/entities/char_2009.gif) :
:![[thin space (1/6-em)]](https://www.rsc.org/images/entities/char_2009.gif) 3 in acetone solution. After mixing in a high-speed mechanical agitator for two hours at 30 °C, the mixed liquor was suction filtered and rinsed 3 times with anhydrous ethanol. Finally, the modified nanoparticles were dried in a vacuum oven at 130 °C for 24 h.
3 in acetone solution. After mixing in a high-speed mechanical agitator for two hours at 30 °C, the mixed liquor was suction filtered and rinsed 3 times with anhydrous ethanol. Finally, the modified nanoparticles were dried in a vacuum oven at 130 °C for 24 h.
![[thin space (1/6-em)]](https://www.rsc.org/images/entities/char_2009.gif) cos(θ))
cos(θ))


![[thin space (1/6-em)]](https://www.rsc.org/images/entities/char_2009.gif) exp(0.0156u)
exp(0.0156u)


![[thin space (1/6-em)]](https://www.rsc.org/images/entities/char_2009.gif) exp(−144.29 × 10³/(RT))(1 − α)3.84
exp(−144.29 × 10³/(RT))(1 − α)3.84![[thin space (1/6-em)]](https://www.rsc.org/images/entities/char_2009.gif) exp(−146.78 × 10³/(RT))(1 − α)4.50
exp(−146.78 × 10³/(RT))(1 − α)4.50


