 Open Access Article
Synthesis of a novel isatin and ethylenediamine modified resin and effective adsorption behavior towards Orange G
Chai Yin†
ab,
Chao Xu† ab,
Wenhao Yua,
Yuxiang Jiab,
Weizhi Sun
 *b,
Guizhong Zhou*a and
Mo Xianb
aQingdao University of Science & Technology, Qingdao 266042, China. E-mail: zhougz@qust.edu.cn; Tel: +86-532-84022517
bKey Laboratory of Biobased Materials, Qingdao Institute of Bioenergy and Bioprocess Technology, Chinese Academy of Sciences, Qingdao 266101, China. E-mail: sunwz@qibebt.ac.cn; Tel: +86-135-83270481
First published on 8th January 2019
Abstract
In this study, a novel crosslinked resin 135-I-EDA modified by isatin and ethylenediamine was synthesized through two continuous functionalization steps using chloromethylated styrene-divinylbenzene copolymer as the substrate. In the first step, the cross-linking reaction and isatin incorporation were realized in a creative one-pot reaction using Friedel–crafts reaction in the presence of isatin to give resin 135-I; in the second step, ethylenediamine was successfully introduced on the carbonyl of the modified isatin to further increase the chemically interacting sites. The double-modified resin 135-I-EDA displayed the best adsorption performance (113.38 mg g−1) towards Orange G, which is 1.99 times and 3.49 times as much as that of 135-I (56.94 mg g−1) and commercial resin H-103 (32.51 mg g−1) respectively. This is attributed to its superior porous structure formed in the Friedel–crafts reaction and multiple modified groups in isatin and ethylenediamine. π–π conjugation and hydrogen bonding are the main driving forces for the adsorption. The pseudo-second-order rate equation characterizes the adsorption kinetic curves well and 135-I-EDA displayed the fastest adsorption rate. The study also proved that the 135-I-EDA has a better adsorption capacity for OG in more acidic solution, at higher temperature and higher salinity, which provides a basis for the treatment of industrial dye wastewater.
1. Introduction
Dye pollutants from the dyestuff manufacturing, leather tanning, printing, ink, and textile industries are important sources of environmental contamination. Nowadays, about 10![[thin space (1/6-em)]](https://www.rsc.org/images/entities/char_2009.gif) 000 different dyes are produced worldwide, for a global production of 7.105 tons per year1 and more than 50% of all dyes in common use are azo dyes due to their chemical stability and versatility.2 Azo dyes, characterized by the presence of one or more azo groups (–N
000 different dyes are produced worldwide, for a global production of 7.105 tons per year1 and more than 50% of all dyes in common use are azo dyes due to their chemical stability and versatility.2 Azo dyes, characterized by the presence of one or more azo groups (–N![[double bond, length as m-dash]](https://www.rsc.org/images/entities/char_e001.gif) N–) bound to aromatic rings, are the largest and most important class of synthetic organic dyes.3 Most of them are non-biodegradable, toxic and potentially carcinogenic in nature.4 Orange G, a mono azo dye, used as a food colourant, tends to be disposed of in industrial wastewater and poses a severe health threat to human beings.5
N–) bound to aromatic rings, are the largest and most important class of synthetic organic dyes.3 Most of them are non-biodegradable, toxic and potentially carcinogenic in nature.4 Orange G, a mono azo dye, used as a food colourant, tends to be disposed of in industrial wastewater and poses a severe health threat to human beings.5
The conventional techniques for the treatment of dye-containing solutions including chemical oxidation,6 electrochemical methodology,7,8 biodegradation9,10 were limited by a variety of disadvantages, such as high cost and energy consumption, long processing period, and by-products due to incomplete degradation and other drawbacks.11,12 Compared with the above processes, adsorption is often considered as a simple and efficient technique. The adsorbents tested in the literature included natural or synthetic products such as bentonite,13 chitosan,14 palm shell,15 activated carbon,16,17 magnetic biochar18–21 and low-cost non-conventional materials like agricultural wastes, bio-adsorbents and industry waste products, etc.22 Considering the low cost, high efficiency, stability of the adsorbing characteristics or restrictions on the origin of the adsorbents, another suitable adsorbent still needs to be developed.
In the past two decades, synthetic resin adsorbents have often been regarded as an alternative of other adsorbents,23–25 owing to their high specific surface area, strong mechanical strength and tunable porous texture. However, the adsorption capacity of hyper-crosslinked resins mainly depends on physical interaction and is greatly affected by the BET surface area, which shows restriction on adsorbates with large polarity and good water solubility. To overcome the above-mentioned drawbacks, chemical modifications of hyper-crosslinked resins by the introduction of multiple functional groups including amine, hydroxyl, carbonyl and carboxyl26–28 are widely employed.
In this work, a novel crosslinked resin 135-I-EDA modified by isatin and ethylenediamine was synthesized through two continuous functionalization steps using chloromethylated styrene-divinylbenzene copolymer as the substrate. The innovation of this paper is the one-pot method to introduce isatin, combining the introduction of isatin with the cross-linking reaction in the same time. The one-pot reaction not only allows the resin to obtain a higher specific surface area, but also introduces functional groups, and these functional groups can also be modified secondarily, on the basis of which ethylenediamine is introduced. Herein, with the attempt to gain some insight into the adsorbing mechanism of sulfonic dye, the adsorption behaviours of the 135-I-EDA resin towards OG were carefully investigated based on its distinctive chemical properties. Kinetic and thermodynamic studies were also carried out for further understanding of the adsorption mechanism. The factors influencing water environment including pH, salinity and temperature were also studied in this paper, which provided the basis for removal of industrial dye wastewater.
2. Materials and methods
2.1 Materials
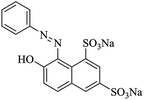
Chloromethylated styrene-divinylbenzene copolymer (CMPS), with chlorine content of 17.8%, was purchased from Zhengzhou diligent technology Co. Ltd. Commercial resin, H-103 was obtained from Amberlite. Nitrobenzene (NB), DMF (N,N-dimethylformamide), aluminum chloride, ethanediamine (EDA) and isatin (C8H5NO2) were purchased from Sinopharm Chemical Reagent Co. Ltd. The characteristic of dye used is listed in Table 1. The name of dye Orange G was abbreviated to OG. The dye came from commercial source and was used without further purification.2.2 Synthesis of the resins
2.3 Adsorption experiments
| Qe = (C0 − Ce)V/W | (1) |
2.4 Adsorption kinetics
For kinetic adsorption, about 0.2 g of 135-I-EDA was introduced into 200 mL of OG aqueous system (1000 mg L−1) in a conical flask, and mechanically stirred at 303 K and 180 rpm for present time.2.5 Effect of temperature
The effect of the temperature on OG sorption using 135-I-EDA was studied by mixing the resin with the dye solution (C0 = 100–1000 mg L−1) for 24 h at three different temperatures, 293, 303 and 313 K. The samples were filtered, and the concentration of solution was determined by the analysis of absorbance value.2.6 Effect of coexisting impurities
2.7 Analysis
The resin was characterized by Fourier transform infrared spectroscopy (FT-IR Nicolet iN10 IR Microscope, Thermo Fisher, USA), elemental analysis (Vario EL Cube, GmbH, Germany), SEM, XPS30 and N2 adsorption (ASAP2020M+C, Micromeritics, USA). The concentration of in the aqueous solution was determined by UV-Vis spectrophotometer (Varian).3. Results and discussion
3.1 Characterization of resins
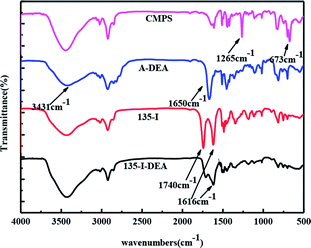
In addition, there are two new peaks32,33 appeared at 1650 cm−1 and 3431 cm−1 in A-EDA, which were ascribed to the stretching vibrations of the N–H group, indicating that amine was successfully introduced into the A-EDA. There appears to be a strong band with frequency at 1740 cm−1 and 1616 cm−1 for the obtained resin, 135-I, which was assigned to the carbonyl group stretching of isatin. After amination reaction of 135-I with ethylenediamine, it is obvious that the C![[double bond, length as m-dash]](https://www.rsc.org/images/entities/char_e001.gif) O stretching at 1740 cm−1 was disappeared in 135-I-EDA, and this disappeared band may be resulted from the introduction of amine.
O stretching at 1740 cm−1 was disappeared in 135-I-EDA, and this disappeared band may be resulted from the introduction of amine.
| Resin | C (%) | H (%) | N (%) |
|---|---|---|---|
| a %: weight percentage. | |||
| CMPS | 72.86 | 7.89 | — |
| A-EDA | 82.77 | 10.30 | 3.57 |
| 135-0.2I | 81.84 | 8.18 | 1.04 |
| 135-0.5I | 80.15 | 6.68 | 1.23 |
| 135-0.8I | 78.88 | 8.21 | 1.48 |
| 135-I | 82.68 | 6.19 | 1.59 |
| 135-2I | 81.42 | 6.21 | 1.61 |
| 135-I-EDA | 78.66 | 5.17 | 3.92 |
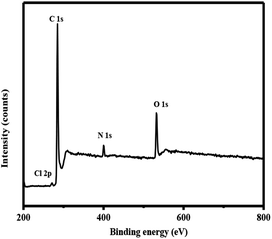
The peaks at 285.0 eV, 400.5 eV and 400.6 eV for resin were ascribed to C 1s, N 1s and O 1s, respectively.30,34 The existence of N and O elements further proves the introduction of isatin and EDA.
3.2 Adsorption behaviour of the resins
The resins with different contents of isatin were used for adsorption comparison of OG. It is can be concluded from the reaction that with the change of quantity of isatin, the mount of amine is change accordingly. As it shown in Fig. 6(A), the adsorption of OG range from 45.76 mg g−1 to 57.21 mg g−1 as the amount of isatin increased from 0.2 eq. to 2 eq. However, when the content of isatin is 2 eq., the adsorption amount of the corresponding OG is only increased by less 2% (56.94 mg g−1 to 57.21 mg g−1), which shows that saturation has basically reached at 1 eq. of isatin. Therefore, the resin of 135-I is used as the precursor to introduced the EDA. The introduction of amino group created new chemical interacting sites for the adsorbate, leading to an enhancement in adsorption capacity (Fig. 6(B)). Therefore, if more amino groups or carbonyl groups were introduced, the adsorption capacity would be not further increased. Hence, the resin of 135-I and 135-I-EDA were further studied.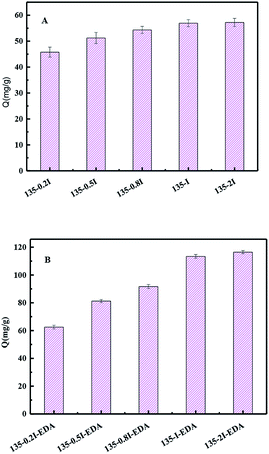 | ||
| Fig. 6 Comparison of adsorption capacity toward OG with different content of isatin (A) and EDA (B) resins. | ||
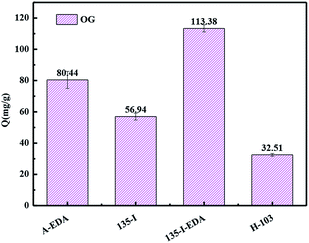
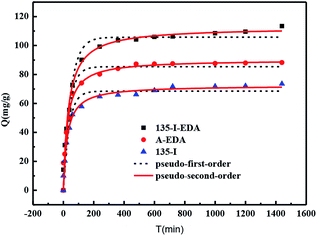
All the three resins displayed notable improvement for the adsorption of OG compared with commercial resin H-103. The best result came from 135-I-EDA, the capacity reached 113.38 mg g−1 (Fig. 7), which is 3.49 times, 1.99 times and 1.41 times as much as that of the resin H-103, 135-I and A-EDA respectively.
The great enhancement is attributed to the introduction of chemical interacting sites and its advantage in structure. As shown in Table 3, compared to CMPS, the BET surface area of 135-I increased to 401.50 m2 g−1 from 20.63 m2 g−1, and 135-I-EDA increased to 674.00 m2 g−1 from 401.50 m2 g−1 compared to 135-I, therefore, the process of introducing isatin followed by amine resin increased specific surface area of 135-I-EDA.
| Resin | SBET (m2 g−1) | Pore volume (cm3 g−1) | Average pore size (nm) |
|---|---|---|---|
| CMPS | 20.6 | 0.85 | 26.00 |
| A-EDA | 57.9 | 0.53 | 36.66 |
| 135-I | 401.5 | 0.64 | 6.18 |
| 135-I-EDA | 674.0 | 0.80 | 4.73 |
| H-103 | 1187.0 | 1.02 | 3.45 |
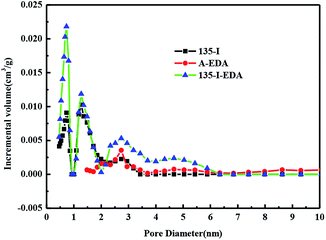
Moreover, the pore size of 135-I-EDA decreased from 26.0 nm to 4.73 nm. Pore volume of 135-I-EDA was larger than those of A-EDA and 135-I in micropore (Fig. 8). According to the micropores filling mechanism, micropore is fit for adsorbate–adsorbent interaction.35
As shown in Table 4, detailed analysis on the distribution of pores showed that 135-I-EDA exhibits great advantage over 135-I in the microporous area (0–2 nm). The BET surface area and pore volume of 135-I-EDA in 0–2 nm are 454.23 m2 g−1 and 0.175 cm3 g−1 respectively, much larger than 135-I's 248.49 m2 g−1 and 0.118 cm3 g−1. Micropore area is critical for interaction between adsorbate and adsorbent according to micropore filling theory,36 as the bigger mesopores and macropores are more responsible for intra-particle diffusion. The remarkable improvement in micropore BET surface area and pore volume of 135-I-EDA contributes to its outstanding adsorption ability. The increase in small pores will definitely improve the adsorption efficiency. It can be seen that the specific surface area and pore volume of H-103 are higher than those of 135-I and 135-I-EDA, but the adsorption amount of H-103 on OG was lower than that of the synthesized resins. H-103 is a macroporous resin with no functional groups, and its main function is physical adsorption. Although physical adsorption plays a significant role in the adsorption of non-functional resins with large surface area, the introduction of these functional groups increases the polarity and chemical sites of resin, improving chemical adsorption selectivity and adsorption capacity.
| Pore diameter (nm) | 0–1 | 1–2 | 2–3 | Total | |
|---|---|---|---|---|---|
| BET (m2 g−1) | 135-I | 170.37 | 78.12 | 8.21 | 401.54 |
| 135-I-EDA | 374.44 | 79.79 | 17.82 | 674.00 | |
| H-103 | 445.83 | 316.01 | 23.75 | 1187.00 | |
| Volume (cm3 g−1) | 135-I | 0.05 | 0.06 | 0.01 | 0.64 |
| 135-I-EDA | 0.12 | 0.05 | 0.02 | 0.80 | |
| H-103 | 0.17 | 0.27 | 0.03 | 1.32 |
Hydrophobic effect, π–π conjugation, hydrogen bonding, and electrostatic interactions are the most representative interactions present in the chemical adsorption by porous polymeric adsorbents in aqueous phase, and the exact strength of the forces depends on the details of the species involved, typically for the adsorbates with certain functional groups.37
The process of synthesizing 135-I-EDA increases both the specific surface area and functional groups. The carbonyl group introduced by isatin and amine groups from the later amination could form hydrogen bonds with the active hydrogen atoms. The π–π interaction is one of the main driving forces for the adsorption of chemicals with benzene rings on the surface of 135-I-EDA.38 There is no doubt about the contribution of π–π interaction between OG and benzene rings of 135-I-EDA, as each hydrogen atom in benzene owns a π electron orbit perpendicular to polymeric adsorbent surface.
Therefore, the strength of π–π interaction is expected to enhance with quantity increase of aromatic rings,39 promoting the formation of hydrogen bonds.
Hydrogen bonding is one mechanism for the adsorption of organic compounds on carbon-based adsorbents.40. The hydrogen atom of the amide group and the oxygen atom of the carbonyl group of the isatin might act as hydrogen donor and acceptor respectively and form hydrogen bonding with the oxygen atom and active hydrogen of the OG through the water molecules,41 which is advantageous to the adsorption on the resin.39 Electrostatic interaction is another kind of possible adsorption mode. Sulfonyl group is supposed to completely dissociate in water and the protonated amino group in the resin is also capable of associating with the dissociated sulfonyl group. Therefore, the difference about adsorption amounts between new synthesized resin and H-103 may be attributed by the strong chemical effects of π–πinteraction, acid–base interaction and hydrogen bonding between adsorbents and OG. Comparatively, H-103, which relies on physical adsorption shows lower adsorption capacity due to the lack of functional groups for chemical interaction.
3.3 Kinetic adsorption
Pseudo-first-order rate and pseudo-second-order rate models were employed to interpret the adsorbing quantity.42,43
log(Qe − Qt) = log![[thin space (1/6-em)]](https://www.rsc.org/images/entities/char_2009.gif) Qe − (K1t)/2.303 Qe − (K1t)/2.303
| (2) |
| t/Qt = 1/K2Q2e + t/Qe | (3) |
Fig. 9 shows the kinetic adsorption curves of synthesized resins towards OG. The adsorption rate of the three resins increased fast within the first 20 min, and then the adsorption capacity basically reached equilibrium after 300 minutes. But 135-I-EDA displayed the best adsorption performance among the three resins. As shown in Table 5, the pseudo-second-order rate equation fitted the data better due to the higher correlation coefficient R2, which suggests that the rate-limiting factor is primarily the chemical adsorption. The rate constant follows the sequence: 135-I-EDA > A-EDA > 135-I, therefore, the resin of 135-I-EDA not only exhibited the best adsorption capacity among the three resins, but also displayed the fastest adsorbing rate, which was probably attributed to the conjunction of proper porous structure with chemical modification.
| Adsorbents | Pseudo-first-order model | Pseudo-second-order model | ||
|---|---|---|---|---|
| K1 (10−2) | R2 | K2 (10−4) | R2 | |
| 135-I | 2.11 | 0.97 | 2.64 | 0.99 |
| A-EDA | 2.57 | 0.96 | 4.56 | 0.98 |
| 135-I-EDA | 2.68 | 0.97 | 5.29 | 0.99 |
For the adsorption of OG onto the adsorbent in aqueous solution, two diffusion steps are necessary: OG molecule transfers from water onto the resin surface across the boundary layer (film diffusion) and the diffusion in the intra-particle pore (intra-particle diffusion). To gain a deep understanding of the adsorption difference of 135-I-EDA, A-EDA and 135-I, the two diffusion processes were analysed in detail.
The kinetic data was first studied by the film diffusion model:44
| ln(1 − F) = −kft | (4) |
As shown by Fig. 10(A), kf, obtained from the slope of the film diffusion model, followed the sequence: A-EDA > 135-I > 135-I-EDA, which indicated a faster film diffusion rate occurred on A-EDA than other resins.
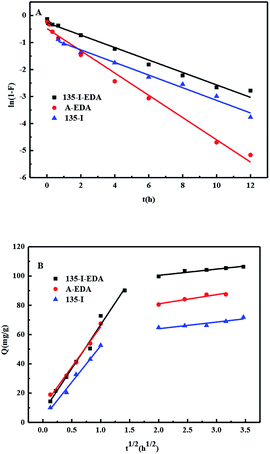 | ||
| Fig. 10 (A) The fitting of the film diffusion model and (B) the intra-particle diffusion model on 135-I-EDA, A-EDA and 135-I. | ||
The intra-particle diffusion model proposed by Weber and Morris was also employed to study the kinetic data:
 | (5) |
As is shown in Fig. 10(B), the plot of Qt vs. t 1/2 presented a two stage process, obviously, at the initial stage, both resins gave straight lines which did not pass through the origin, indicated that both of the film diffusion and the intra-particle diffusion were the rate limiting steps.44 As it shown in Table 6, the slope of the intra-particle diffusion model at the initial stage followed the sequence: 135-I-EDA > A-EDA > 135-I. Hence, it indicates that 135-I-EDA has the largest intra-particle diffusion rate.
| Resin | T (K) | Langmuir model | Freundlich model | ||||
|---|---|---|---|---|---|---|---|
| Qm | b | R2 | Kf | n | R2 | ||
| 135-I-EDA | 293 | 587.59 | 4.96 | 0.996 | 0.08 | 0.96 | 0.998 |
| 303 | 304.21 | 14.4 | 0.997 | 0.17 | 1.05 | 0.992 | |
| 313 | 270.82 | 91.83 | 0.989 | 1.02 | 1.42 | 0.993 | |
3.4 Effect of temperature
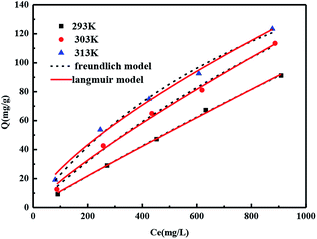
From the perspective of practical application, temperature is one of the important factors affecting adsorption.45 The effect of temperature on the equilibrium OG dye adsorption capacity of 135-I-EDA was investigated in the temperature range of 293–313 K at the different initial dye concentrations, with the constant amount of adsorbent of 0.02 g and the constant contact time of 24 h.Langmuir and Freundlich models are the two typical adsorption isotherm models for describing adsorption of organic compounds from aqueous solution. The models can be expressed as follows:
| Qe = bQ0Ce/(1 + bCe) | (6) |
| Qe = KfCe1/n | (7) |
Table 6 summarizes the corresponding correlated parameters such as Q0, b, Kf, and n as well as the correlation coefficients (R2). It is seen that Freundlich equation is more suitable for the adsorption of OG on the resins because the correlation coefficients are higher (R2 > 0.99), which shows the heterogeneity of the adsorbent surface, and the adsorption behaviour was a preferential process with n > 1.46 As shown in Fig. 11, elevated temperature and high initial concentration benefit the adsorption processes of 135-I-EDA, from 91.13 to 123.41 mg g−1 corresponding to a temperature change from 293 to 313 K. This indicates that the adsorption of OG on the 135-I-EDA is well responded at a high temperature of 313 K and is controlled by the endothermic process. On the one hand, with the increase of temperature, the decrease of the thickness of the boundary layer around the resin can promote the adsorption, which reduces the mass transfer resistance of the dye molecules in the boundary layer.41 Besides, the elevated temperature increases the kinetic energy of dye molecules to promotes the movement of dye molecules.47
3.5 Effect of coexisting impurities
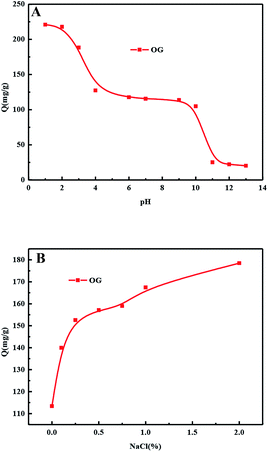
The actual wastewater is extremely complex, but it is a mixture of acid–base and salt in nature. In order to investigate the actual wastewater, the influence of co-existence factor (acid–base and salt) on resin adsorption is studied.In order to study the influence of inorganic salt on the adsorption behaviour of resin, different mass ratios (0–2%, relative to weight of solution) of NaCl were added to the solutions. The influence of NaCl at different initial concentrations of OG is shown in Fig. 13(B). For OG, a higher initial concentration of NaCl results in a larger adsorption capacity and this can be interpreted by the salting-out effect. The dielectric constant of the water molecules is much larger than that of OG molecules and the inorganic ions in the system will attract water molecules meanwhile reject acid molecules. After the water molecules are collected by the inorganic ions, the excluded adsorbate molecules are more inclined to be adsorbed by the adsorbent. Thus, a higher concentration of inorganic salt results in a lower solubility of organic solutes and this kind of hydrophobic interaction will increase the uptake amount of the adsorbent.
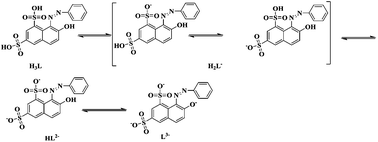
The pH is one of the most important parameters influencing the adsorption. Actually, the pH value can influence the form of the functional groups uploaded on the matrix of the resin.48 It also has an effect on the charge profile of the adsorbates, and consequently it induces different interactions between the adsorbent and the adsorbate.49 OG has two sulfonic acid groups and one phenolic hydroxyl group which means it will exhibit multiple existing states in aqueous solution with different H+ and OH− concentrations. As the increasing of pH, OG was transformed from molecular state to ionic state and in strong basic condition, it formed L3− ion with three negative charges. The state transformation will definitely affect its interaction with the resin and result in varied adsorption capacity.
As shown in Fig. 13(A), the pH influence displays a downward curve in general with four obvious points of inflection at pH = 2, 4, 9 and 11. Below pH = 2, OG exists as molecular state which facilitate the adsorption based on hydrophobic interaction acid–base interaction between the sulfonic acid and the amine groups in the resin. As shown in Fig. 12, the adsorption capacity of OG decreases rapidly at pH 2–4, indicating the dramatic state transformation from molecular state H3L to a mixture of H3L and H2L−. The ionization of the OG increased the hydrophilicity and solubility of the adsorbate and decreased the hydrophobic interaction, causing a decline in adsorption capacity. During pH 4–9, the curve exhibited as a slow downward trend for the coexisting H2L− and HL2− which probably have similar adsorption capacity. As the pH increases, H2L− was transformed into HL2− slowly without dramatic changes in the adsorption capacity. Another sharp decrease occurred during pH 9 to 11 for the transformation of HL2− into L3− and when the pH further increased above 11, the only existing state for OG is L3− which displayed very low affinity towards the neutral adsorbent.
Thus, the above synthetic resin may have good effect and practical significance in a complex solution simulating a real solution.
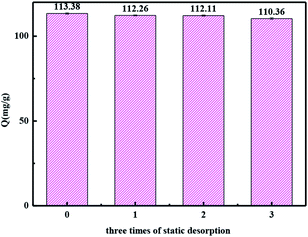
4. The stability of dyes removal
The most common methods for the dye desorption, such as solutions of HCl and NaOH at different concentrations (1%, 5%), HCl and NaOH (1%, 5%) in methanol solutions, acetone and DMF were studied. 5% HCl in methanol solutions was chosen as the desorption agent due to its best desorption efficiency. The results of the adsorption capacity after static adsorption and desorption three times are shown in Fig. 14. The adsorption capacity of the resin decreased by only 3% after three times of adsorption and desorption, indicating a good regeneration performance of the 135-I-EDA and the stability of dyes removal.As mentioned before, adsorption mechanism was discussed in the adsorption process. π–π interaction between OG and the benzene ring in the framework of the resin and hydrogen bonding between amine group and sulfonyl group of OG both contribute to its adsorption. Acid–base interaction is another kind of possible adsorption mode. Sulfonyl group is supposed to completely dissociate in water and the protonated amine group in the resin is also capable of associating with the dissociated sulfonyl group. Therefore, π–π interaction, hydrogen bonding and acid–base interaction exist simultaneously between 135-I-EDA and OG.
5. Conclusion
In this work, using CMPS as precursor, three types of resins with well-designed chemical properties were synthesized and employed for the adsorption of Orange G. A new isatin and ethylenediamine modified resin named 135-I-EDA displayed the best adsorption performance (113.38 mg g−1) towards OG, which is 1.99 times and 3.49 times as much as that of 135-I (56.94 mg g−1) and commercial resin H-103 (32.51 mg g−1) respectively. Detailed mechanism study in the basis of surface area analysis and carbonyl and amino functional groups was carried out. The results indicate that compared with its precursor resin, 135-I-EDA functionalized with amino group and carbonyl group can increase specific surface area by 1.68 times and improve its adsorption capacity by 1.99 times simultaneously. Hydrogen bonding, π–π interaction and acid–base interaction are the main mechanism for the adsorption of OG on 135-I-EDA. The pseudo-second-order rate equation characterizes the adsorption kinetic curves well and 135-I-EDA displayed the fastest adsorption rate. 135-I-EDA exhibits a better adsorption capacity for OG in lower pH, higher temperature and higher salinity, which can reach up to 220.99 mg g−1, 123.41 mg g−1 and 178.49 mg g−1 respectively.Based on the above results, we believed that, 135-I-EDA exhibiting higher capacity and good adsorption characteristic could serve as a potential choice for the acid dye OG removal from wastewater.
Conflicts of interest
There are no conflicts to declare.Acknowledgements
The research was supported by the Taishan Scholars Climbing Program of Shandong (No. tspd20150210) and Natural Science Foundation of Shandong Province (ZR2017LB027).References
- K. Qureshi, M. Z. Ahmad, I. A. Bhatti, M. Iqbal and A. Khan, Chem. Int., 2015, 1, 53–59 Search PubMed.
- M. Neamtu, I. Siminiceanu, A. Yediler and A. Kettrup, Dyes Pigm., 2002, 53, 93–99 CrossRef CAS.
- S. P. Sun, C. J. Li, J. H. Sun, S. H. Shi, M. H. Fan and Q. Zhou, J. Hazard. Mater., 2009, 161, 1052 CrossRef CAS PubMed.
- X. R. Xu and X. Z. Li, Sep. Purif. Technol., 2010, 72, 105–111 CrossRef CAS.
- M. Greluk and Z. Hubicki, Desalination, 2011, 278, 219–226 CrossRef CAS.
- V. K. Gupta and Suhas, J. Environ. Manage., 2009, 90, 2313–2342 CrossRef CAS PubMed.
- V. K. Gupta, R. Jain and S. Varshney, J. Colloid Interface Sci., 2007, 312, 292–296 CrossRef CAS PubMed.
- G. Bonyadinejad, M. Sarafraz, M. Khosravi, A. Ebrahimi, S. M. Taghavi-Shahri, R. Nateghi and S. Rastaghi, Korean J. Chem. Eng., 2016, 33, 189–196 CrossRef CAS.
- A. B. D. Santos, F. J. Cervantes and J. B. V. Lier, Bioresour. Technol., 2007, 98, 2369–2385 CrossRef PubMed.
- B. E. Barragán, C. Costa and M. C. Márquez, Dyes Pigm., 2007, 75, 73–81 CrossRef.
- Y. Qu, J. Zhou, J. Wang, Z. Song, L. Xing and X. Fu, Biodegradation, 2006, 17, 83 CrossRef CAS PubMed.
- S. Akazdam, M. Chafi, W. Yassine and B. Gourich, J. Mater. Environ. Sci., 2016, 8, 2993–3012 Search PubMed.
- N. Jović-Jovičić, A. Milutinović-Nikolić, P. Banković, Z. Mojović, M. Žunić, I. Gržetić and D. Jovanović, Appl. Clay Sci., 2010, 47, 452–456 CrossRef.
- M. E. Haddad, R. Slimani, R. Mamouni, S. Elantri and S. Lazar, J. Assoc. Arab Univ. Basic Appl. Sci., 2013, 14, 51–59 Search PubMed.
- S. Nizamuddin, N. S. Jayakumar, J. N. Sahu, P. Ganesan, A. W. Bhutto and N. M. Mubarak, Korean J. Chem. Eng., 2015, 32, 1789–1797 CrossRef CAS.
- V. K. Gupta, A. Mittal, V. Gajbe and J. Mittal, Ind. Eng. Chem. Res., 2006, 45, 1446–1453 CrossRef CAS.
- M. Ruthiraan, N. M. Mubarak, R. K. Thines, E. C. Abdullah, J. N. Sahu, N. S. Jayakumar and P. Ganesan, Korean J. Chem. Eng., 2015, 32, 446–457 CrossRef CAS.
- M. Ruthiraan, E. C. Abdullah, N. M. Mubarak and M. N. Noraini, J. Environ. Chem. Eng., 2017, 5, 1447–1455 CrossRef CAS.
- N. M. Mubarak, Y. T. Fo, H. S. Al-Salim, J. N. Sahu, E. C. Abdullah, S. Nizamuddin, N. S. Jayakumar and P. Ganesan, Int. J. Nanosci., 2015, 14, 1550009 CrossRef CAS.
- N. M. Mubarak, A. Kundu, J. N. Sahu, E. C. Abdullah and N. S. Jayakumar, Synthesis of palm oil empty fruit bunch magnetic pyrolytic char impregnating with FeCl3 by microwave heating technique, Biomass Bioenergy, 2014, 61, 265–275 CrossRef CAS.
- M. N. Noraini, E. C. Abdullah, R. Othman and N. M. Mubarak, Mater. Lett., 2016, 184, 315–319 CrossRef CAS.
- A. Bousher, X. Shen and R. G. J. Edyvean, Water Res., 1997, 31, 2084–2092 CrossRef CAS.
- Y. Yu, Y. Y. Zhuang, Z. H. Wang and M. Q. Qiu, Chemosphere, 2004, 54, 425–430 CrossRef CAS PubMed.
- C. Long, Z. Lu, A. Li, W. Liu and Z. Jiang, Sep. Purif. Technol., 2005, 44, 91–96 CrossRef CAS.
- A. Li, Q. Zhang, H. Wu, Z. Zhai, F. Liu, Z. Fei, C. Long, Z. Zhu and J. Chen, Adsorpt. Sci. Technol., 2004, 22, 807–820 CrossRef CAS.
- X. Wang, G. Li, D. Guo, Y. Zhang and J. Huang, J. Colloid Interface Sci., 2016, 470, 1–9 CrossRef CAS PubMed.
- Z. Fu, H. Li, L. Yang, H. Yuan, Z. Jiao, L. Chen, J. Huang and Y. N. Liu, Chem. Eng. J., 2015, 273, 240–246 CrossRef CAS.
- F. Maya and F. Svec, J. Chromatogr. A, 2013, 1317, 32–38 CrossRef CAS PubMed.
- L. Seid, D. Chouder, N. Maouche, I. Bakas and N. Barka, J. Taiwan Inst. Chem. Eng., 2014, 45, 2969–2974 CrossRef CAS.
- A. DeryłoMarczewska, J. Goworek, a. S. Pikus, E. Kobylas and W. Zgrajka, Langmuir, 2002, 18, 7538–7543 CrossRef.
- J. Huang, X. Jin, J. Mao, B. Yuan, R. Deng and S. Deng, J. Hazard. Mater., 2012, 217–218, 406–415 CrossRef CAS PubMed.
- G. Xiao, R. Wen, A. Liu, G. He and D. Wu, J. Hazard. Mater., 2017, 329, 77–83 CrossRef CAS PubMed.
- J. Huang, X. Jin and S. Deng, Chem. Eng. J., 2012, 192, 192–200 CrossRef CAS.
- Y. Liu, D. Huang, D. Di, H. Wang, X. Li and Y. Liu, Colloids Surf., A, 2017, 520, 166–172 CrossRef CAS.
- J. H. Huang, K. L. Huang, S. Q. Liu, A. T. Wang and C. Yan, Colloids Surf., A, 2008, 330, 55–61 CrossRef CAS.
- J. H. Huang, K. L. Huang, S. Q. Liu, A. T. Wang and C. Yan, Colloids Surf., A, 2008, 330, 55–61 CrossRef CAS.
- K. Yang and B. Xing, Cheminform, 2010, 110, 5989–6008 CAS.
- N. Fontanals, R. M. Marcé, P. A. Cormack, D. C. Sherrington and F. Borrull, J. Chromatogr. A, 2008, 1191, 118–124 CrossRef CAS PubMed.
- J. Fan, W. Yang and A. Li, React. Funct. Polym., 2011, 71, 994–1000 CrossRef CAS.
- X. Li, W. Chen, A. Qiwen Zhan, L. Dai, L. Sowards, A. Mark Pender and R. R. Naik, J. Phys. Chem. B, 2006, 110, 12621–12625 CrossRef CAS PubMed.
- M. Greluk and Z. Hubicki, Chem. Eng. J., 2011, 170, 184–193 CrossRef CAS.
- G. Mckay and Y. S. Ho, Process Biochem., 1999, 34, 451–465 CrossRef.
- Y. S. Ho and G. Mckay, J. Chem. Technol. Biotechnol., 1997, 213–222 Search PubMed.
- J.-H. Huang, K.-L. Huang, S.-Q. Liu, A. T. Wang and C. Yan, Colloids Surf., A, 2008, 330, 55–61 CrossRef CAS.
- Y. J. Xue, H. B. Hou and S. J. Zhu, Chem. Eng. J., 2009, 147, 272–279 CrossRef CAS.
- I. Langmuir, J. Chem. Phys., 2015, 40, 1361–1403 Search PubMed.
- Z. Aksu, A. İ. Tatlı and Ö. Tunç, Chem. Eng. J., 2008, 142, 23–39 CrossRef CAS.
- J. Huang, J. Colloid Interface Sci., 2009, 339, 296–301 CrossRef CAS PubMed.
- A. Ornek, M. Ozacar and I. A. Sengil, Biochem. Eng. J., 2007, 37, 192–200 CrossRef CAS.
Footnote |
| † These authors contributed equally to this work. |
| This journal is © The Royal Society of Chemistry 2019 |

