 Open Access Article
Boron/nitrogen co-doped carbon synthesized from waterborne polyurethane and graphene oxide composite for supercapacitors†
Rui Li,
Chuanli Qin,
Xuxu Zhang,
Zitong Lin,
Shixian Lv and
Xiankai Jiang *
*
School of Chemical Engineering and Materials, Heilongjiang University, Harbin 150080, P. R. China. E-mail: jiangxiankai@hlju.edu.cn
First published on 14th January 2019
Abstract
We report B/N co-doped carbon materials synthesized by an efficient and easy one-step carbonization method with ferric catalyst treatment from a precursor with boric acid treatment after the formation of the composite between waterborne polyurethane (WPU) and graphene oxide (GO). The nitrogen content was improved with the introduction of numerous melamine in the synthetic process of WPU. In addition, WPU possessed a repetitive basic unit urethane bond (–NHCOO); thus, nitrogen heteroatom could be efficiently introduced into the WPU/GO composite from WPU as a nitrogen-rich carbon. In addition, the specific surface area was increased by the boric acid treatment and washing process. The ferric catalyst treatment could prevent the formation of inert B–N bonds. Thus, the synthesized B/N co-doped carbon materials exhibited high specific capacitance (330 F g−1 at 0.5 A g−1), superior rate performance, and excellent cycling stability. Furthermore, the assembled symmetric supercapacitor displayed a good energy density (7.9 W h kg−1 at 505 W kg−1) and a good capacitance retention of about 89.9% after 5000 charge–discharge cycles in 6 M KOH electrolyte. Therefore, the as-prepared B/N co-doped carbon materials show a promising future in supercapacitor application.
1. Introduction
Supercapacitors have gained significant attention as an ideal energy storage apparatus for mobile devices, electric devices, and high-power equipment due to their fast charge–discharge rate, high power density, and long cycle life.1–3 In general, supercapacitors could be divided into two groups based on the mechanism of electrical energy storage: first, pseudocapacitance based on reversible redox reactions among electrode and electrolyte ions. Second, electrical double-layer capacitance through the electrochemical charge directional array on the electrode/electrolyte interface.4,5 At present, carbon-based materials have shown great significance in electrical double-layer capacitors owing to their high specific surface area, good electrical conductivity and prominent physicochemical stability.6,7 Nevertheless, the specific capacitance and energy density of the capacitors fail to be improved further due to the limitations of carbon-based material structures. Therefore, researchers have sought to apply effective pseudocapacitance to carbon-based materials to improve the electrochemical performance.In general, there are two approaches to introduce pseudocapacitance into carbon-based materials. First, pseudocapacitive materials are introduced into carbon-based materials to synthesize composites, such as metal oxides and conducting polymers. Second, the introduction is achieved by doping heteroatoms (N,8 O,9 B,10 S,11 or P12), which can introduce redox reactions (pseudocapacitive behavior) and enhance the capacitive performance.13–18 Doping heteroatoms into carbon-based materials could be considered as a better approach to increase the capacitive performance of supercapacitors without losing high power density and cycling stability as a result of the intrinsically-low conductivity and cycling stability of metal oxides and conducting polymers. In a general way, heteroatom-doped carbon (HDC) can be formed by two approaches: the first approach is post-treatment, where carbon-based materials are treated by reagents with heteroatoms, such as boric acid,19 ammonia,20 and urea.21 However, the heteroatoms formed on the surface of carbon-based materials have an unsteady state. The second approach is an in situ method, where heteroatom-doped carbon is prepared by direct carbonization through the carbon precursors with heteroatoms, such as ionic liquids, biomass, and polymers. As the in situ method can dope the stable heteroatoms into the bulk of carbon in a homogeneous and easy way, this method is considered as a promising approach. Liu et al.22 synthesized N/O co-doped porous carbon from Perilla frutescens through direct carbonization with high specific capacitance (270 F g−1 at 0.5 A g−1).
Currently, the performance of the pseudocapacitance by carbon-based materials has been efficiently improved by doping various heteroatoms. The co-doping of different heteroatoms, for instance, electron-deficient boron and electron-rich nitrogen, into carbon-based materials could form a subtle electronic structure relating to the synergetic effect among the heteroatoms. Thus, co-doped carbon-based materials could exhibit better capacitive property. In fact, great progress has been made in the research of co-doping nitrogen and boron into carbon-based materials. Gao et al.23 prepared boron and nitrogen co-doped activated carbon from precursors with boron and nitrogen after carbonization and a not-high specific capacitance was achieved (268 F g−1 at 0.1 A g−1). Dai et al.24 synthesized boron carbon nitride nanotubes from the precursor melamine as a single diborate via chemical vapor deposition (CVD) and a high specific capacitance was achieved (321 F g−1 at 0.2 A g−1). Fu et al.25 synthesized boron and nitrogen co-doped porous carbon via carbonization with the ferric catalyst treatment from a precursor including nitrogen-containing chitosan and boric acid and an excellent specific capacitance was achieved (313 F g−1 at 1 A g−1). Qin et al.26 used polyvinylpyrrolidone, melamine formaldehyde resin, urea, and boric acid to prepare a boron/nitrogen/oxygen co-doped carbon with high capacitive performance (238 F g−1 at 0.5 A g−1). The carbon-based materials with different heteroatoms require further improvement in their performance. Therefore, it is of great significance to prepare boron/nitrogen co-doped carbon-based materials with high electrochemical performance in an efficient and easy way.
Herein, B/N co-doped carbon materials were synthesized by an efficient and easy one-step carbonization method with ferric catalyst treatment from a precursor with boric acid treatment after the formation of composite between waterborne polyurethane (WPU) and graphene oxide (GO). The nitrogen content was improved with the introduction of numerous melamine in the synthetic process of WPU. In addition, WPU possessed a repetitive basic unit urethane bond (–NHCOO); thus, the nitrogen heteroatom could be efficiently introduced into the WPU/GO composite from WPU as a nitrogen-rich carbon. In addition, the specific surface area was increased by the boric acid treatment and washing process. The ferric catalyst treatment could prevent the formation of inert B–N bonds. Thus, the synthesized B/N co-doped carbon materials exhibited high specific capacitance (330 F g−1 at 0.5 A g−1), superior rate performance, and excellent cycling stability. Furthermore, the assembled symmetric supercapacitor displayed a good energy density (7.9 W h kg−1 at 505 W kg−1) and a good capacitance retention of about 89.9% after 5000 charge–discharge cycles in 6 M KOH electrolyte. Therefore, the prepared B/N co-doped carbon materials show a promising future in supercapacitor application.
2. Experimental
2.1 Preparation of waterborne polyurethane
All of the chemical reagents used in the experiments were of analytical reagent grade. First, 6.3 g of toluene-2,4-diisocyanate and 6.3 g of acetone were mixed uniformly into a three-necked round-bottom flask, followed by stirring at 80 °C with a stirring rate of 250 rpm. Then, 1.3 g of 2,2-bis(hydroxymethyl) propionic acid dissolved in NMP was added into the flask dropwise. Thereafter, 8.5 g of polycarbonate diol dispersed in acetone was added into the mixture dropwise. Subsequently, 0.6 g of trimethylolpropane and 0.6 g of melamine were added separately into the reactants dropwise to react for 1 h. The prepolymer was then cooled to ambient temperature and 0.95 g of triethylamine was introduced into the prepolymer to react for 20 min. Subsequently, an appropriate amount of deionized water was added and waterborne polyurethane aqueous dispersion was synthesized.2.2 Preparation of B/N co-doped carbon
GO was synthesized from natural graphite according to the modified Hummer's method27 and was diluted to a 5 mg mL−1 suspension with deionized water for the following experiments. Subsequently, waterborne polyurethane aqueous dispersion and GO suspension were mixed with a solid content ratio of 30![[thin space (1/6-em)]](https://www.rsc.org/images/entities/char_2009.gif) :
:![[thin space (1/6-em)]](https://www.rsc.org/images/entities/char_2009.gif) 1 at ambient temperature to form a homogeneous solution. Then, saturated boric acid and 1 M ferric chloride solution (molar ratio = 1
1 at ambient temperature to form a homogeneous solution. Then, saturated boric acid and 1 M ferric chloride solution (molar ratio = 1![[thin space (1/6-em)]](https://www.rsc.org/images/entities/char_2009.gif) :
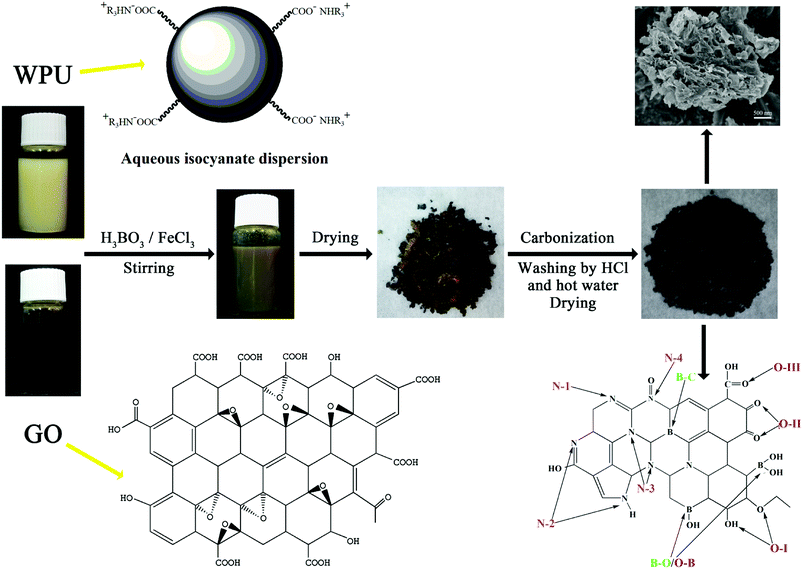
:![[thin space (1/6-em)]](https://www.rsc.org/images/entities/char_2009.gif) 1) were slowly added into the WPU/GO solution in sequence and ultrasound dispersed at ambient temperature for 1 h to prepare the precursor solution. Next, the precursor was dried at 60 °C for 24 h. Thereafter, the precursor was carbonized at 800 °C for 2 h at a heating rate of 5 °C min−1 in nitrogen atmosphere. Furthermore, the product was washed with 6 M HCl at ambient temperature for 6 h and boiled in deionized water at 80 °C for 6 h to remove the ferric catalyst and residual boron oxides. The final product was named WPU-GO-Fe-B. For comparison, WPU/GO solution containing saturated boric acid, WPU/GO solution containing 1 M ferric chloride solution, and pure WPU/GO solution were disposed by the same process as described above, and they were named WPU-GO-B, WPU-GO-Fe, and WPU-GO, respectively. The preparation process of WPU-GO-Fe-B is shown in Fig. 1.
1) were slowly added into the WPU/GO solution in sequence and ultrasound dispersed at ambient temperature for 1 h to prepare the precursor solution. Next, the precursor was dried at 60 °C for 24 h. Thereafter, the precursor was carbonized at 800 °C for 2 h at a heating rate of 5 °C min−1 in nitrogen atmosphere. Furthermore, the product was washed with 6 M HCl at ambient temperature for 6 h and boiled in deionized water at 80 °C for 6 h to remove the ferric catalyst and residual boron oxides. The final product was named WPU-GO-Fe-B. For comparison, WPU/GO solution containing saturated boric acid, WPU/GO solution containing 1 M ferric chloride solution, and pure WPU/GO solution were disposed by the same process as described above, and they were named WPU-GO-B, WPU-GO-Fe, and WPU-GO, respectively. The preparation process of WPU-GO-Fe-B is shown in Fig. 1.
2.3 Characterization
The morphology of the samples was observed using an emission scanning electron microscopy (SEM, S-4800, Hitachi, Japan) and an transmission electronic microscopy (TEM, JEM-2100, JEOL Ltd, Japan). The crystal structure of the samples was analyzed by X-ray diffraction (XRD, D8 Advance, Bruker, Germany). Raman spectra were examined using a Raman spectrometer (HR800, Jobin Yvon, French) at 457.9 nm. Fourier transform infrared spectra (FT-IR) were collected on a spectrometer (FT-IR, Equinox 55, Bruker, Germany). The surface elemental compositions of the samples were determined using X-ray photoelectron spectroscopy (XPS, ESCALAB 250, Thermo Fisher Scientific, UK). Nitrogen adsorption–desorption measurements were performed to characterize the porous structure of the samples using a physisorption instrument (ASAP 2020 HD88, Micromeritics, USA) at 77 K. The conventional Brunauer–Emmett–Teller (BET) method was used to derive the specific surface area. The pore size distributions were determined using the Barrett–Joyner–Halenda (BJH) method.2.4 Electrochemical measurements
For the three-electrode system, the electrochemical measurements of the samples were performed at ambient temperature in 6 M KOH aqueous electrolyte by an electrochemical workstation (CHI660E, Shanghai Chenhua, China). This system included a platinum electrode, a Hg/HgO electrode, and a measured electrode as the counter electrode, reference electrode, and working electrode, respectively. The working electrode was prepared by coating the slurry, incorporating the active material and polytetrafluoroethylene binder with a mass ratio of 95![[thin space (1/6-em)]](https://www.rsc.org/images/entities/char_2009.gif) :
:![[thin space (1/6-em)]](https://www.rsc.org/images/entities/char_2009.gif) 5 on a Ni-foam (1 cm × 1 cm). The working electrode was loaded with approximately 5 mg cm−2 of active material. The cyclic voltammetry (CV) curves were recorded in the potential range of −1.0 V to 0 V at different scan rates ranging from 1 mV s−1 and 200 mV s−1. The galvanostatic charge/discharge (GCD) tests were conducted at a potential of −1.0 V to 0 V at varying current densities. At the frequency range of 100 kHz to 10 mHz, electrochemical impedance spectroscopy (EIS) tests were conducted with an AC voltage of 10 mV at an open-circuit potential. The specific capacitance of the samples was calculated from GCD curves according to the equation:
5 on a Ni-foam (1 cm × 1 cm). The working electrode was loaded with approximately 5 mg cm−2 of active material. The cyclic voltammetry (CV) curves were recorded in the potential range of −1.0 V to 0 V at different scan rates ranging from 1 mV s−1 and 200 mV s−1. The galvanostatic charge/discharge (GCD) tests were conducted at a potential of −1.0 V to 0 V at varying current densities. At the frequency range of 100 kHz to 10 mHz, electrochemical impedance spectroscopy (EIS) tests were conducted with an AC voltage of 10 mV at an open-circuit potential. The specific capacitance of the samples was calculated from GCD curves according to the equation:| C = (I × Δt)/(m × ΔV) | (1) |
The cycling stability of the electrode materials was assessed by 2500 cycles CV tests at a scanning rate of 10 mV s−1. Then, its specific capacitance retention was analyzed.
For the two-electrode system, the assembled symmetric supercapacitor was composed of positive and negative electrodes made from active materials and the diaphragm from polypropylene. The working electrodes were prepared using the same process as described above. GCD tests were performed with a battery test instrument (CT2001A, Landiandianzi, China) with the potential range of 0 V to 1.0 V at varying current densities (1 A g−1, 2 A g−1, 3 A g−1, 5 A g−1, and 7 A g−1). The specific capacitances, energy density and power density of the symmetric supercapacitor were calculated from the GCD curves by the following equations:
| Cp = (I × Δt)/(m × ΔV) | (2) |
| Cs ≈ 4Cp | (3) |
| Ep = (Cp × ΔV2)/7.2 | (4) |
| P = (3600 × Ep)/Δt | (5) |
The cycling stability of symmetric supercapacitors was assessed by 5000 charge–discharge cycles with a current density of 5 A g−1. Then, its specific capacitance retention was analyzed.
3. Results and discussion
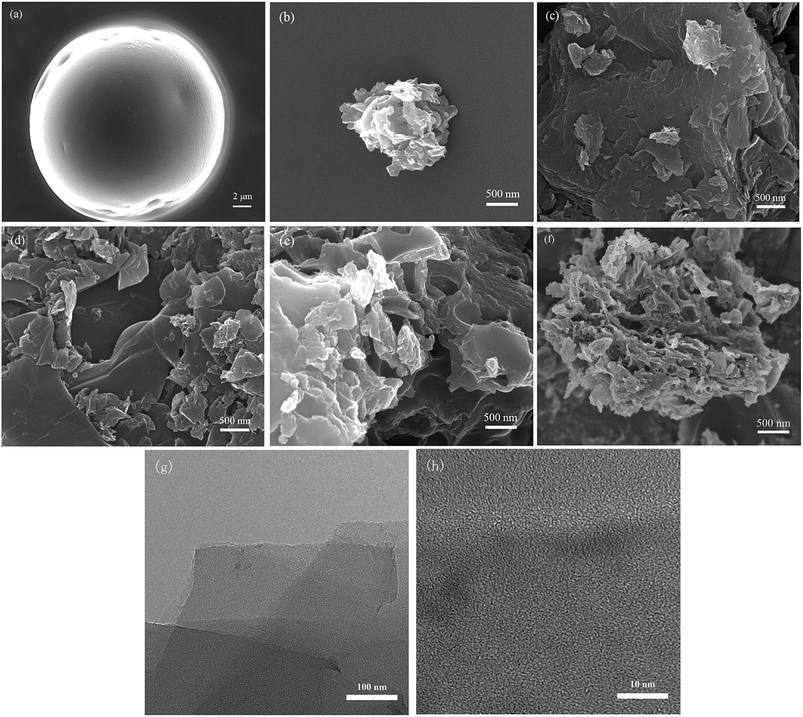
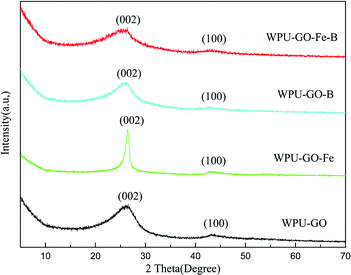
SEM images of the samples are shown in Fig. 2. The particles of waterborne polyurethane (Fig. 2a) in aqueous dispersion exhibited a spherical appearance with a diameter of approximately 20 μm. The irregular carbon particle from WPU (Fig. 2b) was formed because of the release of volatile substances (e.g. NH3, CO, CO2, H2O) during the carbonization process. Some carbon particles were observed in WPU-GO (Fig. 2c) and WPU-GO-Fe (Fig. 2d) after the carbonization of waterborne polyurethane on the graphene oxide lamella, while WPU-GO-Fe showed a defective structure due to the removal of ferric catalyst in the washing process. WPU-GO-B (Fig. 2e) showed a similar structure; nevertheless, the presence of pore structure could be clearly observed compared with the WPU-GO because of the removal of boron oxides in the washing process. WPU-GO-Fe-B (Fig. 2f) exhibited carbon particles on the graphene oxide lamella, and the carbon particle exhibited a more defective and disordered pore structure at high magnification. This structure could provide an interface for charge storage to improve the electrochemical performance of the electrical double-layer capacitance (EDLC). The TEM was further used to analyze the microscopic structure of WPU-GO-Fe-B. As shown in Fig. 2g, WPU-GO-Fe-B displays a multilayer graphitic nanosheets structure, indicating that the WPU/GO composite formed a layered architecture after carbonization, which could correspond with the above-mentioned SEM test of WPU-GO-Fe-B. In addition, the high-resolution image (Fig. 2h) exhibits a disordered, interpenetrating, worm-like nanopores distribution on the graphitic nanosheets. The porous structure provides a large number for storage to electrolyte ion, which could improve the capacitive performance.To visualize the change of the graphitization degree with different electrode materials, the XRD texts were analyzed, as shown in Fig. 3. Two diffraction peaks located at around 26° and 43° for all samples demonstrated the graphitic phase of the amorphous structure, which can be attributed to the (002) diffraction peak and (100) diffraction peak, respectively. Compared with WPU-GO, the (002) diffraction of WPU-GO-Fe was sharper, indicating that it could greatly improve the graphitization degree by adding the ferric catalyst. The (002) diffraction peak of WPU-GO-Fe-B was compared with that of WPU-GO-Fe, and the graphitization degree reduced due to the introduction of boric acid. According to the Bragg equation, WPU-GO-Fe-B, WPU-GO-B, WPU-GO-Fe, and WPU-GO showed (002) diffraction peaks at 2θ = 25.6°, 25.9°, 26.4°, and 26.2°, respectively, which corresponded to the graphitic interlayer spacing (d002) of 3.48 Å, 3.43 Å, 3.37 Å and 3.40 Å, respectively. By comparison, the diffraction peaks shifted leftward with larger graphitic interlayer spacing (d002). The introduction of heteroatoms B into the hexagonal crystalline structure might result in the change in the graphitic interlayer spacing.28
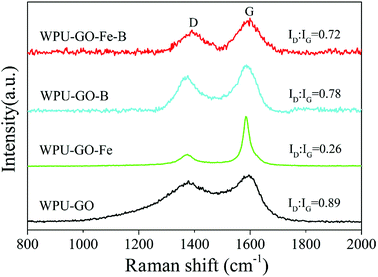
Raman spectra were used to further confirm the graphitic structure, and the results are shown in Fig. 4. There are two distinct peaks around 1380 cm−1 and 1590 cm−1 corresponding to the D band and G band, respectively. Generally, the D band can be attributed to the defect and disorder in carbon structure, while the G band indicates the ordered graphitic crystallites of carbon.29 The ratio of the D band and G band (ID/IG) correlates to the graphitization extent of carbon.30 Herein, the ID/IG ratios of WPU-GO-Fe-B, WPU-GO-B, WPU-GO-Fe, and WPU-GO were 0.72, 0.78, 0.26, and 0.89, respectively. The ID/IG ratio of WPU-GO-Fe was far below than that of WPU-GO, indicating that the graphitization degree of the carbon materials was significantly improved with the introduction of the ferric catalyst. Due to the structural defects by boric acid treatment, an increase in the ID/IG ratios of WPU-GO-Fe-B and WPU-GO-Fe was observed. WPU-GO-Fe-B with a relatively small ID/IG ratio showed better electronic conductivity,31 which could be demonstrated by EIS tests.
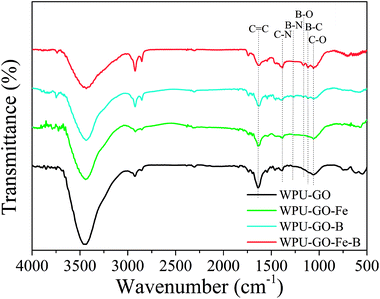
The functional groups of the samples were observed by FT-IR, and the results are shown in Fig. 5. The FT-IR spectra of WPU-GO and WPU-GO-Fe only showed three peaks at around 1070 cm−1, 1390 cm−1, and 1635 cm−1, corresponding to C–O stretching vibration, C–N stretching vibration and C![[double bond, length as m-dash]](https://www.rsc.org/images/entities/char_e001.gif) C stretching vibration, respectively.28,32 In the FT-IR spectra of WPU-GO-B, the peaks at 1053 cm−1, 1109 cm−1, 1168 cm−1, 1270 cm−1, 1385 cm−1, and 1632 cm−1 corresponded to the stretching vibrations of C–O, B–C, B–O, B–N, C–N, and C
C stretching vibration, respectively.28,32 In the FT-IR spectra of WPU-GO-B, the peaks at 1053 cm−1, 1109 cm−1, 1168 cm−1, 1270 cm−1, 1385 cm−1, and 1632 cm−1 corresponded to the stretching vibrations of C–O, B–C, B–O, B–N, C–N, and C![[double bond, length as m-dash]](https://www.rsc.org/images/entities/char_e001.gif) C, respectively.28,32–34 It confirmed the B/N coping in the carbon material. In comparison, in FT-IR spectra of WPU-GO-Fe-B, the peak corresponding to B–N bond at 1270 cm−1 disappeared, and the peak at 1385 cm−1 corresponding to C–N bond32,34 became noticeably enhanced on account of the introduction ferric catalyst, which prevented the direct bonding of boron and nitrogen atoms.25
C, respectively.28,32–34 It confirmed the B/N coping in the carbon material. In comparison, in FT-IR spectra of WPU-GO-Fe-B, the peak corresponding to B–N bond at 1270 cm−1 disappeared, and the peak at 1385 cm−1 corresponding to C–N bond32,34 became noticeably enhanced on account of the introduction ferric catalyst, which prevented the direct bonding of boron and nitrogen atoms.25
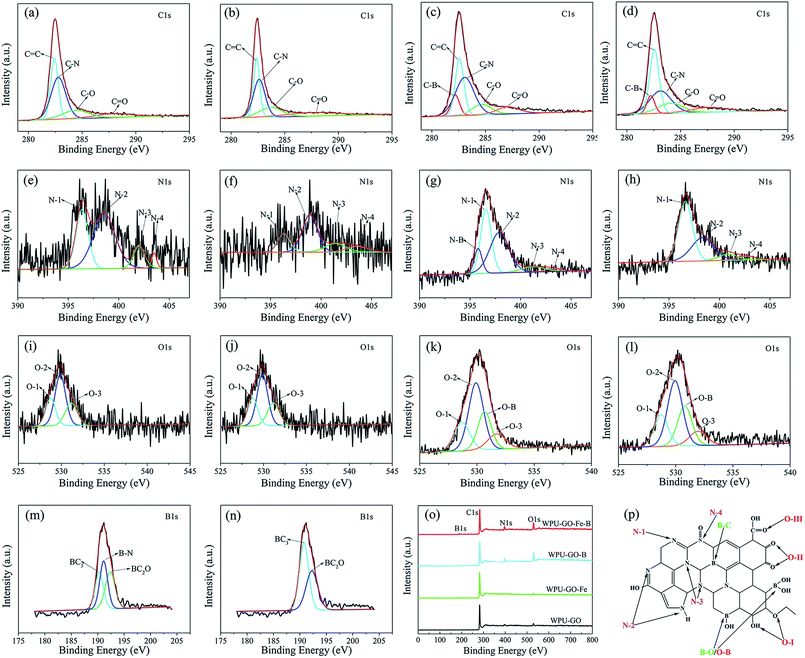
XPS was used to investigate the chemical composition. The analysis spectrogram is exhibited in Fig. 6. The carbon structure model with boric acid and ferric catalyst treatment is shown in Fig. 6p. The surface elemental contents of the samples are shown in Table 1. As indicated by Fig. 6 and Table 1, both WPU-GO and WPU-GO-Fe contained C, N and O elements, while WPU-GO-B and WPU-GO-Fe-B contained B elements in addition to C, N, and O elements, implying that the B atoms were successfully introduced into the carbon structure. As exhibited by Fig. 6a–d, the C1s spectra were fitted to five peaks associating with C–B (282.2 eV), C![[double bond, length as m-dash]](https://www.rsc.org/images/entities/char_e001.gif) C (282.6 eV), C–N (283.0 eV), C–O (284.1 eV), and C
C (282.6 eV), C–N (283.0 eV), C–O (284.1 eV), and C![[double bond, length as m-dash]](https://www.rsc.org/images/entities/char_e001.gif) O (287.7 eV).29,35 The N1 spectra (Fig. 6e–h) consisted of five peaks corresponding to the N–B bond (395.8 eV), pyridinic nitrogen (N-1, 396.6 eV), pyrrolic/pyridine nitrogen (N-2, 398.3 eV), quaternary nitrogen (N-3, 400.8 eV), and N-oxide atoms (N-4, 402.6 eV).36,37 O1s peaks (Fig. 6i–l) exhibited C
O (287.7 eV).29,35 The N1 spectra (Fig. 6e–h) consisted of five peaks corresponding to the N–B bond (395.8 eV), pyridinic nitrogen (N-1, 396.6 eV), pyrrolic/pyridine nitrogen (N-2, 398.3 eV), quaternary nitrogen (N-3, 400.8 eV), and N-oxide atoms (N-4, 402.6 eV).36,37 O1s peaks (Fig. 6i–l) exhibited C![[double bond, length as m-dash]](https://www.rsc.org/images/entities/char_e001.gif) O (O-1, 528.7 eV), C–O (O-2, 529.9 eV), O–B (530.7 eV), and O
O (O-1, 528.7 eV), C–O (O-2, 529.9 eV), O–B (530.7 eV), and O![[double bond, length as m-dash]](https://www.rsc.org/images/entities/char_e001.gif) C–O (O-3, 531.9 eV).22,28,38 B1s (Fig. 6m–n) presented the peaks related to B–C (190.7 eV), B–N (191.1 eV), and B–O (192.3 eV).39,40 As expected, the existence of B atoms was verified by the C–B in the C1s spectra, O–B bond in O1s spectra, and the peaks in B1s spectra. According to the XPS analysis results (Table 1), the heteroatoms contents of WPU-GO–B and WPU–GO–Fe–B were higher than that of NOC, demonstrating its superior pseudocapacitive behavior. The most important factors affecting the capacitive performance were N-1, N-2, C–B, and O-1 bonds.30,41,42 The relative contents of heteroatoms obtained from the analyses of the C1s N1s, B1s, and O1s peaks are shown in Table S1.† As can be found, WPU-GO-Fe-B exhibited high relative contents of N-1 (54.55 at%), N-2 (33.83 at%), C–B (57.36 at%), and O-1 (19.69 at%), suggesting that it could make a greater contribution in enhancing the pseudocapacitance performance. Moreover, the relative contents of inert B–N disappeared in the spectra when compared with WPU-GO-B, demonstrating that ferric catalyst treatment could effectively prevent the formation of inert B–N bonds and contribute to the constitution of active B–C bonds. As a result, WPU-GO-Fe-B exhibited greater pseudocapacitive performance than other samples.
C–O (O-3, 531.9 eV).22,28,38 B1s (Fig. 6m–n) presented the peaks related to B–C (190.7 eV), B–N (191.1 eV), and B–O (192.3 eV).39,40 As expected, the existence of B atoms was verified by the C–B in the C1s spectra, O–B bond in O1s spectra, and the peaks in B1s spectra. According to the XPS analysis results (Table 1), the heteroatoms contents of WPU-GO–B and WPU–GO–Fe–B were higher than that of NOC, demonstrating its superior pseudocapacitive behavior. The most important factors affecting the capacitive performance were N-1, N-2, C–B, and O-1 bonds.30,41,42 The relative contents of heteroatoms obtained from the analyses of the C1s N1s, B1s, and O1s peaks are shown in Table S1.† As can be found, WPU-GO-Fe-B exhibited high relative contents of N-1 (54.55 at%), N-2 (33.83 at%), C–B (57.36 at%), and O-1 (19.69 at%), suggesting that it could make a greater contribution in enhancing the pseudocapacitance performance. Moreover, the relative contents of inert B–N disappeared in the spectra when compared with WPU-GO-B, demonstrating that ferric catalyst treatment could effectively prevent the formation of inert B–N bonds and contribute to the constitution of active B–C bonds. As a result, WPU-GO-Fe-B exhibited greater pseudocapacitive performance than other samples.
| Sample | SBETa (m2 g−1) | Vtotalb (cm3 g−1) | Davgc (nm) | Contentd (at%) | |||
|---|---|---|---|---|---|---|---|
| C | N | B | O | ||||
| a Total specific surface area calculated by Brunauer–Emmett–Teller (BET) method.b Total pore volume calculated at P/P0 = 0.99.c Average pore diameter calculated from the equation of 4Vtotal/SBET.d Elemental contents of samples obtained from XPS analysis. | |||||||
| WPU-GO | 0.1378 | 0 | 0 | 89.46 | 6.41 | 0 | 4.14 |
| WPU-GO-Fe | 66.7651 | 0.247551 | 5.4254 | 92.8 | 1.87 | 0 | 5.33 |
| WPU-GO-B | 70.1579 | 0.14614 | 4.6667 | 65.73 | 9.54 | 10.04 | 14.69 |
| WPU-GO-Fe-B | 152.5902 | 0.267326 | 5.6245 | 68.14 | 9.42 | 9.72 | 12.72 |
Fig. 7 exhibits N2 adsorption/desorption isotherms and the pore size distributions of the samples. The isotherm of WPU-GO showed no rise, implying its low BET specific surface area. In contrast, the isotherms of WPU-GO-Fe, WPU-GO-B, and WPU-GO-Fe-B presented characteristic type IV curves with the hysteresis loop. Almost no growth between the low P/P0 relative pressures for the isotherm of samples indicated the few micropores. The hysteresis loop in the high P/P0 area indicated the existence of mesopores.43 In addition, the pore size distribution (Fig. 7b) also indicated that the samples had some mesopores except for WPU-GO. As shown in Table 1, the WPU-GO displayed extremely low BET specific surface area (SBET) and total pore volume (Vtotal) indicating its small amount of pore structure. Both the SBET and Vtotal of WPU-GO-Fe and WPU-GO-B increased noticeably. This might be due to the release of volatile substances during the carbonization process with a ferric catalyst or boric acid treatment. Furthermore, after the ferric catalyst or boron oxides were removed by the washing process, SBET and Vtotal also increased. Therefore, the porous characteristics of WPU-GO-Fe-B were further improved, leading to a further increase in SBET and Vtotal to 152.5902 m2 g−1 and 0.267326 cm3 g−1, respectively. Noteworthy to mention, these porous characteristics could play a crucial role in improving the ion transmission and double-layer capacitance, consequently improving the specific capacitance.2,44,45
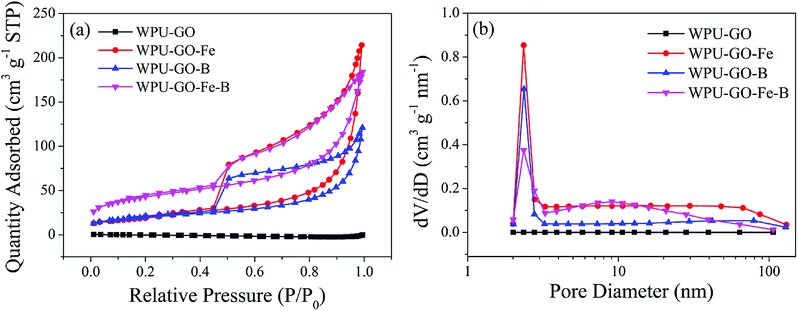 | ||
| Fig. 7 (a) N2 absorption/desorption isotherms and (b) pore size distributions of the WPU-GO, WPU-GO-Fe, WPU-GO-B, and WPU-GO-Fe-B samples. | ||
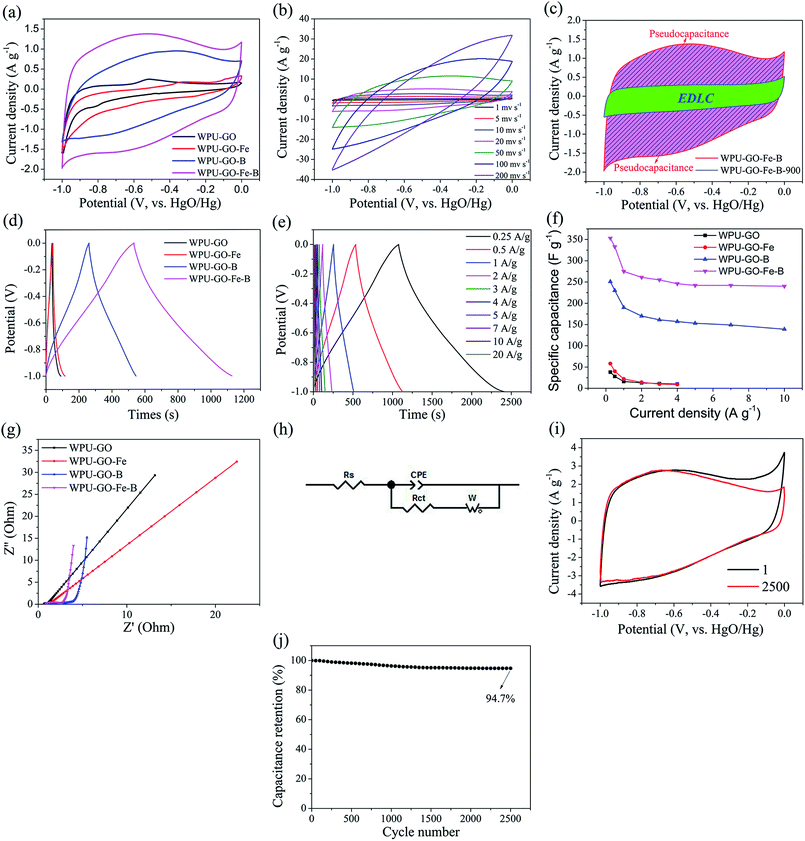
To investigate the electrochemical performance, 6 M KOH electrolyte was used in testing the three-electrode system. Fig. 8a exhibits the CV curves of the electrode material at a scanning rate of 5 mV s−1. Each CV curve shows an approximately rectangular shape. In comparison, WPU-GO shows a small peak owing to the pseudocapacitance contributed by the N and O atoms. However, the WPU-GO-Fe curve exhibits an unobvious peak, which implies that its capacitance behavior was mainly determined by EDLC, resulting from the decrease in the heteroatom content (as shown in Table 1), and further reduced the pseudocapacitance. Besides, wide humps appeared on the CV curves of WPU-GO-B and WPU-GO-Fe-B, implying that their capacitance signified the combined action of EDLC and pseudocapacitance related to the various heteroatoms N, B, and O.46 The CV curve of WPU-GO-Fe-B presents a larger area than that of WPU-GO-B, also indicating that introducing the ferric catalyst could prevent the formation of inert B–N bonds. Fig. 8b exhibits the CV curves of WPU-GO-Fe-B at varying scanning rates. As can be seen, the curves of WPU-GO-Fe-B still maintain the quasi-rectangular shape with no obvious deformation when the scanning rate reached 50 mV s−1, indicative of its good rate performance. To demonstrate the capacitance contribution of the pseudocapacitance from heteroatoms, WPU-GO-Fe-B-900 was heat-treated from WPU-GO-Fe-B at 900 °C for 2 h in a nitrogen atmosphere to eliminate the heteroatoms. The CV curve of WPU-GO-Fe-B-900 shows an orderly and limited rectangular shape without humps, as exhibited in Fig. 8c. This indicates that the main capacitance for WPU-GO-Fe-B was contributed by heteroatoms.
Fig. 8d shows the GCD curves of the samples at a current density of 0.5 A g−1. The quasi-symmetrical triangular shape resulted from the pseudocapacitive behavior from the heteroatoms.30 As exhibited in Fig. 8e, the charge/discharge time and the specific capacitance decreased gradually with the increase in current density because the materials were underutilized at the large current density. Fig. 8e exhibits the specific capacitance values of the samples at varying current densities calculated by eqn (1). The specific capacitance values of WPU-GO, WPU-GO-Fe, WPU-GO-B, and WPU-GO-Fe-B were 28 F g−1, 40 F g−1, 230 F g−1, and 330 F g−1 at 0.5 A g−1, respectively, indicating that the introduction of boron atoms and ferric catalyst could significantly improve the capacitive property of the materials. WPU-GO-Fe-B exhibited the highest specific capacitance, especially since its specific capacitance could still maintain 68.0% retention after applying the current density of 10 A g−1 compared with 0.25 A g−1, indicating an excellent rate capability. As listed in Table 2, the performances of WPU-GO-Fe-B were better than those of many other heteroatom-doped carbon-based materials and polyurethane-based materials, showing that its good performance could be applied to supercapacitors.
| Samples | Materials | Electrolyte | Current density | Capacitance | Ref. |
|---|---|---|---|---|---|
| WPU-GO-Fe-B | In this work | 6 M KOH | 0.5 A g−1 | 330 F g−1 | In work |
| N-PCFS | N-doped porous carbon nanofibers | 6 M KOH | 1 A g−1 | 202 F g−1 | 47 |
| HB-GNS | B doped graphene nanosheets | 0.5 M H2SO4 | 1 A g−1 | 113 F g−1 | 28 |
| CNB | B/N co-doped porous carbon | 6 M KOH | 0.5 A g−1 | 247 F g−1 | 48 |
| 1B-2CHI-WT | B/N co-doped chitosan derived-porous carbons | 1 M H2SO4 | 0.1 A g−1 | 306 F g−1 | 49 |
| B/N-CS | B/N co-doped carbon nanosheets | 1 M H2SO4 | 0.1 A g−1 | 358 F g−1 | 50 |
| CNBs | B/N co-doped carbon | 1 M H2SO4 | 0.2 A g−1 | 299 F g−1 | 51 |
| BNAC | B/N co-doped activated carbons | 6 M KOH | 0.5 A g−1 | 176 F g−1 | 52 |
| BNC | B/N co-doped graphene-like carbon | 6 M KOH | 0.25 A g−1 | 254 F g−1 | 53 |
| B/N-CNS | B/N co-doped carbon nanospheres | 1 M H2SO4 | 0.2 A g−1 | 423 F g−1 | 54 |
| PU/CNT/PAni | Polyurethane/carbon-nanotube/polyaniline | 1 M H2SO4 | 0.9 A g−1 | 187 F g−1 | 55 |
| Graphene/PU | Graphene/polyurethane composite film | 1 M H2SO4 | 0.5 A g−1 | 218 F g−1 | 56 |
The electrochemical behaviors of the samples were investigated by EIS measurements. Fig. 8g exhibits the Nyquist plots of the samples. The Nyquist plots contain two parts, i.e., a hemicycle at a high frequency related to the charge transfer resistance of the electrons and ions as well as a straight line at low frequency linked to electrolyte ion transport in pore structures. Fig. 8h displays an equivalent circuit model, including the electrolyte resistance (Rs), charge transfer resistance (Rct), Warburg diffusion element (W), and constant phase element (CPE). The fitted parameters of the samples are listed in Table S2.† As shown in Fig. 8g, at high frequency, WPU-GO-B and WPU-GO-Fe-B exhibited a large-radius semicircle compared with other samples, verifying the pseudocapacitive behavior from the heteroatoms.25 The X-intercept of curves denoted Rs, and all samples showed minor Rs values (<1.0 Ω), indicating the low electrolyte resistance. Especially, WPU-GO-Fe-B exhibited the lowest Rs value, resulting from the increase in conductivity and electrochemical activity by the heteroatoms.26 At low frequency, WPU-GO-Fe-B showed a straight line with the highest slope of nearly 90° to the x-axis, verifying the better capacitive characteristic of WPU-GO-Fe-B (perpendicular line of the ideal capacitor). In addition, the Rct values of WPU-GO, WPU-GO-Fe, WPU-GO-B, and WPU-GO-Fe-B were calculated as 0.81 Ω, 0.77 Ω, 0.80 Ω, and 0.66 Ω, respectively. WPU-GO-Fe-B exhibited a minor Rct value, which was beneficial for the charge transfer.45 Moreover, the WPU-GO-Fe-B with the smallest WR value demonstrated the fast diffusion rate of electrolyte ions. In conclusion, WPU-GO-Fe-B exhibited good conductivity, fast charge transfer and high diffusion rate resulting in its excellent electrochemical performances.
Cycling stability plays a crucial part in supercapacitors. The cycling stability of WPU-GO-Fe-B was assessed by 2500 cycles of CV tests at a scanning rate of 10 mV s−1. The CV curve of WPU-GO-Fe-B exhibits no obvious distortion until 2500 cycles as shown in Fig. 8i. Fig. 8j shows that WPU-GO-Fe-B still maintained 94.7% retention compared with the premier capacitance after 2500 cycles, indicating the good electrochemical stability and reversibility of WPU-GO-Fe-B.
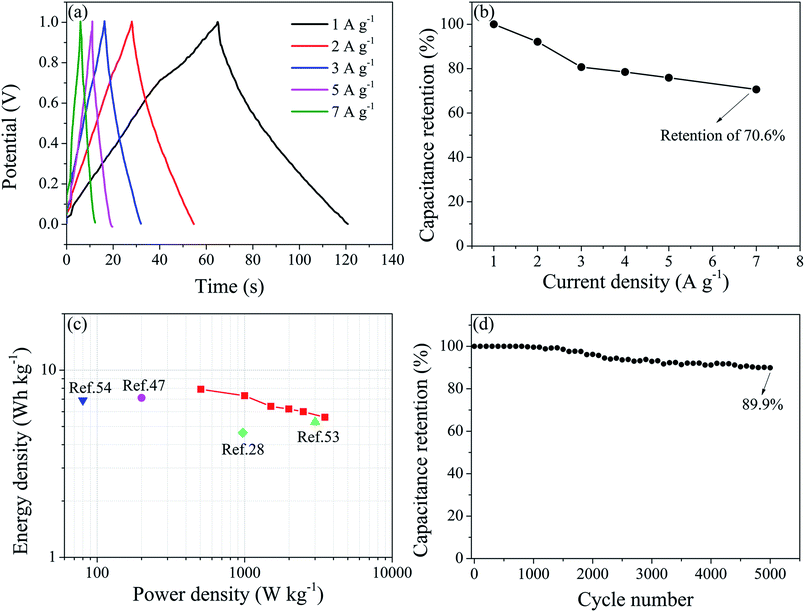
To further investigate the electrochemical performances of WPU-GO-Fe-B, 6 M KOH electrolyte was used in the symmetrical supercapacitor devices of a two-electrode system. Fig. 9a exhibits the GCD curves of the WPU-GO-Fe-B//WPU-GO-Fe-B supercapacitor at various current densities. Evidently, the WPU-GO-Fe-B//WPU-GO-Fe-B supercapacitor has a slightly distorted triangular shape, indicating the capacitive behavior from pseudocapacitive in the charge–discharge process. Calculated by eqn (2) and (3), the WPU-GO-Fe-B achieved good total specific capacitances (57 F g−1 at 1 A g−1) and single electrode specific capacitances (228 F g−1 at 1 A g−1). Moreover, the capacitance retention still retained 70.6% when the current density increased from 1 A g−1 to 7 A g−1 (Fig. 9b), showing its good rate capability. According to the Ragone plots of the WPU-GO-Fe-B//WPU-GO-Fe-B supercapacitor (Fig. 9c), an energy density of 7.9 W h kg−1 was achieved at a power density of 505 W kg−1, and it still remained at 5.6 W h kg−1 at 3500 W kg−1. The performances were better than the previous research of boron-doped graphene (4.64 W h kg−1 at 970 W kg−1),28 nitrogen-doped porous carbon (7.11 W h kg−1 at 200 W kg−1),47 boron/nitrogen co-doped graphene-like carbon (5.3 W h kg−1 at 3000 W kg−1),53 and boron/nitrogen co-doped carbon nanospheres (6.9 W h kg−1 at 80 W kg−1),54 etc. As shown in Fig. 9d, the WPU-GO-Fe-B//WPU-GO-Fe-B supercapacitor still maintained a capacitance retention of approximate 89.9% after 5000 charge–discharge cycles. Therefore, the assembled WPU-GO-Fe-B has great potential to be applied to supercapacitors as the advanced heteroatoms in co-doped carbon materials.
4. Conclusions
In summary, this work presents an efficient and easy method to synthesize B/N co-doped carbon materials with high, excellent capacitive performance. The heteroatoms N and B were introduced into the carbon materials by nitrogen-rich WPU and boric acid, respectively. Moreover, the graphitization degree was greatly improved, and the direct combination of the inert B–N bond was effectively prevented by ferric catalyst treatment. As expected, WPU-GO-Fe-B displayed a high specific capacitance of 330 F g−1 at 0.5 A g−1 and good rate capability. The values of the performance indicators still remained at 94.7% compared with the premier capacitance after 2500 cycles. Furthermore, the as-assembled WPU-GO-Fe-B//WPU-GO-Fe-B symmetric supercapacitor also exhibited a high energy density (7.9 W h kg−1 at 505 W kg−1) and showed a capacitance retention of approximately 89.9% after 5000 charge–discharge cycles. This work presents a feasible method to explore high-capability carbon-based materials potentially applicable to supercapacitors.Conflicts of interest
There are no conflicts of interest to declare.Acknowledgements
The authors are grateful for the support of the National Natural Science Foundation of China (Grant no. 21372067).Notes and references
- X. D. Yan, Y. H. Yu, S. K. Ryu, J. L. Lan, X. L. Jia and X. P. Yang, Electrochim. Acta, 2014, 136, 466 CrossRef CAS.
- C. L. Long, L. L. Jiang, X. L. Wu, Y. T. Jiang, D. R. Yang, C. K. Wang, T. Wei and Z. J. Fan, Carbon, 2015, 93, 412 CrossRef CAS.
- X. H. Xiong, D. Ding, D. C. Chen, G. Waller, Y. F. Bu, Z. X. Wang and M. L. Liu, Nano Energy, 2015, 11, 154 CrossRef CAS.
- J. Benson, I. Kovalenko, S. Boukhalfa, D. Lashmore, M. Sanghadasa and G. Yushin, Adv. Mater., 2013, 25, 6625 CrossRef CAS PubMed.
- J. Y. Wang, W. Dou, X. T. Zhang, W. H. Han, X. M. Mu, Y. Zhang, X. H. Zhao, Y. X. Chen, Z. W. Yang, Q. Su, E. Q. Xie, W. Lan and X. R. Wang, Electrochim. Acta, 2017, 224, 260 CrossRef CAS.
- B. C. Yang, C. X. Hao, F. S. Wen, B. C. Wang, C. P. Mu, J. Y. Xiang, L. Li, B. Xu, Z. S. Zhao, Z. Y. Liu and Y. J. Tian, ACS Appl. Mater. Interfaces, 2017, 9, 44478 CrossRef CAS PubMed.
- X. L. Wu, L. L. Jiang, C. L. Long and Z. J. Fan, Nano Energy, 2015, 13, 527 CrossRef CAS.
- Y. Y. Wang, J. Du, H. L. Zhang, L. Liu, Y. F. Yu, Y. Zhang, H. J. Lv and A. B. Chen, J. Electrochem. Soc., 2017, 164, A1918 CrossRef CAS.
- W. Yang, W. Yang, L. Kong, S. Di and X. Qin, Front. Mater. Sci., 2018, 12(3), 283–291 CrossRef.
- V. Thirumal, A. Pandurangan, R. Jayavel and R. Ilangovan, Synth. Met., 2016, 220, 524–532 CrossRef CAS.
- L. Sun, J. Liu, Z. Liu, T. Wang, H. Wang and Y. Li, RSC Adv., 2018, 8, 19964–19970 RSC.
- J. Feng, W. Song, L. Sun and L. Xu, RSC Adv., 2016, 6, 110337–110343 RSC.
- L. Sun, L. Wang, C. G. Tian, T. X. Tan, Y. Xie, K. Y. Shi, M. T. Li and H. G. Fu, RSC Adv., 2012, 2, 4498–4506 RSC.
- W. Ai, W. W. Zhou, Z. Z. Du, Y. P. Du, H. Zhang, X. T. Jia, L. H. Xie, M. D. Yi, T. Yu and W. Huang, J. Mater. Chem., 2012, 22, 23439–23446 RSC.
- D. Carriazo, M. C. Gutiérrez, F. Picó, J. M. Rojo, J. L. G. Fierro, M. L. Ferrer and F. D. Monte, ChemSusChem, 2012, 5, 1405–1409 CrossRef CAS PubMed.
- L. F. Chen, X. D. Zhang, H. W. Liang, M. G. Kong, Q. F. Guan, P. Chen, Z. Y. Wu and S. H. Yu, ACS Nano, 2012, 6, 7092–7102 CrossRef CAS PubMed.
- L. Sun, C. G. Tian, Y. Fu, Y. Yang, J. Yin, L. Wang and H. G. Fu, J. Mater. Chem. A, 2013, 1, 6462–6470 RSC.
- X. R. Wang, X. L. Li, L. Zhang, Y. Yoon, P. K. Weber, H. L. Wang, J. Guo and H. J. Dai, Science, 2009, 324, 768–771 CrossRef CAS PubMed.
- J. Gao, X. Y. Wang, Y. W. Zhang, J. Liu, Q. Lu and M. Liu, Electrochim. Acta, 2016, 207, 266 CrossRef CAS.
- D. Li, C. Yu, M. Wang, Y. Zhang and C. Pan, RSC Adv., 2014, 4, 55394–55399 RSC.
- S. N. Faisal, E. Haque, N. Noorbehesht, W. Zhang, A. T. Harris, T. L. Church and A. I. Minett, RSC Adv., 2017, 7, 17950–17958 RSC.
- B. Liu, Y. J. Liu, H. B. Chen, M. Yang and H. M. Li, J. Power Sources, 2017, 341, 309 CrossRef CAS.
- H. L. Guo and Q. M. Gao, J. Power Sources, 2009, 186, 551–556 CrossRef CAS.
- E. Iyyamperumal, S. Y. Wang and L. M. Dai, ACS Nano, 2012, 6, 5259–5265 CrossRef CAS PubMed.
- L. Sun, Y. Fu, C. Tian, Y. Yang, L. Wang, J. Yin, J. Ma, R. Wang and H. Fu, ChemSusChem, 2014, 7, 1637–1646 CrossRef CAS PubMed.
- C. Wang, X. Zhang, J. Wang, Y. Ma, S. Lv, J. Xiang, M. Chu, T. Sun and C. Qin, J. Electrochem. Soc., 2018, 165(5), A1–A11 Search PubMed.
- W. Hummers and E. Offeman, J. Am. Chem. Soc., 1985, 80, 1339 CrossRef.
- V. Thirumal, A. Pandurangan, R. Jayavel and R. Ilangovan, Synth. Met., 2016, 220, 524 CrossRef CAS.
- J. Ou, Y. Z. Zhang, L. Chen, Q. Zhao, Y. Meng, Y. Guo and D. Xiao, J. Mater. Chem. A, 2015, 3, 6534 RSC.
- S. J. Song, F. W. Ma, G. Wu, D. Ma, W. D. Geng and J. F. Wan, J. Mater. Chem. A, 2015, 3, 18154 RSC.
- Z. S. Li, B. L. Li, Z. S. Liu, D. H. Li, H. Q. Wang and Q. Y. Li, Electrochim. Acta, 2016, 190, 378 CrossRef CAS.
- W. Ai, W. W. Zhou, Z. Z. Du, Y. P. Du, H. Zhang, X. T. Jia, L. H. Xie, M. D. Yi, T. Yu and W. Huang, J. Mater. Chem., 2012, 22, 23439–23446 RSC.
- J. Han, L. L. Zhang, S. Lee, J. Oh, K. Lee, J. R. Potts, J. Ji, X. Zhao, R. S. Ruoff and S. Park, ACS Nano, 2013, 7, 19–26 CrossRef CAS PubMed.
- S. Y. Wang, L. P. Zhang, Z. H. Xia, A. Roy, D. W. Chang, J. B. Baek and L. M. Dai, Angew. Chem., Int. Ed., 2012, 51, 4209 CrossRef CAS PubMed.
- S. B. Li, Z. F. Wang, H. M. Jiang, L. M. Zhang, J. Z. Ren, M. T. Zheng, L. C. Dong and L. Y. Sun, Chem. Commun., 2016, 52, 10988 RSC.
- Y. Zheng, Y. Jiao, L. Ge, M. Jaroniec and S. Z. Qiao, Angew. Chem., 2013, 125, 3192 CrossRef.
- Y. J. Kim, Y. Abe, T. Yanagiura, K. C. Park, M. Shimizu, T. Iwazaki, S. Nakagawa, M. Endo and M. S. Dresselhaus, Carbon, 2007, 45, 2116 CrossRef CAS.
- J. Zhou, H. L. Shen, Z. H. Li, S. Zhang, Y. Zhao, X. Bi, Y. S. Wang, H. Y. Cui and S. P. Zhuo, Electrochim. Acta, 2016, 209, 557 CrossRef CAS.
- Y. Zhao, L. J. Yang, S. Chen, X. Z. Wang, Y. W. Ma, Q. Wu, Y. F. Jiang, W. J. Qian and Z. Hu, J. Am. Chem. Soc., 2013, 135, 1201 CrossRef CAS PubMed.
- L. Wang, P. Yu, L. Zhao, C. G. Tian, D. D. Zhao, W. Zhou, J. Yin, R. H. Wang and H. G. Fu, Sci. Rep., 2014, 4, 5184 CrossRef CAS PubMed.
- M. Enterría, M. F. R. Pereira, J. I. Martins and J. L. Figueiredo, Carbon, 2015, 95, 72 CrossRef.
- H. L. Shen, J. Zhou, Y. T. Zhao, S. Zhang, X. Bi, S. P. Zhuo and H. Y. Cui, RSC Adv., 2016, 6, 58764 RSC.
- Z. L. Wang, X. B. Zhang, X. J. Liu, M. F. Lv, K. Y. Yang and J. Meng, Carbon, 2011, 49, 161–169 CrossRef CAS.
- H. W. Wang, C. Wang, Y. Xiong, C. D. Jin and Q. F. Sun, J. Electrochem. Soc., 2017, 164, A3832 CrossRef CAS.
- B. H. Kim, K. S. Yang and H. G. Woo, Mater. Lett., 2013, 93, 190 CrossRef CAS.
- H. L. Guo and Q. M. Gao, J. Power Sources, 2009, 186, 551 CrossRef CAS.
- L. F. Chen, X. D. Zhang, H. W. Liang, M. G. Kong, Q. F. Guan, P. Chen, Z. Y. Wu and S. H. Yu, ACS Nano, 2012, 8, 7092 CrossRef PubMed.
- D. C. Guo, J. Mi, G. P. Hao, W. Dong, G. Xiong, W. C. Li and A. H. Lu, Energy Environ. Sci., 2013, 6, 652 RSC.
- Z. Ling, G. Wang, M. Zhang, X. Fan, C. Yu, J. Yang, N. Xiao and J. Qiu, Nanoscale, 2015, 7, 5120–5125 RSC.
- Z. Ling, Z. Wang, M. Zhang, C. Yu, G. Wang, Y. Dong, S. Liu, Y. Wang and J. Qiu, Adv. Funct. Mater., 2016, 26, 111–119 CrossRef CAS.
- Y. Chang, C. Yuan, C. Liu, J. Mao, Y. Li, H. Wu, Y. Wu, Y. Xu, B. Zeng and L. Dai, J. Power Sources, 2017, 365, 354–361 CrossRef CAS.
- Q. Lu, Y. Xu, S. Mu and W. Li, New Carbon Mater., 2017, 32(5), 442–450 CrossRef.
- Z. Chen, L. Hou, Y. Cao, Y. Tang and Y. Li, Appl. Surf. Sci., 2018, 435, 937–944 CrossRef CAS.
- J. Hao, J. Wang, S. Qin, D. Liu, Y. Li and W. Lei, J. Mater. Chem. A, 2018, 6, 8053–8058 RSC.
- A. Khosrozadeh, M. A. Darabi, Q. Wang and M. Xing, J. Mater. Chem. A, 2017, 5, 7933–7943 RSC.
- Z. Tai, X. Yan and Q. Xue, J. Power Sources, 2012, 213, 350–357 CrossRef CAS.
Footnote |
| † Electronic supplementary information (ESI) available. See DOI: 10.1039/c8ra09043b |
| This journal is © The Royal Society of Chemistry 2019 |

