DOI:
10.1039/C8RA09028A
(Paper)
RSC Adv., 2019,
9, 2666-2672
Synthesis of AuPd nanoparticle-decorated graphene-coated ZnO nanorod arrays with enhanced photoelectrochemical performance and stability
Received
31st October 2018
, Accepted 7th January 2019
First published on 21st January 2019
Abstract
AuPd nanoparticle-decorated graphene-coated ZnO nanorod (ZNR) array electrodes (ZNR@Gr/AuPd) were synthesized via electrostatic self-assembly followed by solution reduction methods. The morphologies of ZNR@Gr/AuPd were characterized with scanning electron microscopy (SEM), transmission electron microscopy (TEM), and atomic force microscopy (AFM), which indicated that ZNR was well-coated by graphene with 3–5 layers and uniformly decorated with AuPd nanoparticles (about 5 nm). UV-Vis diffuse reflectance and photoluminescence spectra were obtained to analyze the optical properties. The photoelectrochemical (PEC) properties were also evaluated; the results indicated that the photocurrent density was 2.27 mA cm−2 at 0.8 V versus Ag/AgCl, which was 7.1 times that of bare ZNR. The sample also displayed enhanced PEC stability (91.3%), which prevented photocorrosion. Finally, a proposed PEC mechanism of ZNR@Gr/AuPd was illustrated to explain the charge transfer and the role of graphene and AuPd nanoparticles in the improvement of PEC performance and stability. The ZNR@Gr/AuPd electrode shows excellent PEC performance and stability, exhibiting promising potential in the generation of H2.
1. Introduction
With the gradually increasing demand for renewable energy, semiconductor photocatalysis has attracted considerable interest due to its environmental and energy conversion applications. Photoelectrochemical (PEC) water splitting is a process used to provide hydrogen (H2) by using semiconductors such as ZnO, TiO2, and ZnSe as photoelectrodes to realize energy conversion.1–4 Among these semiconductor materials, ZnO has received great attention due to its low cost, non-toxicity, controllable morphology, and highly efficient PEC performance. Despite the advantages of ZnO, the wide band gap (3.37 eV), high recombination of photo-excited electron–hole pairs, limited charge conductivity, and the photocorrosion effect limit efficient and continuous H2 generation.5–7 Remarkably, forming composites on morphology-controlled ZnO by combining with other nanomaterials has been demonstrated to be a useful method to improve the PEC performance and stability.
To date, ZNR array electrodes have received considerable attention among other ZnO structures in the PEC field due to their larger surface area and a favorable passageway for electron transmission.8 Graphene, as a rising star of flexible two-dimensional carbonaceous materials with excellent electrical conductivity and large surface area, has been demonstrated to be an excellent material to enhance the PEC performance and inhibit photocorrosion when forming graphene-semiconductor materials.9 Although a great variety of ZnO–graphene composites have been reported, to the best of our knowledge, there are only few reports on ZNR arrays with excellent graphene coating. Furthermore, great efforts have been devoted towards improving the PEC performance by sensitizing with a noble metal (Au, Ag, or Pd) on the surface of the ZNR arrays.8,10,11 Remarkably, many reports have mentioned that decoration with various bimetallic alloy nanoparticles (such as AuPd, AgPd, and PtNi) can improve the photocatalytic and PEC performance compared with that using monometallic nanoparticles due to the size effect and unique microstructures.12–15 AuPd bimetallic alloy nanoparticles have recently attracted considerable interests due to their unique ability of enhancing photocatalytic and PEC performances compared with single Au or Pd nanoparticles.12 However, there are only few reports on AuPd-decorated ZNR array electrodes in the PEC field. In addition, the surface plasmon resonance (SPR) of noble metal nanoparticles contributes to electron excitation within the visible range.16,17 For high recombination of electron–hole pairs and limited utilization of light related to the ZNR array electrodes, it is worth exploring the synergistic effect by combining the advantages of graphene coating and AuPd nanoparticle decoration on the surface of ZNR arrays.
In this paper, we synthesized an AuPd nanoparticle-decorated graphene-coated ZNR array (ZNR@Gr/AuPd) electrode. The SEM, TEM, and AFM images exhibit that graphene with 3–5 layers was well-coated on the ZNR surface, and AuPd nanoparticles with average size of 5 nm were uniformly decorated outside the ZNR@Gr composite. The photocurrent density of ZNR@Gr/AuPd reached 2.27 mA cm−2 at 0.8 V versus saturated Ag/AgCl, which was 7.1 times that of bare ZNR. The PEC stability was evaluated; enhanced PEC stability (91.3%) was obtained compared with that of pure ZNR (50.5%). At last, the mechanisms of AuPd nanoparticles and graphene for the improvement in PEC performance and stability were discussed, revealing the synergistic role of the two kinds of materials. The ZNR array electrodes modified with graphene and AuPd nanoparticles have great potential in the generation of H2 by energy conversion.
2. Experimental
2.1 Reagents and apparatus
All reagents mentioned were of analytical grade and used without further purification. Chloroauric acid hydrate (HAuCl4·4H2O), palladium chloride (PdCl2), hexamethylenetetramine (HMTA), polyvinyl alcohol (PVA), amino-propyl-trimethoxysilane (APTMS), and NaBH4 were purchased from Aladdin (Shanghai, China). Zinc nitrate hexahydrate (Zn(NO3)2·6H2O) and sodium sulfate (Na2SO4) were obtained from Sinopharm Chemical Reagent Co., Ltd. (Shanghai, China).
The size of GO was measured with atomic force microscopy (AFM, Dimension Icon, Bruker, Germany). The morphologies of the obtained samples were characterized with scanning electron microscopy (SEM, Hitachi S-3400N, Japan), field emission scanning electron microscopy (FESEM, Magellan 400, FEI Company, USA), and high-resolution transmission electron microscopy (HRTEM, Tecnai G2 F20, FEI Company, USA). UV-visible absorption spectra were measured using a UV-Vis-NIR spectrophotometer (CARY 5000 Scan, Varian, USA). The photoluminescence (PL) spectra were recorded on fluorescence spectrophotometers, viz., Hitachi F-4600 and Shimadzu RF-5301 PC with a 325 nm laser as the excitation source at room temperature.
2.2 Synthesis of ZNR arrays
The ZNR arrays were prepared in two steps according to the as-reported literature with some modifications.18 First, the FTO substrates were cleaned with water, ethanol, and acetone in an ultrasonic bath for 10 min. Then, 10 drops of Zn(NO3)2 solution (0.5 M) and 10 drops of hexamethylenetetramine (HMTA, 0.5 M) were uniformly dropped onto the FTO substrate alternately. After reacting for 5 min, the solution on fluorine-doped tin oxide (FTO, 20 × 30 mm) substrates was removed using a spinner and then, the substrates were annealed in air at 200 °C for 15 min. The above procedure should be repeated for 3 times to ensure that the seeds are densely grown on the substrate. Second, the ZNR arrays were acquired using the hydrothermal method. The substrates with ZnO nanoseeds were stood upright into a Teflon-lined stainless-steel autoclave containing the mixed solution of 0.05 M Zn(NO3)2 and 0.05 MHMTA at 90 °C for 6 h. Then, the products were washed with deionized water 3 times and dried at 80 °C for 5 h.
2.3 Preparation of graphene-coated ZNR (ZNR@Gr) array
The ZNR arrays were coated with graphene by an electrostatic self-assembly method. The surface of ZNR was modified with APTMS in 5% APTMS/ethanol solution to get a positively charged surface. Then, 5 mL 0.1 mg mL−1 negatively charged graphene oxide (GO) was obtained using the modified Hummers' methods19 and then centrifuged at 8000 rpm for 20 min to get a selected size; it was then diluted to 100 mL and ultrasonically treated for 15 min. The modified substrates were then immersed in GO solution while maintaining the temperature at 55 °C for 5 h. Subsequently, the products were washed with deionized water and dried at 80 °C. Finally, the obtained ZNR@GO was annealed at 500 °C in Ar for 2 hours to get ZNR@Gr nanorod arrays.
2.4 Synthesis of ZNR@Gr/AuPd composite
The AuPd alloy nanoparticles were synthesized by mildly reducing Au3+ and Pd2+ in solution. Next, 0.1 mL HAuCl4 (25 mM) and 0.15 mL PdCl2 (25 mM) aqueous solutions were mixed in a 150 mL beaker with 50 mL deionized water. Then, 50 mL PVA (PVA/(Au + Pd) = 1.2, weight ratio) and NaBH4 (NaBH4/(Au + Pd) = 5, molar ratio) mixed solution was added into the beaker with continuous stirring. The prepared ZNR@Gr arrays were immersed in the solution for 1 h and then washed with water. The ZNR@Gr/AuPd samples were acquired after drying at 80 °C for 2 h.
2.5 Evaluation of PEC performance
The PEC characterizations were performed using an electrochemical workstation (Solartron 1260 & 1287, Ametek, UK) with three-electrode configuration. The as-prepared samples were used as the working photoelectrode with incident light (1.5 G) of 100 mW cm−2 for testing the photocurrent. A platinum wire and saturated Ag/AgCl were employed as the counter electrode and the reference electrode, respectively. All the PEC experiments were conducted in Na2SO4 solution (0.5 M). The linear sweep voltammograms were measured in the range of −0.5 to 0.8 V versus saturated Ag/AgCl, and the scanning rate was 10 mV s−1. The chopped current density was tested at an applied potential of +0.6 V versus saturated Ag/AgCl with 60 s for a cycle.
3. Results and discussion
3.1 Characterization of ZNR@Gr and ZNR/AuPd
To determine in detail the roles of graphene and AuPd nanoparticles in the PEC process, we also decorated AuPd nanoparticles directly onto the ZNR surface using the same method. Fig. 1 shows the morphologies of ZNR, ZNR/AuPd, and ZNR@Gr. The ZNR arrays were well aligned on the FTO substrate, which is shown in Fig. 1(a). Fig. 1(b) and (c) are the SEM and HRTEM images of ZNR/AuPd, respectively, which display the well-dispersed AuPd nanoparticles on ZNR with the size of about 5 nm. The interplanar spacing in the crystalline petal shown in the HRTEM image is 0.23 nm, corresponding to the distance between two (111) planes of AuPd.19 From the SEM image of ZNR@Gr (Fig. 1(d)), we can observe graphene connecting the ZNR arrays and the wrinkles on the ZNR surface. However, the graphene observed in the SEM image is already relatively thick. It can be seen in the TEM images that the surface of ZNR is well covered by graphene, most of which is not more than 5 layer thick (Fig. 1(e) and (f)). The AFM topography of GO in Fig. 2 shows that the average size of GO is not more than 250 nm, which matches well with that of ZNR to form the ZNR@Gr structure. The cross-section of graphene indicates that the actual thickness of most GO is about 2.38 nm, which corresponds to 3 layers of GO. The method to synthesize uniformly dispersed AuPd nanoparticles with the size of 5 nm and well-coated ZNR@Gr structure can further offer a process to obtain a desired ZNR@Gr/AuPd composite.
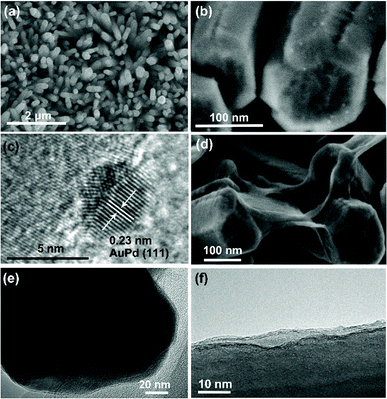 |
| | Fig. 1 (a) SEM image of ZNR; (b) SEM and (c) HRTEM images of ZNR/AuPd; (d) SEM image of ZNR@Gr; (e) and (f) TEM and HRTEM images of ZNR@Gr. | |
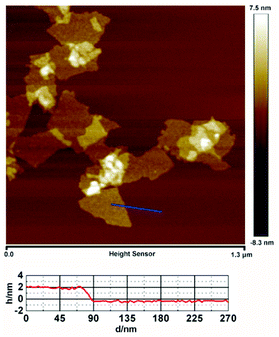 |
| | Fig. 2 AFM topography and cross section of GO. | |
3.2 Characterization of ZNR@Gr/AuPd
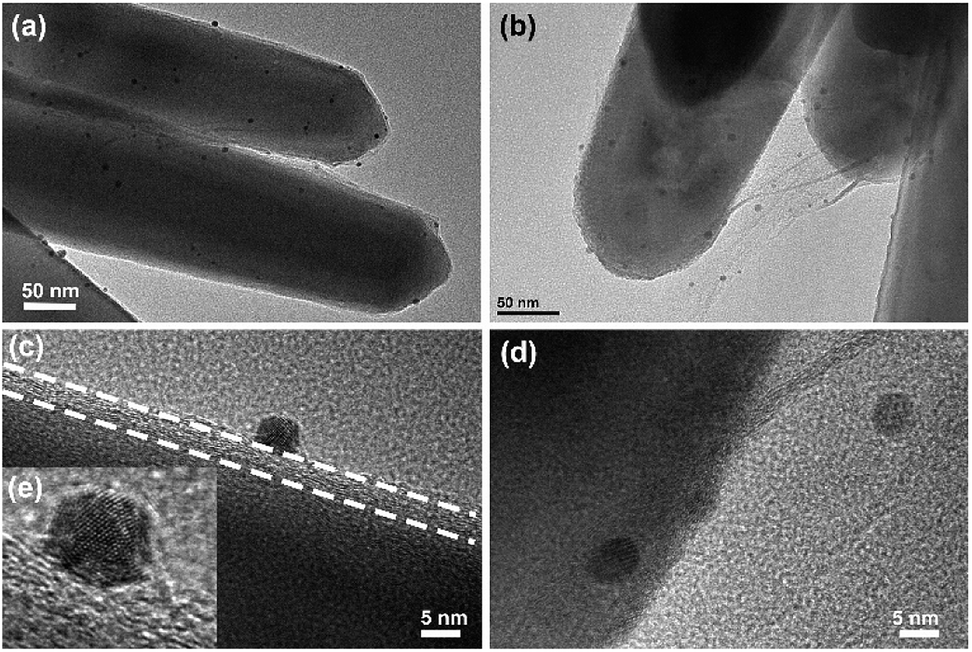
The morphology of the ZNR@Gr/AuPd composite was analyzed by TEM. Fig. 3(a and b) and 3(c and d) show the TEM and HRTEM images of ZNR@Gr/AuPd, respectively. Fig. 3(e) is the magnification of Fig. 3(c), which displays an Au–Pd random alloy nanoparticle.11 Graphene covers most of the ZNR surface, and AuPd nanoparticles are uniformly dispersed on the ZNR@Gr surface, as shown in Fig. 3(a) and (b). Moreover, the AuPd nanoparticles were also found to be decorated onto the graphene connecting the ZNR arrays (Fig. 3(b)). Fig. 3(c) and (d) exhibit the detailed interfacial structure of ZNR-Gr-AuPd. The size of AuPd nanoparticles was about 5 nm, and AuPd closely adhered to graphene, which can make charge transport easier between the interfaces.
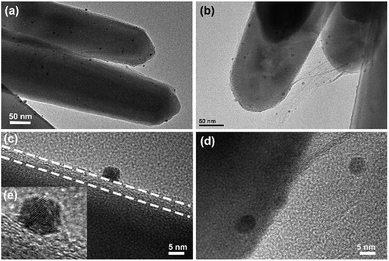 |
| | Fig. 3 (a) and (b) TEM images of ZNR@Gr/AuPd; (c) and (d) HRTEM images of ZNR@Gr/AuPd; (e) locally magnified image of (c). | |
3.3 Characterization of optical properties
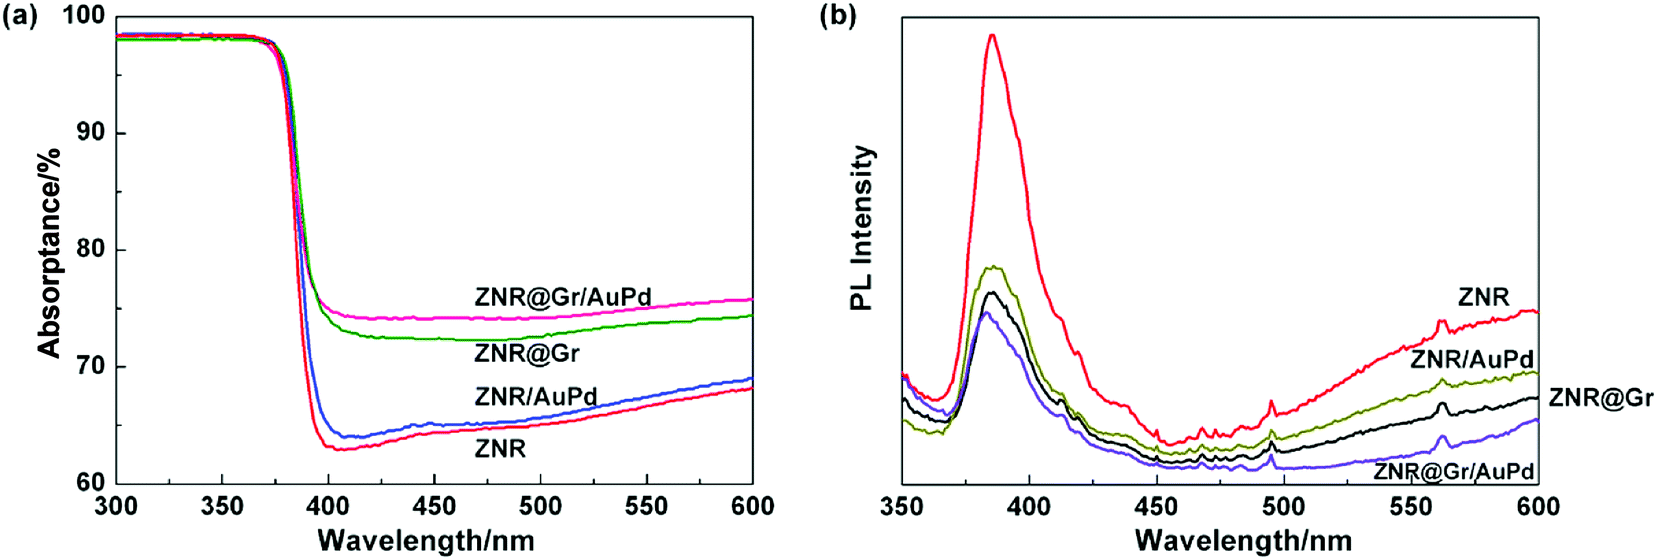
The UV-Vis diffuse reflectance spectra (DRS) and photoluminescence (PL) spectra of ZNR, ZNR/AuPd, ZNR@Gr, and ZNR@Gr/AuPd were obtained at room temperature within the wavelength ranges of 300–600 nm and 350–600 nm. The UV-visible spectra (Fig. 4(a)) display that for all samples, there appears a strong absorption in the ultraviolet region because the light energy is larger than the band gap of ZnO (3.37 eV). Although the prepared samples exhibited similar UV-visible spectra, compared to bare ZNR, ZNR/AuPd showed slight increase in light absorption, whereas ZNR@Gr and ZNR@Gr/AuPd displayed considerable increase in the light absorption intensity in the range of 387–600 nm, which may have enhanced effect on the PEC performance. PL spectra reflect the recombination efficiency of photo-excited electron–hole pairs and the surface defects of semiconductor materials (Fig. 4(b)). An emission peak was observed at 385 nm, which was attributed to the band-edge emission resulting from the recombination of excitonic centers.20,21 The intensity of the peaks decreased after combining with AuPd and/or graphene, which reflected decrease in the recombination efficiency of photo electron–hole pairs. The reason could be that graphene or AuPd nanoparticles accepted excited electrons in the conduction band (CB) to separate the electron–hole pairs effectively.11,13,22 Significantly, ZNR@Gr/AuPd showed the weakest UV emission. It is possible that although we synthesized the graphene-coated ZNR structure, there could still exist some exposed surface with no graphene coating. The exposed surface can be decorated with AuPd nanoparticles, which can further decrease the recombination efficiency of photo electron–hole pairs. As a result, the electrons with a long life can have a greater chance of transferring to the counter electrode, which can be beneficial for enhancing the PEC performance. Moreover, ZNR also exhibited strong emission at a wavelength of visible light, while the emission intensity decreased after combining with graphene and/or AuPd nanoparticles. It is reported that the long-wavelength emission bands (405–700 nm) of ZnO are derived from surface defects, in which oxygen vacancies are the most significant defects.23–25 The results indicated that the decoration with graphene and AuPd could eliminate the surface defects of ZNR.
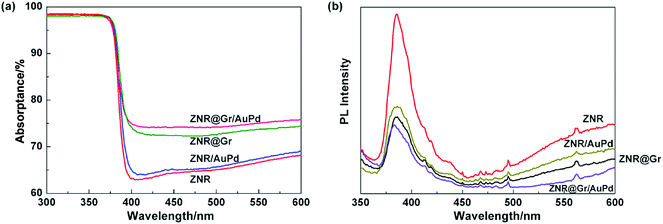 |
| | Fig. 4 (a) UV-visible spectra of ZNR, ZNR@Gr, ZNR/AuPd, and ZNR@Gr/AuPd; (b) PL spectra of ZNR, ZNR@Gr, ZNR/AuPd, and ZNR@Gr/AuPd. | |
3.4 Characterization of photoelectrochemical performances
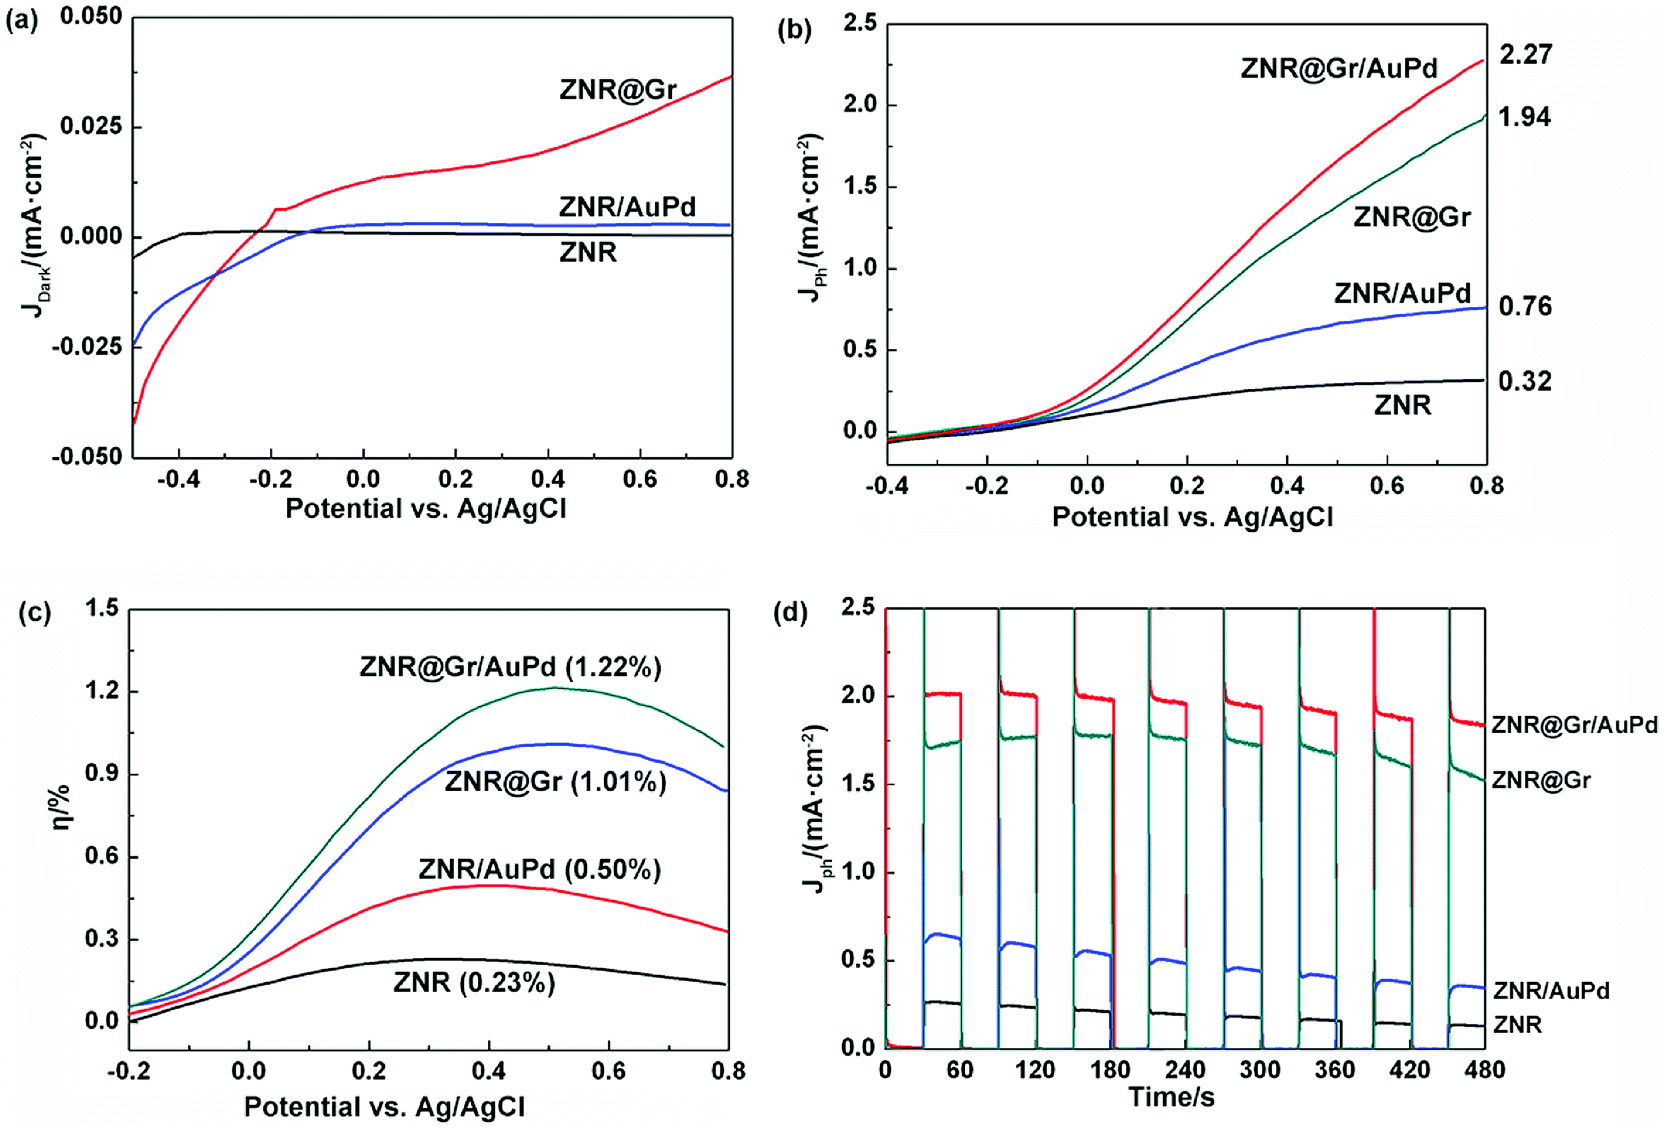
To further investigate the effects of graphene and AuPd, the PEC performance was measured with a three-electrode electrochemical workstation. First, the current densities of ZNR, ZNR@Gr, and ZNR/AuPd were measured in the dark, as shown in Fig. 5(a). It is known that current is inversely proportional to resistance at a given voltage, which is based on Ohm's law. JDark (ZNR) was 4.6 × 10⁻⁴ mA cm−2 at 0.8 V versus Ag/AgCl, reflecting the large resistance of ZNR. However, the values of JDark (ZNR/AuPd) and JDark (ZNR@Gr) reached 2.8 × 10⁻³ mA cm−2 and 0.036 mA cm−2, respectively, at 0.8 V versus Ag/AgCl, indicating that the resistance of the electrode decreased significantly. The resistance further decreased nearly by two orders of magnitude after coating with graphene. Moreover, the current density also increased as the potential reached a negative value, which may also be a proof of the decreased resistance of ZNR/AuPd and ZNR@Gr. It is well-known that graphene is a two-dimensional material with excellent electrical conductivity. ZNR coated with graphene is beneficial for transport of the collected electrons to the counter electrode. In addition, AuPd nanoparticles also have limited effect on enhancing the conductivity of the electrode.
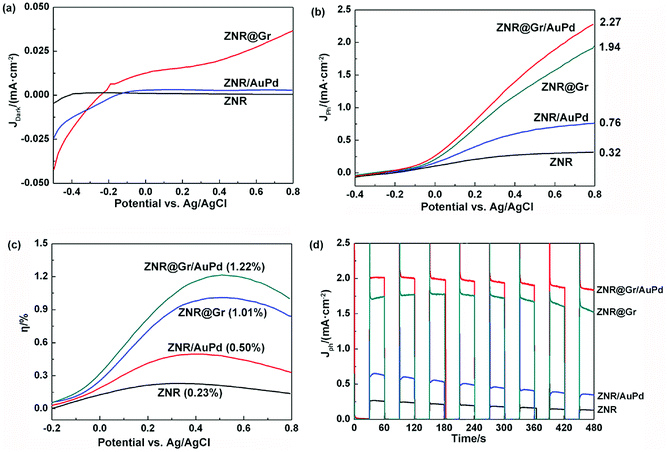 |
| | Fig. 5 (a) Dark current density of ZNR, ZNR/AuPd, and ZNR@Gr. (b) Photo current density and (c) photoconversion efficiency of ZNR, ZNR/AuPd, ZNR@Gr, and ZNR@Gr/AuPd under AM 1.5 G illumination (100 mW cm−2). (d) Intermittent photocurrent density–time curves with 60 s for a period. | |
On the basis of the above conclusion, the photocurrent densities of ZNR, ZNR/AuPd, ZNR@Gr, and ZNR@Gr/AuPd were also measured under irradiation (1.5 G) of 100 mW cm−2 (Fig. 5(b)), showing that all the samples exhibit prominent enhancement of Jph under irradiation. Compared to the result for ZNR, the photocurrent densities of ZNR@Gr and ZNR/AuPd increased by 6.1 and 2.4 times at 0.8 V versus Ag/AgCl, and the values were 1.94 mA cm−2 and 0.76 mA cm−2, respectively. The results suggest that coating with graphene or decoration with AuPd nanoparticles can enhance the PEC performance of the ZNR electrode. Furthermore, the photocurrent density of ZNR@Gr/AuPd increased to 2.27 mA cm−2 at 0.8 V versus Ag/AgCl, which was 7.1 times that of ZNR. The results implied that the overall effects of AuPd and graphene could significantly enhance the PEC activity.
The efficiencies of hydrogen generation (η) for ZNR, ZNR@Gr, ZNR/AuPd, and ZNR@Gr/AuPd were calculated using the following equation:3,26,27
| | |
η = [I(1.23 − Ebias)/Jlight] × 100%
| (1) |
Here,
I is the photocurrent density (mA cm
−2),
Ebias is the applied potential, 1.23 is the standard reduction potential of water formation from hydrogen and oxygen, and
Jlight is the intensity of the solar simulated incident light (100 mW cm
−2). The highest efficiencies of 1.01% and 0.50% for ZNR@Gr and ZNR/AuPd, respectively, were observed at 0.53 and 0.38 V
versus Ag/AgCl, which were higher than 0.23% at 0.35 V
versus saturated Ag/AgCl for bare ZNR. Moreover, the highest efficiency for ZNR@Gr/AuPd reached 1.22% at 0.51 V
versus Ag/AgCl, indicating further enhancement in the efficiency of hydrogen generation. Hence, ZNR@Gr/AuPd as the PEC electrode is the most suitable material for water splitting.
In addition, to evaluate the photoresponse and stability of the samples, the intermittent photocurrent density–time curves of ZNR, ZNR/AuPd, ZNR@Gr, and ZNR@Gr/AuPd photoelectrodes in light on–off cycles within 60 s were measured at 0.60 V versus Ag/AgCl for 480 s (Fig. 5(d)). The nearly vertical climbing and dropping photocurrents were observed when the light was on and off, which indicated quick charge migration in the photoelectrodes. In addition, it was observed that the photocurrent at 480 s decayed compared with the initial photocurrent, which could be due to the photocorrosion of ZnO. The mechanism is described below.5–7,28 The overall reaction for dissolution of ZnO can be expressed as follows:
| | |
O(surface)2− + h+ → O(surface)−
| (2) |
| | |
O(surface)− + 3O2− + 3h+ → 2(O–O2−)
| (3) |
| | |
ZnO + 2h+ → Zn2+ + 0.5O2
| (6) |
On the basis of the discussion above, we can infer that the photocorrosion effect is mainly expressed by the reaction of O(surface)2− and h+. Eventually O(surface)2− on the surface is oxidized to O2 and subsequently, the remaining Zn2+ tends to dissolve into the solution, which can lead to ZnO corrosion gradually. To evaluate the stability of each sample, we defined a method using the intermittent photocurrent density–time curves obtained in this paper. The stability of the sample S is defined as follows:
| |
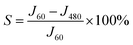 | (7) |
Here,
J60 and
J480 are the photocurrents at 60 s and 480 s, respectively, in
Fig. 5(d). As we can see, the photocurrent at the initial moment when the light is on (
J30) is not stable; thus, we consider the steady photocurrent just before the light is off (
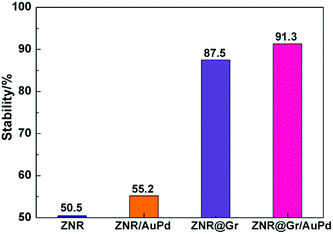
J60) as the initial photocurrent. The calculated results are shown in
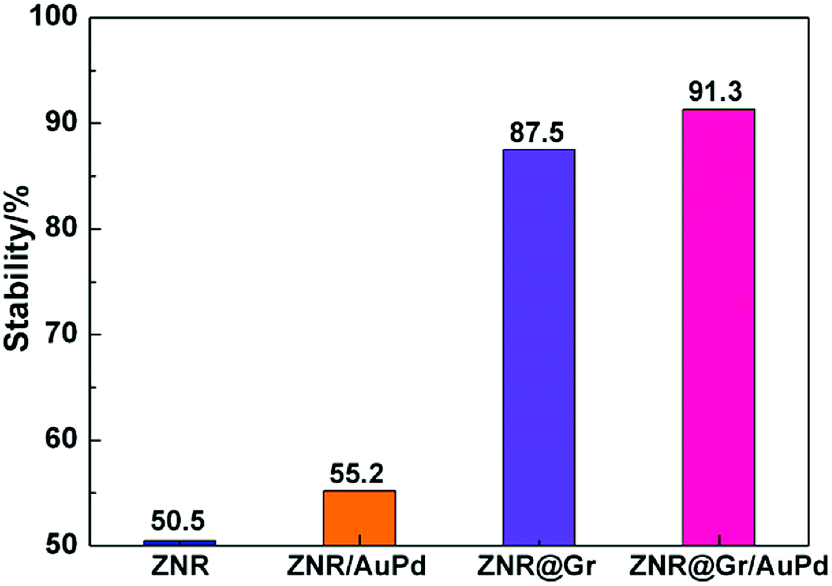
Fig. 6. It can be seen that the bare ZNR electrode shows reduced stability of 50.5%, and it is easily photo-corroded, but the stability increases to 55.2% after being decorated with AuPd nanoparticles. Moreover, the stability naturally increased to 87.5% after the formation of the ZNR@Gr composite. The results exhibit that the combination of AuPd nanoparticles and graphene is beneficial for enhancing the stability and graphene can significantly inhibit photocorrosion. Especially, under the comprehensive effect of AuPd and graphene, the stability of ZNR@Gr/AuPd electrode increased to 91.3%, which makes it more sustainable to generate H
2.
 |
| | Fig. 6 The calculated stability of ZNR, ZNR/AuPd, ZNR@Gr, and ZNR@Gr/AuPd as defined in eqn (7). | |
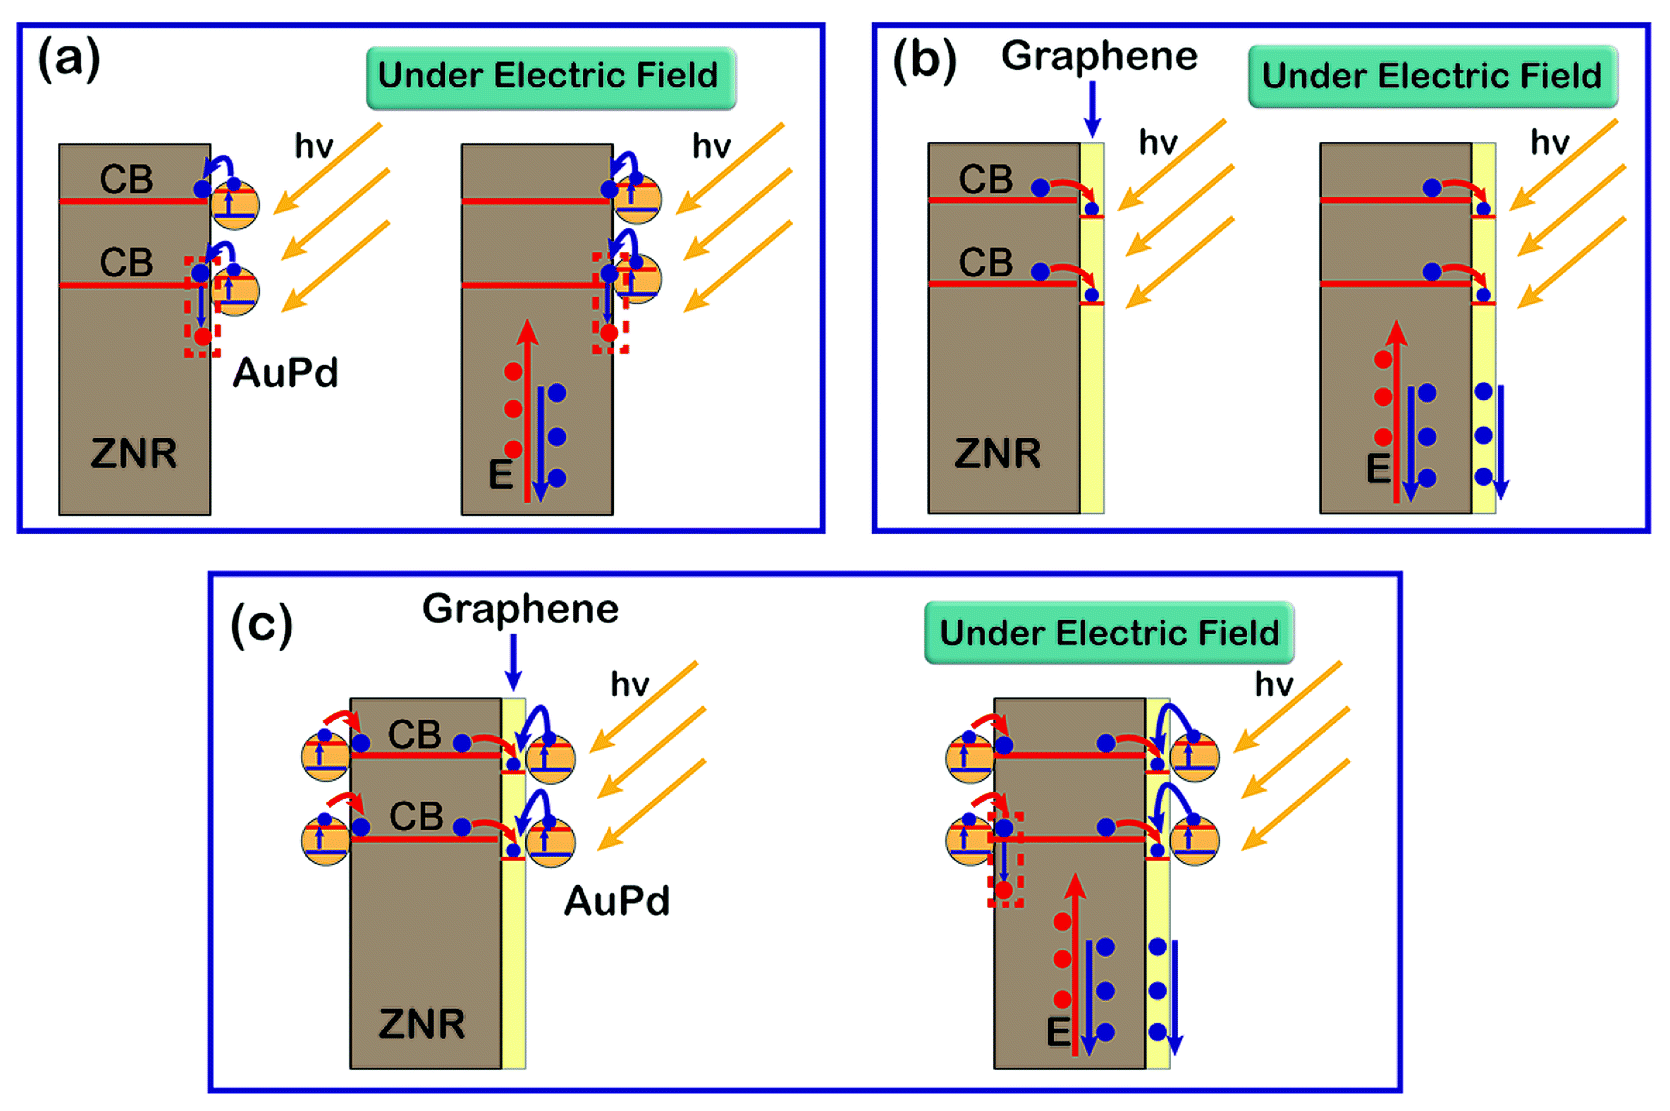
4. PEC mechanism
The PEC mechanism for ZNR/AuPd, ZNR@Gr, and ZNR@Gr/AuPd is shown in Fig. 7, which represents the transfer of photo-charges in different composites under irradiation. It is well-known that for a nanometer-scale noble metal, light can be absorbed when the size is smaller than the incident light to generate hot electrons, which is called surface plasmon resonance (SPR).29 When the noble metal nanoparticles are combined with ZnO, under the effect of SPR, the excited electrons in the noble metal nanoparticles can accumulate at the interface, leading to downward band bending of ZnO; this is beneficial for the transfer of electrons from the noble metal nanoparticles to ZnO.16,17,29 As for ZNR/AuPd, other than the photo-excited electrons and holes in the interior and at the surface of ZNR, the electrons in AuPd were also excited by visible light and then were transferred to the surface of ZNR (Fig. 7(a)). On the one hand, the electrons transferred to the CB of ZNR could increase the electron density, contributing to the enhancement in photocurrent density. On the other hand, since the electrons were transferred to the surface of ZNR, it was highly likely that a number of h+ species could be consumed by the extra electrons, which could inhibit the reaction shown in eqn (2). As a result, the decoration with AuPd nanoparticles can improve the PEC performance and stability of the electrode.
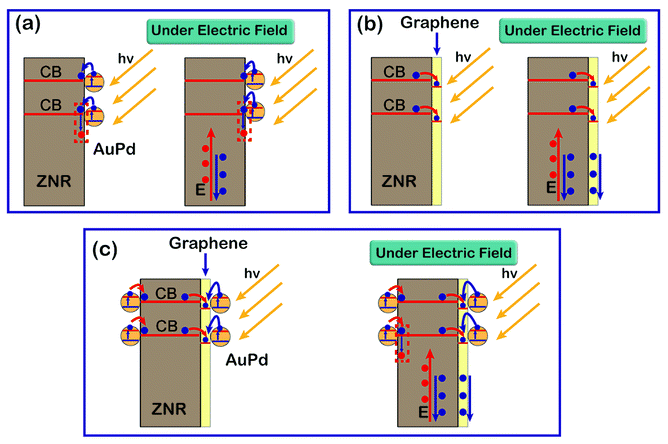 |
| | Fig. 7 Illustration of the PEC mechanism of (a) ZNR/AuPd, (b) ZNR@Gr, and (c) ZNR@Gr/AuPd. | |
Fig. 7(b) illustrates the transfer of electrons and holes in the ZNR@Gr composite. Since the CB of ZnO (−3.95 eV) is higher than the Fermi level of graphene (−4.42 eV),12,16,30 it is easy for the excited electrons in the CB of ZNR to transfer to graphene, which can efficiently separate the electron–hole pairs. It has been demonstrated that the electron transmission capacity of an electrode is improved after combination with graphene (Fig. 5(a)). As a result, the photoelectrons excited in the interior and at the surface of ZNR were collected in graphene and then were quickly transferred to the Pt electrode. In addition, the coverage of graphene on the ZNR surface could prevent the generated Zn2+ from diffusing into the electrolyte when the photocorrosion occurred. Hence, the reaction shown in eqn (5) can be restrained, inhibiting the photocorrosion of ZNR. As a result, the PEC performance and stability of ZNR@Gr significantly improved.
Furthermore, the PEC mechanism of ZNR@Gr/AuPd has also been proposed (Fig. 7(c)). The electrons in the AuPd nanoparticles and the valence band (VB) of ZNR could be excited by visible and UV light, respectively. Since the Fermi level of graphene was lower, the excited photoelectrons were immediately injected into graphene. Compared with the observations for ZNR@Gr, highly efficient utilization of incident light and transfer of more electrons into graphene contributed to further enhancement of PEC performance. In fact, although ZNR was well-coated by graphene, there still existed an exposed area on the ZNR surface. The AuPd nanoparticles could be decorated on the exposed surface simultaneously, which follows the mechanism shown in Fig. 7(b). Under the comprehensive effect of graphene and AuPd nanoparticles, the PEC performance and stability exhibited further improvement and thus, this material is the most suitable material for applications in H2 generation.
5. Conclusions
In summary, a two-step method via electrostatic self-assembly and solution reduction was developed to synthesize a ZNR@GR/AuPd electrode. The SEM and TEM images indicate that ZNR is well-coated with 3–5 layers of graphene, and AuPd nanoparticles with average size of 5 nm are uniformly decorated outside ZNR@Gr. The composite exhibited enhanced light absorption and decreased PL intensity, which implied reduced recombination of photogenerated electron–hole pairs. Due to the coverage of graphene, the electron transmission capacity of the electrode apparently increased. The photocurrent density of 2.27 mA cm−2 and the efficiency of hydrogen generation of 1.22% were obtained at applied bias of 0.8 V and 0.51 V versus Ag/AgCl. The calculated PEC stability was 91.3% after working for 480 s. Finally, the PEC mechanism also explained the transfer of electrons and holes, and a possible reason for the enhancement in PEC stability was proposed. The ZNR@Gr/AuPd electrode with satisfactory PEC performance and stability is a promising material for applications in H2 generation.
Conflicts of interest
There are no conflicts to declare.
References
- Y. Sun, S. Gao and Y. Xie, Chem. Soc. Rev., 2014, 43, 530–546 RSC.
- X. Huang and J. Li, J. Am. Chem. Soc., 2007, 129, 3157–3162 CrossRef CAS PubMed.
- Z. Liu, K. Guo, X. Zhang, T. Hong and B. Wang, Appl. Catal., B, 2015, 179, 61–68 CrossRef.
- M. Ni, M. K. H. Leung, D. Y. C. Leung and K. Sumathy, Renewable Sustainable Energy Rev., 2007, 11, 401–425 CrossRef CAS.
- J. Xiao, X. Hou, L. Zhao and Y. Li, Int. J. Hydrogen Energy, 2016, 41, 14596–14604 CrossRef CAS.
- C. Han, M.-Q. Yang, B. Weng and Y.-J. Xu, Phys. Chem. Chem. Phys., 2014, 16, 16891 RSC.
- H. Fu, T. Xu, S. Zhu and Y. Zhu, Environ. Sci. Technol., 2008, 42, 8064–8069 CrossRef CAS PubMed.
- R. S. Moakhar, A. Kushwaha, M. Jalali, G. K. L. Goh, A. Dolati and M. Ghorbani, J. Appl. Electrochem., 2017, 46, 819–827 CrossRef.
- X. Bai, L. Wang, R. Zong, Y. Lv, Y. Sun and Y. Zhu, Langmuir, 2013, 29, 3097–3105 CrossRef CAS.
- X. Zhang, Y. Li, J. Zhao, S. Wang, Y. Li, H. Dai and X. Sun, J. Power Sources, 2014, 269, 466–472 CrossRef CAS.
- R. Su, R. Tiruvalam, A. J. Logsdail, Q. He, C. A. Downing, M. T. Jensen, N. Dimitratos, L. Kesavan, P. P. Wells, R. Bechstein, H. H. Jensen, S. Wendt, C. R. A. Catlow, C. J. Kiely, G. J. Hutchings and F. Besenbacher, ACS Nano, 2014, 8, 3490–3497 CrossRef CAS PubMed.
- B. Panigrahy and D. D. Sarma, RSC Adv., 2015, 5, 8918–8928 RSC.
- Y. Lu, J. Zhang, L. Ge, C. Han, P. Qiu and S. Fang, J. Colloid Interface Sci., 2016, 483, 146–153 CrossRef CAS PubMed.
- G. Liang, L. He, M. Arai and F. Zhao, ChemSusChem, 2014, 7, 1415–1421 CrossRef CAS PubMed.
- S. Mondal, A. Samanta, B. B. Dhar and R. N. Devi, Catal. Today, 2015, 251, 114–120 CrossRef CAS.
- C. Zhang, M. Shao, F. Ning, S. Xu, Z. Li, M. Wei, D. G. Evans and X. Duan, Nano Energy, 2015, 12, 231–239 CrossRef.
- Y. Qiao, J. Li, H. Li, H. Fang, D. Fan and W. Wang, Biosens. Bioelectron., 2016, 86, 315–320 CrossRef CAS PubMed.
- Y. L. Zhang, Y. Z. Zhang, L. X. Song, Y. Su, Y. F. Guo, L. N. Wu and T. Zhang, RSC Adv., 2018, 8, 885–894 RSC.
- W. S. Hummers JR and R. E. Offeman, J. Am. Chem. Soc., 1958, 1339 CrossRef.
- P. Hu, X. Zhang, N. Han, W. Xiang, Y. Cao and F. Yuan, Cryst. Growth Des., 2011, 11, 1520–1526 CrossRef CAS.
- M. Khenfouch, M. Baitoul and M. Maaza, Opt. Mater., 2012, 34, 1320–1326 CrossRef CAS.
- D. Fu, G. Han, Y. Chang and J. Dong, Mater. Chem. Phys., 2012, 132, 673–681 CrossRef CAS.
- H. W. Jeong, S.-Y. Choi, S. H. Hong, S. K. Lim, D. S. Han, A. Abdel-Wahab and H. Park, J. Phys. Chem. C, 2014, 118, 21331–21338 CrossRef CAS.
- J. Li, Y. Mao, W. Cao, L. Sun and X. Peng, Appl. Phys. A, 2014, 118, 683–690 CrossRef.
- G. R. Li, T. Hu, G. L. Pan, T. Y. Yan, X. P. Gao and H. Y. Zhu, J. Phys. Chem. C, 2008, 112, 11859–11864 CrossRef CAS.
- K. Guo, Z. Liu, Y. Wang, Y. Zhao, Y. Xiao, J. Han, Y. Li, B. Wang and T. Cui, Int. J. Hydrogen Energy, 2014, 39, 13408–13414 CrossRef CAS.
- Z. Liu, Y. Wang, B. Wang, Y. Li, Z. Liu, J. Han, K. Guo, Y. Li, T. Cui, L. Han, C. Liu and G. Li, Int. J. Hydrogen Energy, 2013, 38, 10226–10234 CrossRef CAS.
- L. Zhang, H. Cheng, R. Zong and Y. Zhu, J. Phys. Chem. C, 2009, 113, 2368–2374 CrossRef.
- M.-K. Lee, T. G. Kim, W. Kim and Y.-M. Sung, J. Phys. Chem. C, 2008, 112, 10079–10082 CrossRef CAS.
- B. Li and H. Cao, J. Mater. Chem., 2011, 21, 3346–3349 RSC.
|
| This journal is © The Royal Society of Chemistry 2019 |
Click here to see how this site uses Cookies. View our privacy policy here. 
 Open Access Article
 This Open Access Article is licensed under a Creative Commons Attribution-Non Commercial 3.0 Unported Licence
 *ab,
Yunlong Zhang
*ab,
Yunlong Zhang