
 Open Access Article
 This Open Access Article is licensed under a Creative Commons Attribution-Non Commercial 3.0 Unported Licence
Quantitative evaluation of relationships between adsorption and partition of atrazine in biochar-amended soils with biochar characteristics†
Zhendong Zhaoa,
Qianqian Wua,
Tiantian Niea and
Wenjun Zhou *ab
*ab
aDepartment of Environmental Science, Zhejiang University, Hangzhou, Zhejiang 310058, China. E-mail: wenjunzhou@zju.edu.cn; Fax: +86-571-88982591; Tel: +86-571-88982591
bZhejiang Provincial Key Laboratory of Organic Pollution Process and Control, Hangzhou, Zhejiang 310058, China
First published on 31st January 2019
Abstract
Atrazine (ATZ) adsorption in two natural soils amended with biochars produced from different feedstocks at 300, 500, and 700 °C were investigated; further, the relationships between the surface and partition adsorption capacities of ATZ in biochar-amended soils with biochar characteristics were quantitatively evaluated. The results revealed that high aromaticity, hydrophobicity, and low polarity of biochar facilitated ATZ adsorption. The addition of selected biochars significantly increased the adsorption of ATZ on paddy soil (PS) and black soil (BS) by 5.2–7.5 times and 2.3–4.2 times, respectively. On the contrary, the degree of increase in surface adsorption was much higher than that in partition adsorption, mainly due to the role of the specific adsorption of ATZ on biochar. Meanwhile, the respective contributions of surface and partition adsorptions to the total ATZ adsorption on biochar-amended soil changed with different addition amounts of biochar. The multiple nonlinear regression analysis demonstrated the linear dependence of H/C ratio, (O + N)/C ratio, and specific surface area (SSA) of biochar on the surface adsorption capacity of biochar-amended PS and BS, as well as the linear dependence of organic carbon and ash contents on the partition adsorption capacity of biochar-amended PS and the linear dependence of the H/C ratio and SSA on the partition adsorption capacity of biochar-amended BS. In biochar-amended soil systems, interactions between biochar and soil could affect ATZ adsorption, and organic matter in biochar might compensate for the role of soil organic matter in the competition for adsorption sites with a decrease in the biochar pyrolysis temperature.
1. Introduction
Biochar is a carbon-rich residue produced by the incomplete pyrolysis of biomass,1,2 which is widely present in soil and generates potential benefits for carbon sequestration, soil fertility, and immobilization and stabilization of hazardous chemicals,3–6 due to its distinctive physicochemical characteristics, namely, large specific surface area (SSA), abundant porous structure, multifunctional groups, and strong adsorption capacity.7–10 Inevitably, these vital characteristics of biochar can be altered once applied to the soil environment via short-term or long-term physical, chemical, and biological processes, including natural aging, artificial oxidation, and additional interactions with soil components, such as dissolved organic matter and minerals,11–14 which, in turn, are likely to affect the adsorption behavior of contaminants, as well as their ultimate transport, fate, and bioavailability in soil.15In particular, studies involving the application of biochar for the immobilization of organic compounds in soil have been extensively reported.16–19 Biochar exhibited 10–1000 times stronger affinity with organic compounds than natural organic matter; therefore, a small amount of biochar amended into the soil can dominate the overall adsorption of organic compounds.20 For instance, the addition of only 0.05–0.1% biochar of pine needles to the soil considerably enhanced the adsorption of polycyclic aromatic hydrocarbons.21 Furthermore, the adsorption behavior of biochar for contaminants was observed to be a function of its physicochemical properties, such as pyrolysis temperature, organic carbon (OC) content, SSA, and pore size distribution. As reported from previous studies, the strong adsorption capacity of biochar in soil could be likely attributed to its high temperature, low OC content, large surface area, and abundant porous structures.22,23 In addition, it is well known that the addition of biochar into soil not only enhanced the adsorption of organic compounds, but also affected the nature of the adsorption mechanism.2,24 The increased nonlinear adsorption of organic compounds on biochar-amended soil when compared with that of the original soil suggested the mechanism of transformation from a hydrophobic partition in the original soil into the surface adsorption–partition interaction.25
Meanwhile, the negative effects of biochar on the adsorption of organic contaminants on biochar-amended soil have also been reported.26 The interaction between biochar and soil components was considered to be the main factor contributing toward the lower adsorption of organic contaminants by biochar-amended soils. Studies have demonstrated that dissolved organic matter in soil could block the pore surfaces or compete for the adsorption sites of biochar;19 in addition, soil minerals could exhibit a pore-expanding effect on biochar, which was favorable for the adsorption of organic compounds to the biochar-amended soil than to the original soil.27 Although studies on the adsorption behavior of organic contaminants on biochar-amended soil have been more frequent, the relationship between the physicochemical characteristics of the added biochar and the adsorption capacity of biochar-amended soil is still not clear. In addition, the mechanisms affecting the adsorption of contaminants on biochar-amended soil have not been fully understood, particularly for the combined surface-partition adsorption mechanism.
In this study, atrazine (ATZ) was selected as the model organic contaminant on behalf of a typical pesticide, due to the long-term utilization of agricultural pesticides and repeated fertilization with animal manure in farmland soil.23 Biochars derived from rice straw, bamboo, and cow manure were added to two typical agricultural soils in China, namely, paddy soil (PS) and black soil (BS), to examine the effect of biochars produced from different feedstocks on ATZ adsorption by biochar-amended soil via a surface-partition adsorption model, and multiple nonlinear regression analysis was used to further reveal the relationship between the surface and partition adsorption capacities of ATZ on biochar-amended soils with biochar characteristics, ultimately providing the theoretical foundation for potential applications of biochar for the remediation of organic contaminants in farmland soils.
2. Materials and methods
2.1 Chemicals and materials
ATZ was purchased from Acros Organics (USA) with a reported purity of 97%, and the detailed molecular structure and physicochemical properties are listed in Table S1.† Rice straw stock was collected from a farmland in the Jiangsu province, China; bamboo stock was purchased from the Zhejiang province, China; cow manure stock was collected from a hoggery in the Anhui province, China. BS and PS were collected from the Heilongjiang and Zhejiang provinces, respectively. HPLC-grade organic solvents used in this study were obtained from Thermo Fisher Scientific Co. Ltd. (USA). All the other reagent-grade chemicals were purchased from Aladdin Chemistry Co. Ltd. (China). Deionized water was used for all the experiments.2.2 Production and characterization of biochars
Biochars were produced from rice straw, bamboo, and cow manure at a temperature of 300–700 °C, as described by Li et al.27 The detailed method is presented in the ESI.† The obtained biochars were rinsed several times with deionized water to remove the remaining minerals and air-dried, hereafter referred to as RCX, BCX, and MCX, where RC, BC, and MC refer to rice straw biochar, bamboo biochar, and cow manure biochar, respectively, and X refers to the pyrolysis temperature.The elemental compositions of the biochars were measured using an elemental analyzer (Thermo Finnigan Flash EA 1112), and the ash contents of the samples were determined by heating the sample in a muffle furnace at 800 °C for 6 h. The SSA and pore size distribution of the biochars were determined using the BET N2 adsorption method. The pH value of the biochars was measured using a pH detector (METTLER TOLEDO S220) with a solid-to-water ratio of 1![[thin space (1/6-em)]](https://www.rsc.org/images/entities/char_2009.gif) :20 (w/v). The surface functional groups of the biochars were analyzed using Fourier-transform infrared spectroscopy (FTIR). X-ray diffraction (Bruker D8 Advance) was used to determine the crystal mineral formation of biochars from different biomasses.
:20 (w/v). The surface functional groups of the biochars were analyzed using Fourier-transform infrared spectroscopy (FTIR). X-ray diffraction (Bruker D8 Advance) was used to determine the crystal mineral formation of biochars from different biomasses.
2.3 Batch adsorption experiments
Batch adsorption experiments were conducted in triplicates according to the guidelines of the Organization for Economic Co-operation and Development (OECD, 2000). A certain amount of BS or PS amended with 0–2.0% (w/w) biochars was weighed into 22 mL glass vials with Teflon-lined screw caps. The ratio was chosen based on the appropriate additive proportion of biochar in natural soils, which guarantees full contact between the biochar and soil in an aqueous suspension. Further, 20 mL of aqueous solutions containing ATZ (0.5–20 mg L−1) was added into each vial. The background solution contained 0.01 M NaNO3 to maintain a constant ionic strength, 100 mg L−1 NaN3 to minimize biodegradation, and solution pH was adjusted by the addition of 0.1 M HNO3 or NaOH to ensure desirable pH at the adsorption equilibrium.The preliminary experiments indicated that 48 h was sufficient to attain equilibrium for ATZ adsorption by biochars and soils; further, microbial degradation, volatilization, and adsorption to glass walls were negligible during the adsorption experiments. The glass vials were maintained in dark, shaken for corresponding time at 25 °C, and centrifuged for 10 min. An appropriate aliquot of the supernatant was then filtered through a 0.45 μm nylon membrane.
The ATZ concentration in the supernatant was determined by HPLC (LC-20AT, Shimadzu, Japan) equipped with an Agilent Eclipse XDB-C18 reversed-phase column (4.6 × 150 mm, 5 μm, Supelco, USA) and a UV detector at 225 nm at a column temperature of 25 °C. Methanol/water (70:30, v/v) was employed as the mobile phase for ATZ. The equilibrium adsorption amount of ATZ was calculated according to the mass difference between the initial and equilibrium concentrations in aqueous solutions.
3. Results and discussion
3.1 Biochar characterization
The physicochemical properties including pH, bulk elemental compositions, ash content, and atomic ratios of biochars produced from different feedstocks at 300–700 °C are listed in Table 1. Under the same pyrolysis temperature, biochar properties were strongly feedstock-dependent. The C contents of biochars derived from bamboo were observed to be far higher than those derived from rice straw and cow manure. By contrast, MC exhibited the highest ash content, followed by RC and BC, which was consistent with previous studies.25 In this study, ash (or mineral) presence was attributed to the silica for MC and potassium chloride for RC by means of the XRD spectra (Fig. S1†). These properties were comprehensively reported in an earlier study.28 The calculated H/C, O/C, and (O + N)/C atomic ratios of biochar were used as indexes for aromaticity, hydrophobicity, and polarity, respectively.29 The higher H/C ratios of MC indicated a lower degree of carbonization and aromaticity when compared with those of RC and BC, while the higher O/C and (O + N)/C ratios of RC suggested the lower hydrophobicity and higher polarity than BC and MC. BC had the lowest polarity among all the studied biochars due to the lower ash content than RC and MC, which could induce an adverse effect on the protection of O-containing functional groups.30 This was also consistent with the previous conclusion that the deashing treatment of the biochar with high ash content decreased the surface polarity to a large extent. A van Krevelen diagram was used to understand the selective loss of elements during the hydration and carbonization of biochar by comparing the H/C and O/C ratios (Fig. S2†). The decrease in aromaticity of the biochars resulted in a consequent decrease in hydrophobicity, which was ascribed to the loss of volatile hydrocarbons and increase in C contents of the biochars.31| Sample | pH | Ash (%) | Elemental composition | H/C | O/C | (O + N)/C | |||
|---|---|---|---|---|---|---|---|---|---|
| C (%) | H (%) | N (%) | O (%) | ||||||
| RC300 | 7.19 | 19.15 | 54.91 | 3.04 | 1.29 | 21.61 | 0.66 | 0.26 | 0.283 |
| RC400 | 9.12 | 23.28 | 54.96 | 2.23 | 1.26 | 18.27 | 0.49 | 0.22 | 0.241 |
| RC500 | 10.20 | 25.19 | 57.00 | 1.72 | 1.08 | 15.01 | 0.36 | 0.18 | 0.192 |
| RC600 | 10.20 | 26.58 | 61.16 | 1.09 | 0.93 | 10.24 | 0.21 | 0.11 | 0.125 |
| RC700 | 10.33 | 27.65 | 63.35 | 0.95 | 1.12 | 6.93 | 0.18 | 0.073 | 0.088 |
| BC300 | 6.87 | 1.38 | 72.93 | 3.79 | 0.58 | 21.32 | 0.62 | 0.20 | 0.20 |
| BC400 | 8.12 | 1.68 | 77.64 | 3.28 | 0.66 | 16.74 | 0.51 | 0.14 | 0.15 |
| BC500 | 9.16 | 2.0 | 82.41 | 2.59 | 0.70 | 12.3 | 0.38 | 0.099 | 0.11 |
| BC600 | 10.44 | 2.24 | 87.93 | 1.71 | 0.78 | 7.34 | 0.23 | 0.056 | 0.063 |
| BC700 | 10.37 | 3.63 | 89.85 | 0.94 | 0.81 | 5.97 | 0.13 | 0.035 | 0.043 |
| MC300 | 7.54 | 34.15 | 45.74 | 3.21 | 2.62 | 17.28 | 0.84 | 0.21 | 0.26 |
| MC400 | 8.10 | 38.38 | 45.28 | 2.59 | 2.28 | 14.47 | 0.69 | 0.17 | 0.21 |
| MC500 | 9.04 | 46.03 | 42.45 | 1.49 | 2.08 | 11.45 | 0.42 | 0.13 | 0.16 |
| MC600 | 9.22 | 48.2 | 44.32 | 1.07 | 2.04 | 8.14 | 0.29 | 0.065 | 0.11 |
| MC700 | 9.53 | 52.63 | 41.84 | 0.61 | 1.21 | 6.71 | 0.20 | 0.059 | 0.084 |
The SSA and pore size distribution of all the biochars are listed in Table 2. The SSA and total pore volume (TPV) of the biochars derived from different feedstocks gradually increased with the increase in the pyrolysis temperature. It was clearly obvious that BC had the largest SSA and micropore volume (MPV), particularly at a relatively high temperature; this indicated that BC had a more abundant pore structure than RC and MC. The surface functional groups of biochars were characterized by FTIR, and the corresponding spectra are shown in Fig. S3.† The reduction in the intensity of the peaks at 2931 cm−1, 1370 cm−1, and 1458 cm−1 assigned to the stretching vibration of –CH2–/–CH3 and the increase in the intensity of the peak at 1596 cm−1 assigned to the stretching vibration of with an increase in the pyrolysis temperature exhibited the transformation of aliphatic carbons into aromatic carbons. Meanwhile, the attenuation in the intensity of the peak at around 3400 cm−1 assigned to the stretching vibration of –OH showed decreased polarity with an increase in the pyrolysis temperature of biochars.
| Biochar | aSSA (m2 g−1) | bMPA (m2 g−1) | cESA (m2 g−1) | dTPV (cm3 g−1) | eMPV (cm3 g−1) | fAPD (nM) | SSA/OC (m2 g−1) |
|---|---|---|---|---|---|---|---|
| a SSA: specific surface area.b MPA: micropore area.c ESA: external surface area.d TPV: total pore volume.e MPV: micropore volume.f APD: average pore diameter. | |||||||
| RC300 | 7.981 | 0.000 | 18.645 | 2.06 × 10⁻² | 0.000 | 10.351 | 14.532 |
| RC400 | 13.562 | 0.000 | 17.566 | 2.12 × 10⁻² | 0.000 | 6.275 | 24.674 |
| RC500 | 22.445 | 16.692 | 13.727 | 2.84 × 10⁻² | 0.015 | 4.621 | 39.375 |
| RC600 | 106.163 | 89.301 | 23.441 | 9.52 × 10⁻² | 0.073 | 3.382 | 173.575 |
| RC700 | 141.124 | 102.772 | 29.728 | 1.14 × 10⁻¹ | 0.084 | 3.234 | 222.774 |
| BC300 | 4.143 | 0.000 | 15.987 | 1.35 × 10⁻² | 0.000 | 9.823 | 5.681 |
| BC400 | 15.641 | 9.064 | 9.889 | 1.56 × 10⁻² | 0.008 | 3.983 | 20.144 |
| BC500 | 52.525 | 35.745 | 22.130 | 5.01 × 10⁻² | 0.031 | 3.827 | 63.732 |
| BC600 | 199.483 | 155.331 | 33.565 | 1.53 × 10⁻¹ | 0.126 | 3.244 | 226.876 |
| BC700 | 340.062 | 188.506 | 61.485 | 2.13 × 10⁻¹ | 0.157 | 2.515 | 378.486 |
| MC300 | 8.766 | 0.000 | 16.006 | 2.86 × 10⁻² | 0.000 | 13.071 | 19.154 |
| MC400 | 15.212 | 0.000 | 18.368 | 2.96 × 10⁻² | 0.000 | 7.783 | 33.5943 |
| MC500 | 21.061 | 5.162 | 21.389 | 3.77 × 10⁻² | 0.006 | 7.163 | 49.6047 |
| MC600 | 58.703 | 32.323 | 38.805 | 7.21 × 10⁻² | 0.030 | 4.054 | 132.446 |
| MC700 | 166.121 | 61.621 | 74.493 | 1.39 × 10⁻¹ | 0.056 | 3.343 | 397.045 |
3.2 Structure–activity relationship between biochar physicochemical properties and adsorption capacity for ATZ
The adsorption isotherms of ATZ on RC300–700, BC300–700, and MC300–700 are shown in Fig. S4,† and the Freundlich model fitting parameters are listed in Table S2.† The adsorption data effectively fitted the Freundlich model as indicated by the correlation coefficients (R2 ≥ 0.96). The adsorption capacities of the biochars for ATZ increased with the pyrolysis temperature. Among the three types of biochars produced at 300–700 °C, RC showed the highest adsorption affinity toward ATZ. Moreover, the adsorption isotherms of biochar produced at 500–700 °C showed stronger nonlinearity with n values ranging from 0.195 to 0.509, which indicated that pore-filling, H-bonding effect, and π–π electron donor–acceptor (EDA) interaction played a critical role in the adsorption of organic compounds on carbonaceous adsorbents in addition to hydrophobic partition.30,32 Further, this nonlinearity was found to be more significant for MC than BC and RC.As reported from previous studies, several possible interactions including hydrophobic effect, H-bonding, π–π EDA, and their strength and contribution to the overall adsorption were a function of the properties of both organic compounds and adsorbents.33,34 For example, the adsorption of hydrophobic organic contaminants (HOCs) on low-temperature biochars that generally contained more hydrophilic groups could be involved in more interactions via specific adsorption including H-bonding and π–π EDA interaction between the aromatic surfaces of carbonaceous adsorbent and adsorbate.35 In contrast, these surface polar oxygen-containing functional groups were expected to form three-dimensional water clusters via strong H-bonding and then hinder HOCs from approaching the available adsorption sites, in turn, suppressing the adsorption of HOCs by biochars.30 In addition, the surface polarity of biochar was also found to play an important role in controlling the adsorption of organic contaminants by π–π EDA interactions between electron-rich (π-donor) and π-acceptor sites in organic matter within the biochar.7
To further investigate the effects of the physicochemical properties on the adsorption capacity of biochars toward ATZ, the correlations between the OC-normalized adsorption coefficient logKoc (logKoc = logQe/(Cefoc)) of ATZ at three different equilibrium concentrations and the H/C, O/C, and (O + N)/C ratios of the selected biochars are shown in Fig. 1, where Sw is the aqueous solubility of ATZ. These results indicated that the logKoc values of ATZ at three different equilibrium concentrations were negatively correlated with the H/C, O/C, and (O + N)/C atomic ratios of the biochars, which suggested that aromaticity and hydrophobicity of the biochars facilitate the adsorption of ATZ. However, the polarity of biochar was not favorable for the adsorption of ATZ. Furthermore, the significant and positive correlations between the n values of ATZ adsorption on biochars and H/C, O/C, and (O + N)/C atomic ratios of biochars are shown in Fig. S5.† Evidently, the increase in the aromaticity and hydrophobicity of biochars was responsible for the nonlinearity in ATZ adsorption. However, the n values of ATZ adsorption for MC were higher than those for BC and RC, which indicated that the hydrophobic interaction played a more critical role in the adsorption of ATZ on MC.
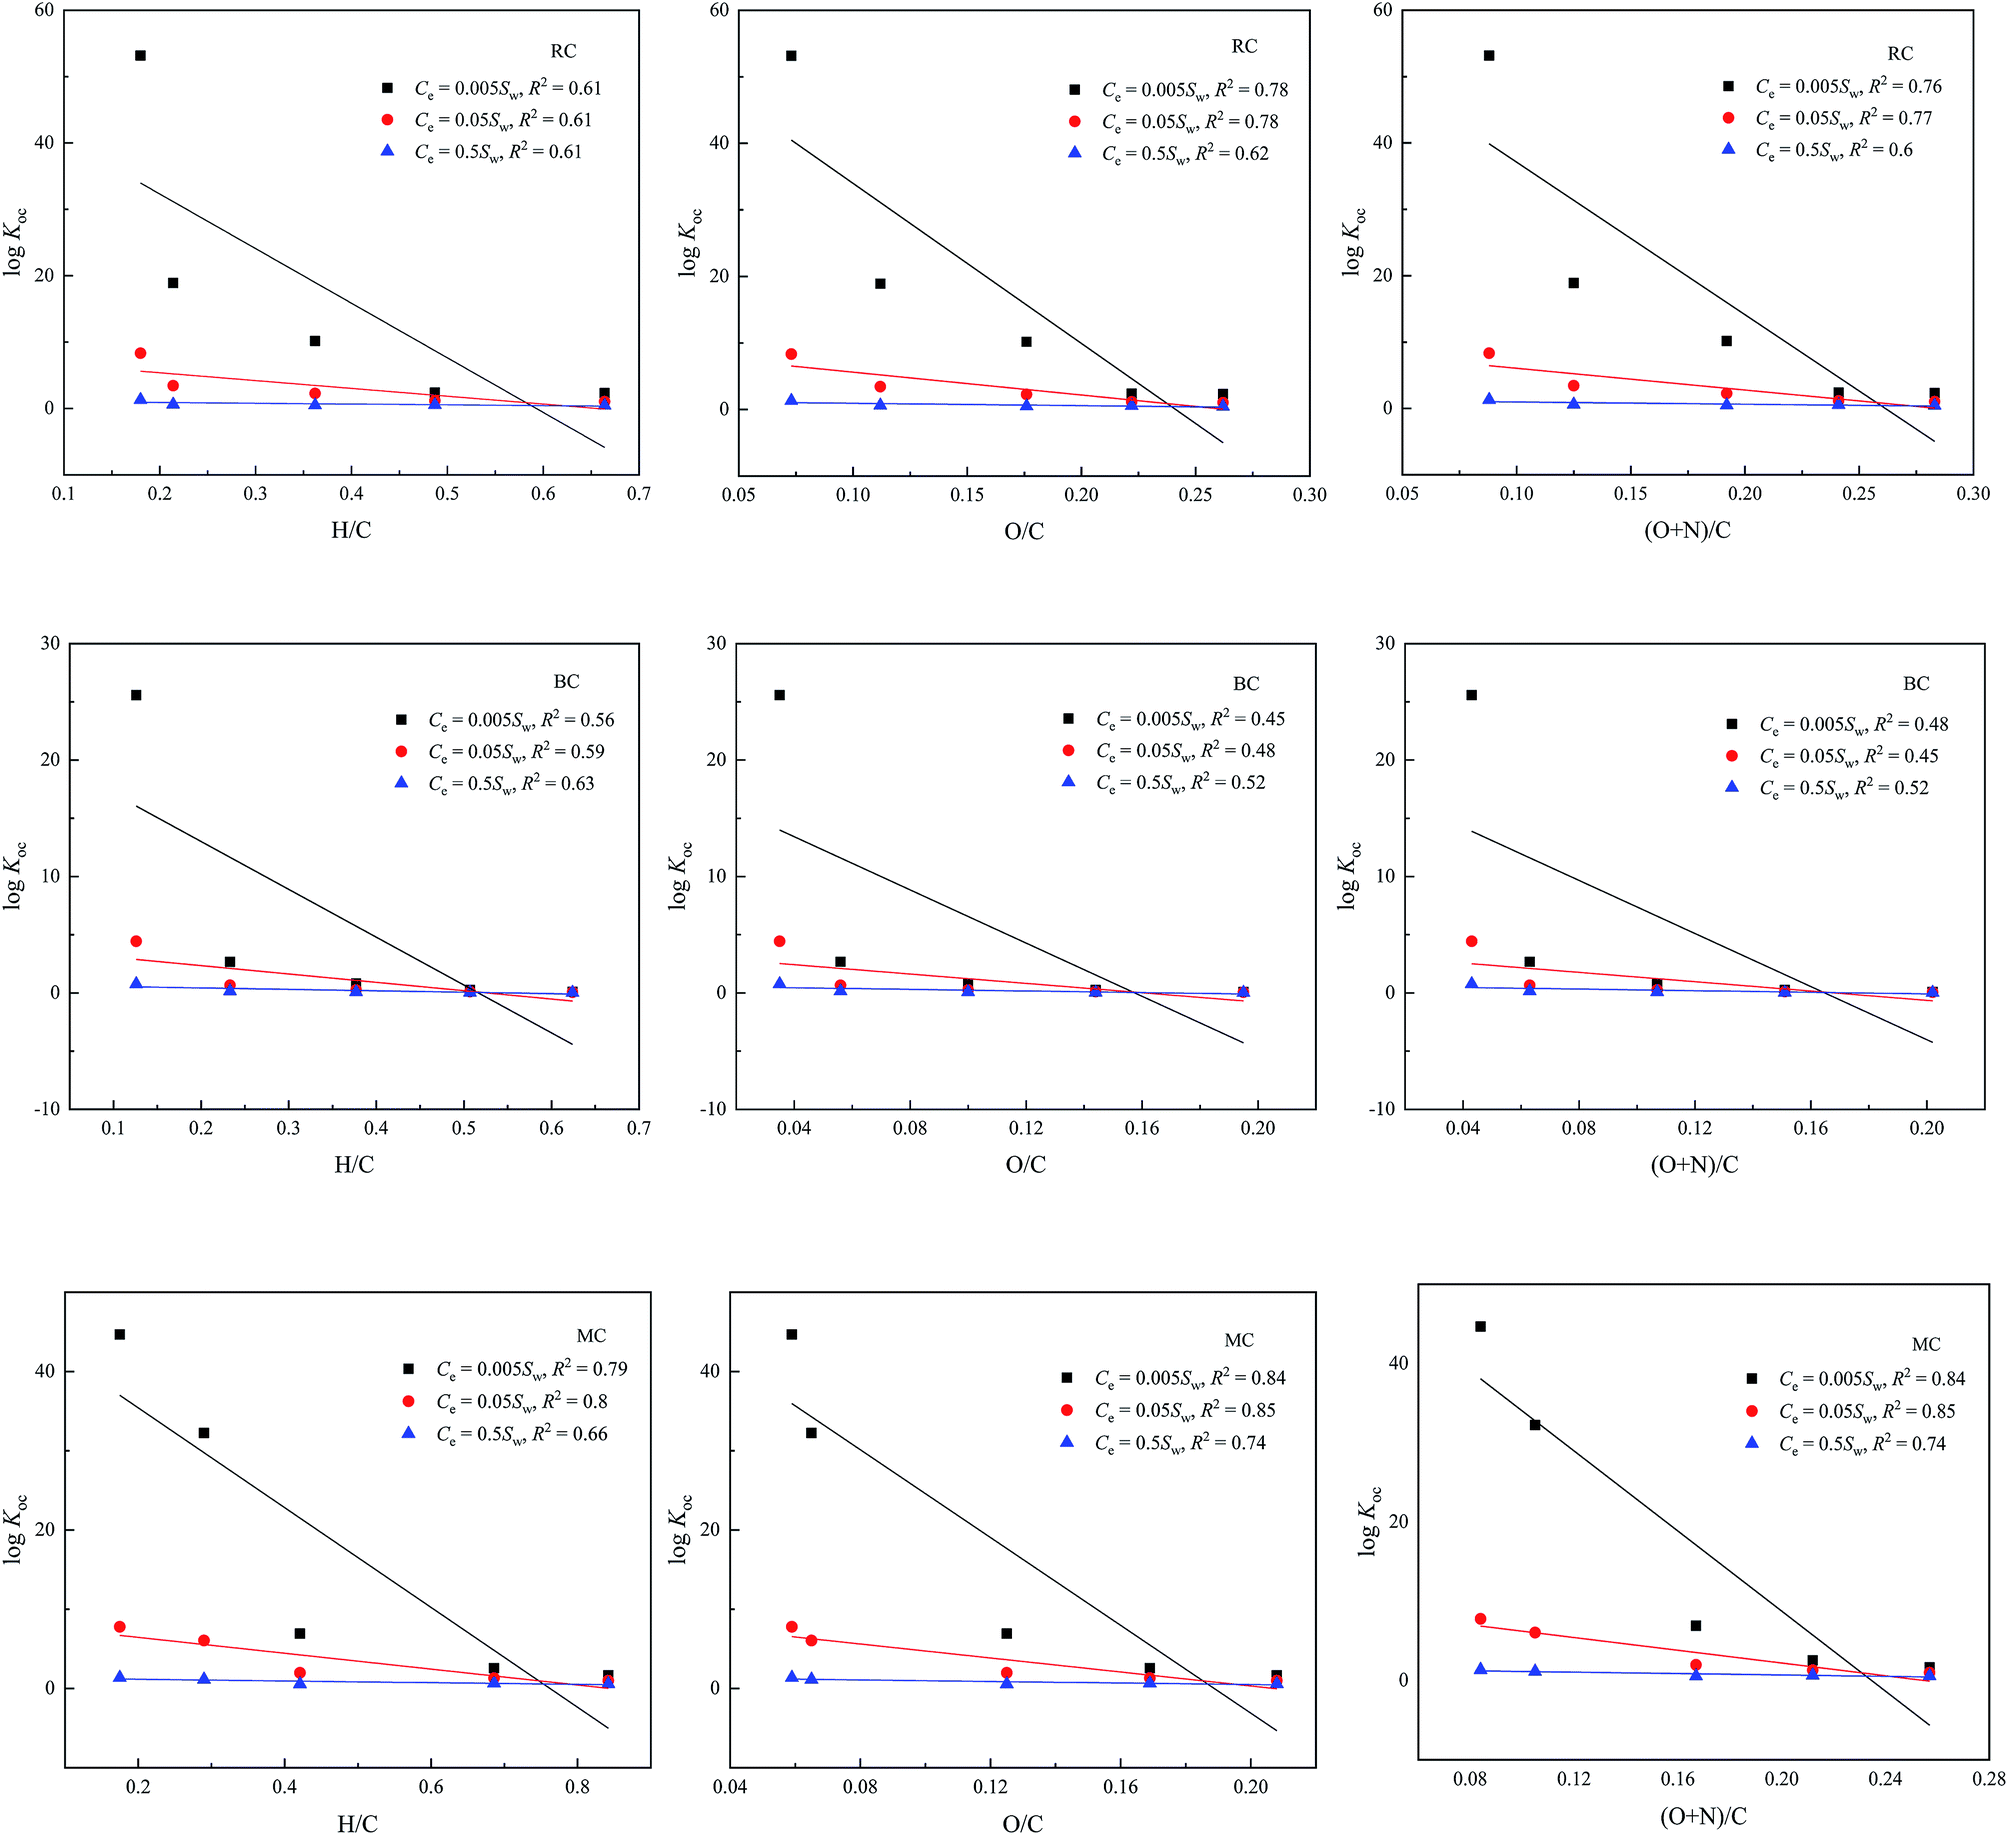 | ||
| Fig. 1 Correlations between logKoc (mL g−1) of ATZ at three different equilibrium concentrations and H/C, O/C, and (O + N)/C atomic ratios of the selected biochars. | ||
3.3 Enhanced adsorption of ATZ by soil amended with biochars
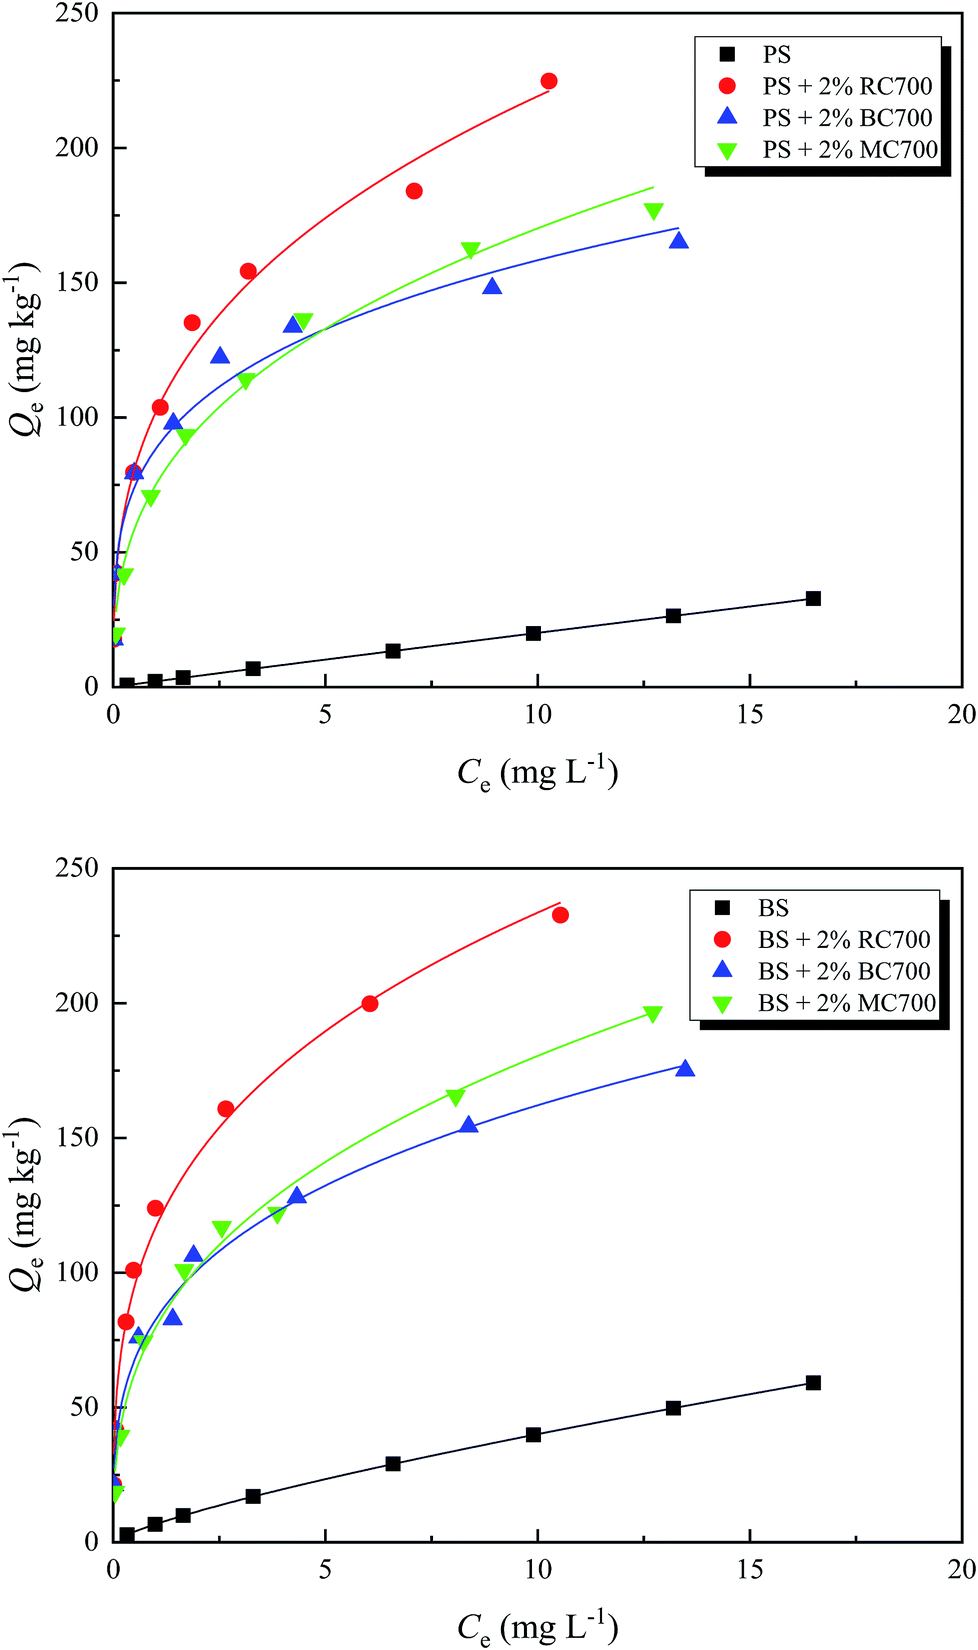 | ||
| Fig. 2 Adsorption isotherms of ATZ on PS and BS amended with 2% RC, 2% BC, and 2% MC. | ||
| QT = QA + Qp = QA + KpCe | (1) |
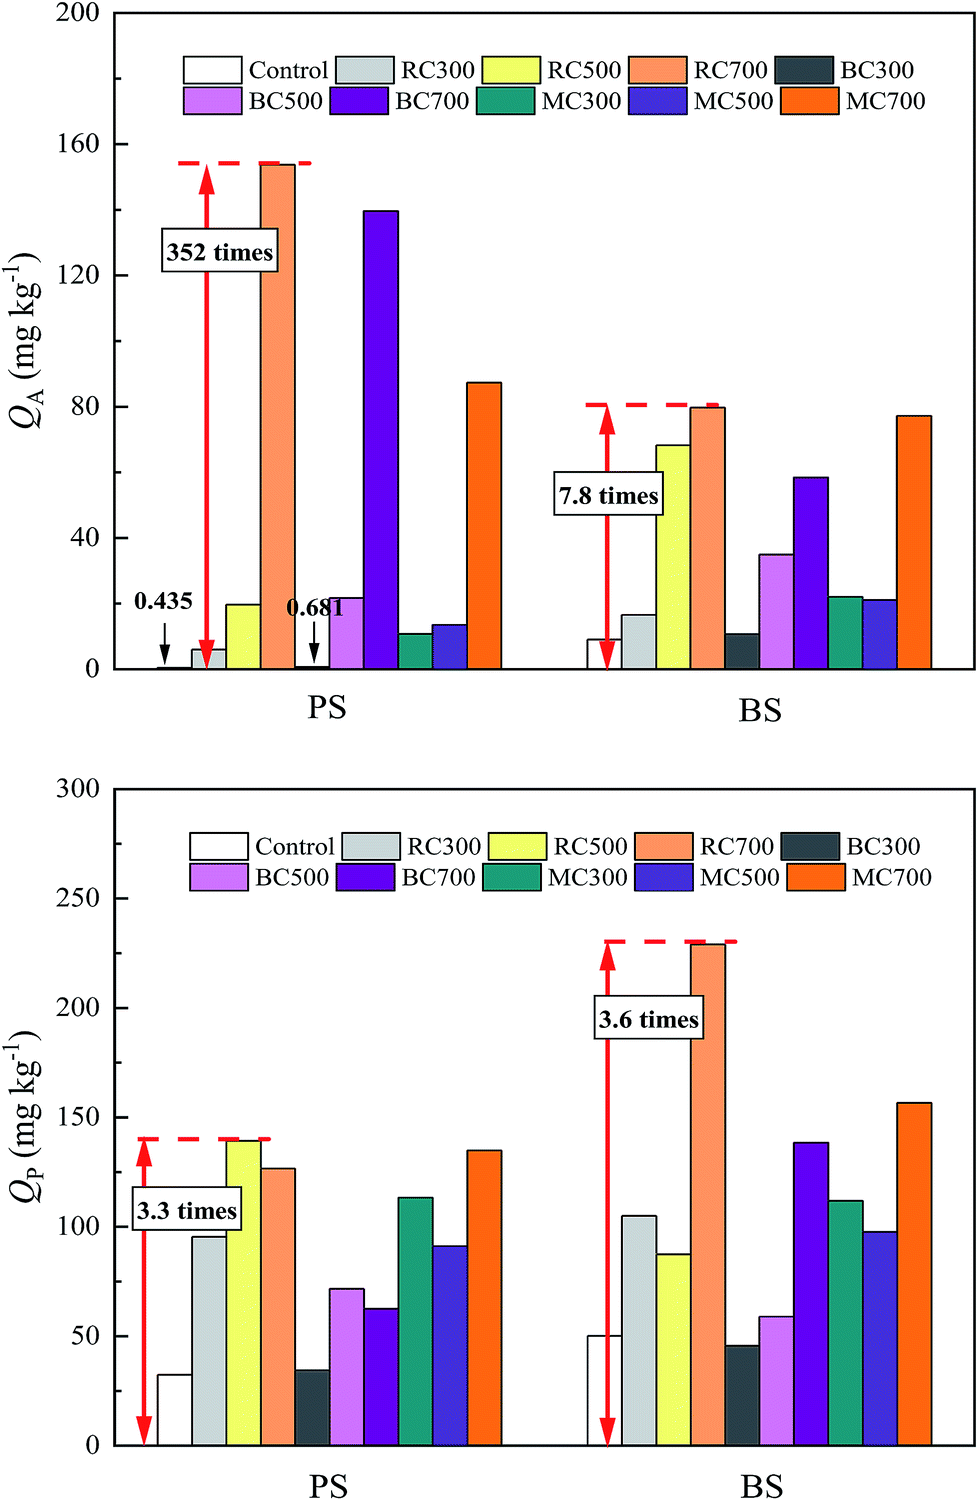 | ||
| Fig. 3 Surface adsorption amount (QA) and partition adsorption amount (QP) of ATZ on soil and biochar-amended soil at Ce = 0.5Sw. | ||
Meanwhile, the effects of the addition ratio of biochar on the surface and partition adsorption amounts of ATZ on biochar-amended soil are shown in Fig. 4. After the addition of biochar, the partition adsorption amount of ATZ on biochar-amended soil increased with the addition ratio, whereas the surface adsorption amount of ATZ on biochar-amended soil exhibited a different changing trend due to the variation in the addition ratio of biochar. When the addition ratio of the biochar was more than 1.5%, the surface adsorption amount of ATZ for biochar-amended BS, in turn, decreased, but it still increased for biochar-amended PS, indicating that the interaction between biochar and BS might affect the surface adsorption of ATZ on biochar-amended BS. The OC content of BS was far higher than that of PS, to a certain extent, making a contribution to the partition adsorption in the mixed system. Therefore, this part of the partition adsorption could compete against the surface adsorption of biochar for adsorption sites. Moreover, the respective contributions of surface adsorption and partition adsorption toward the total adsorption of ATZ on biochar-amended soil changed with the different addition ratios of biochars.
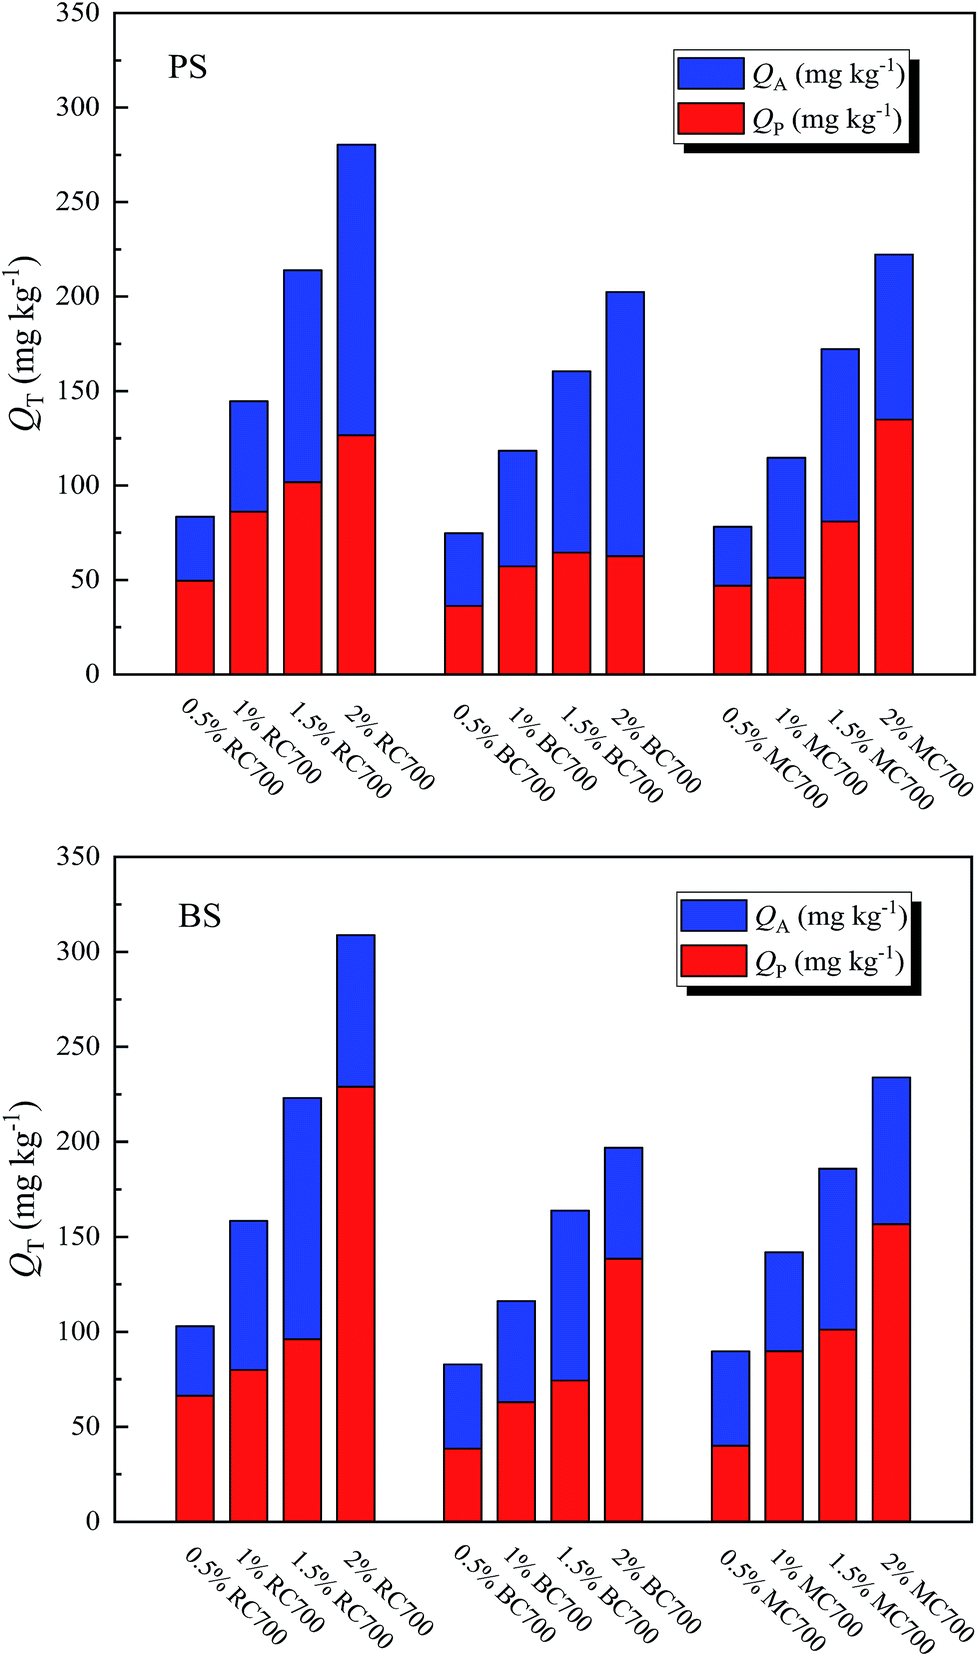 | ||
| Fig. 4 Effect of addition ratio of biochar on QA and QP of ATZ on biochar-amended soils. | ||
| YA-PS = +399.1 + 736.8x12 + 2875.7x22 − 951.6x1 − 1116.2x2 − 0.487x5; (R2 = 0.903) | (2) |
| YP-PS = −190.5 − 394x32 − 0.043x42 + 616.1x3 + 4.5x4; (R2 = 0.762) | (3) |
| YA-BS = +324.9 + 625.9x12 + 964x22 − 875.5x1 − 258.2x2 − 0.75x5; (R2 = 0.943) | (4) |
| YP-BS = +407.8 + 1038.7x12 − 1206.5x1 − 0.17x5; (R2 = 0.753) | (5) |
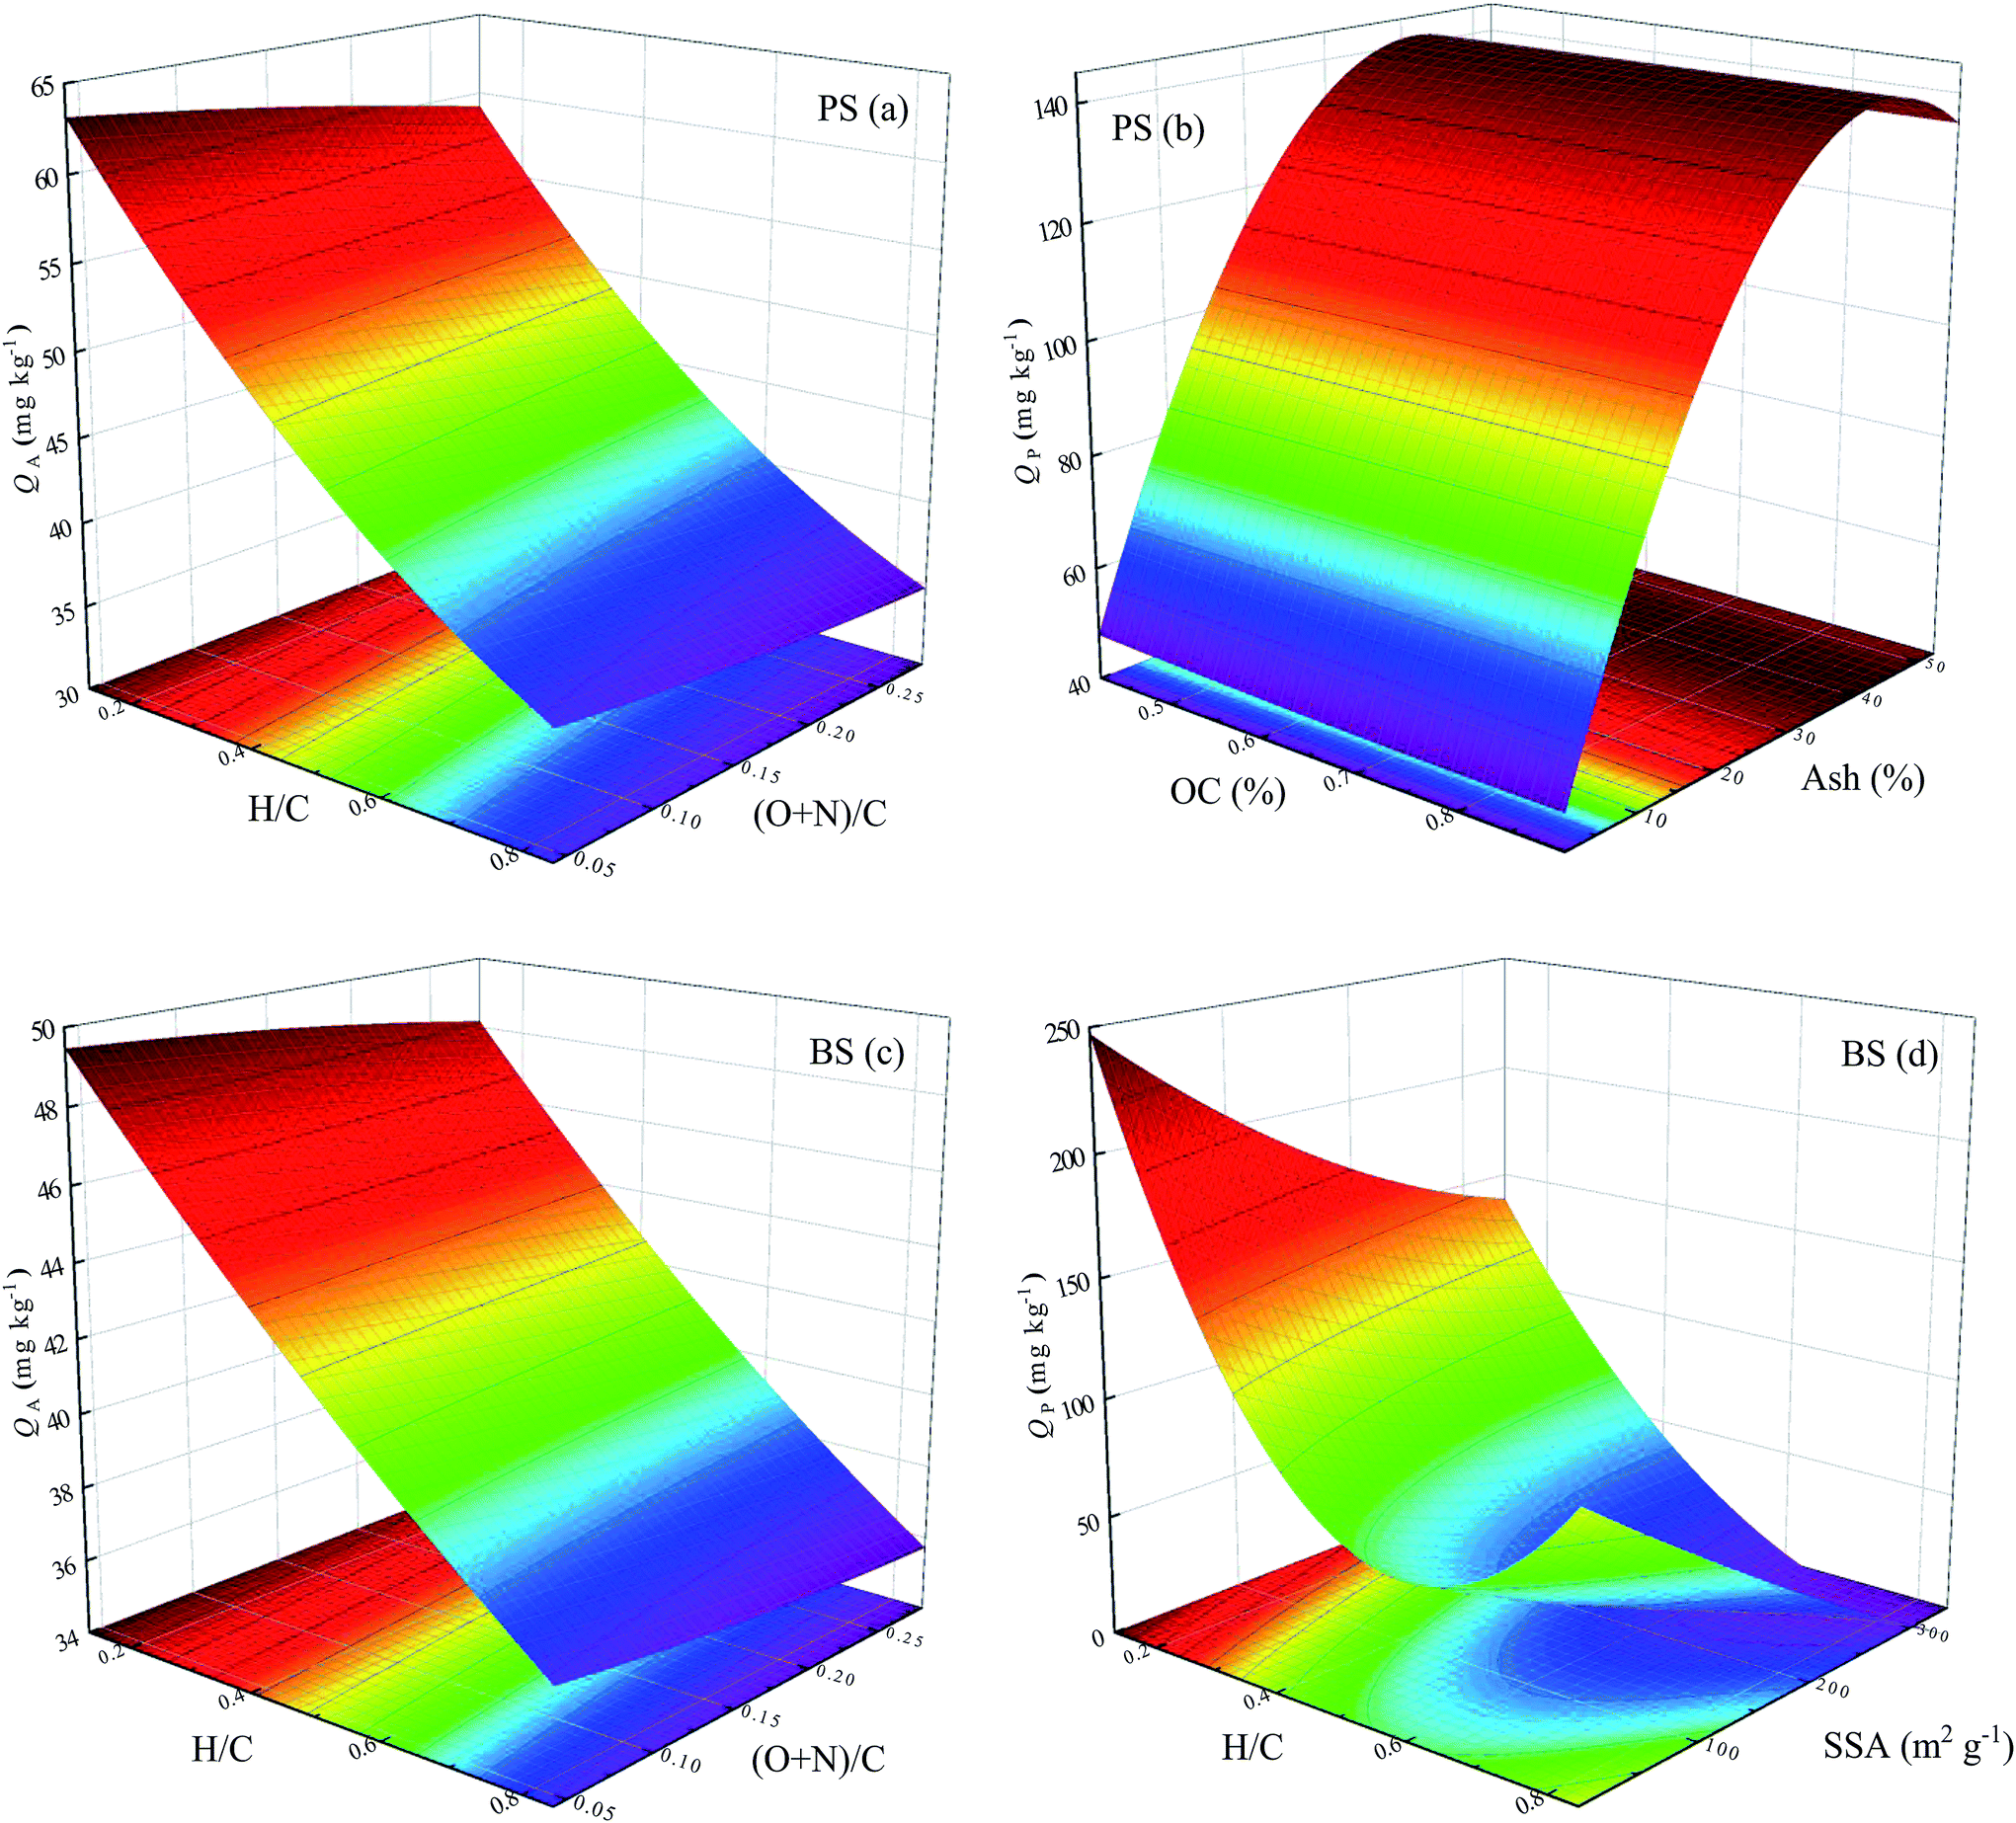 | ||
| Fig. 5 Three-dimensional surface plots of the interactive effects of studied biochar properties on the adsorption behavior of ATZ on biochar-amended soils. (a), (b), (c), and (d) represent the interactive effects of H/C and (O + N)/C ratios of biochar on the surface adsorption of ATZ onto biochar-amended PS, interactive effects of OC and ash contents of biochar on the partition adsorption of ATZ onto biochar-amended PS, interactive effects of H/C and (O + N)/C ratios of biochar on the surface adsorption of ATZ onto biochar-amended BS, and interactive effects of H/C ratio and SSA of biochar on the partition adsorption of ATZ onto biochar-amended BS, respectively. | ||
In addition, from Fig. 5a, it is obvious that the surface adsorption amount of ATZ on biochar-amended PS significantly decreased with the increase in the H/C ratio of biochar, but slightly decreased with the increase in the (O + N)/C ratio. Furthermore, the partition adsorption amount of ATZ on biochar-amended PS considerably increased with the increasing ash content of the biochar, but hardly changed with increasing OC content (Fig. 5b). This result indicated that high aromaticity of biochar facilitated the surface adsorption of ATZ on biochar-amended soil, while the high ash content of biochar was favorable toward partition adsorption. Similarly, the surface adsorption amount of ATZ on biochar-amended BS also exhibited a significant decrease with an increase in the H/C ratio of biochar (Fig. 5c), suggesting the positive effect of biochar aromaticity on the surface adsorption of ATZ on biochar-amended BS. On the contrary, the partition adsorption amount of ATZ on biochar-amended BS initially decreased and then slightly increased with the increasing H/C ratio of biochar, but slightly decreased with increasing SSA (Fig. 5d). This difference demonstrated that the effect of biochar aromaticity on the partition adsorption of biochar-amended BS had major significance. According to the above analysis, it seemed reasonable to assume that the adsorption behavior of ATZ on biochar-amended soil could be simultaneously influenced by multiple properties of the added biochars.
3.4 Evidence for biochar–soil interaction in affecting the adsorption of ATZ in biochar-amended soils
Although the adsorption of ATZ on biochar-amended soil depended on the combination of adsorption of soil and biochar, it has been widely acknowledged that the interaction between biochar and soil/soil constituents, referring to the adsorption of dissolved OC of soil by biochar, and adsorption of authigenic organic matter of biochar by soil minerals, and insertion and attachment of minerals on biochar surfaces, and electron transfer functionality of biochars after interacting with soil minerals, might induce changes in the adsorption capacity of organic compounds.38–40 To precisely examine whether and how the interaction would affect the adsorption of ATZ on biochar-amended soils, the real adsorption amounts of ATZ on PS and BS amended with 2% RC, 2% BC, and 2% MC were compared with the predicted adsorption amounts at Ce/Sw < 1, which were calculated based on the following equation:| Qpredict = fsoilKf,soilCen,soil + fbiocharKf,biocharCen,biochar | (6) |
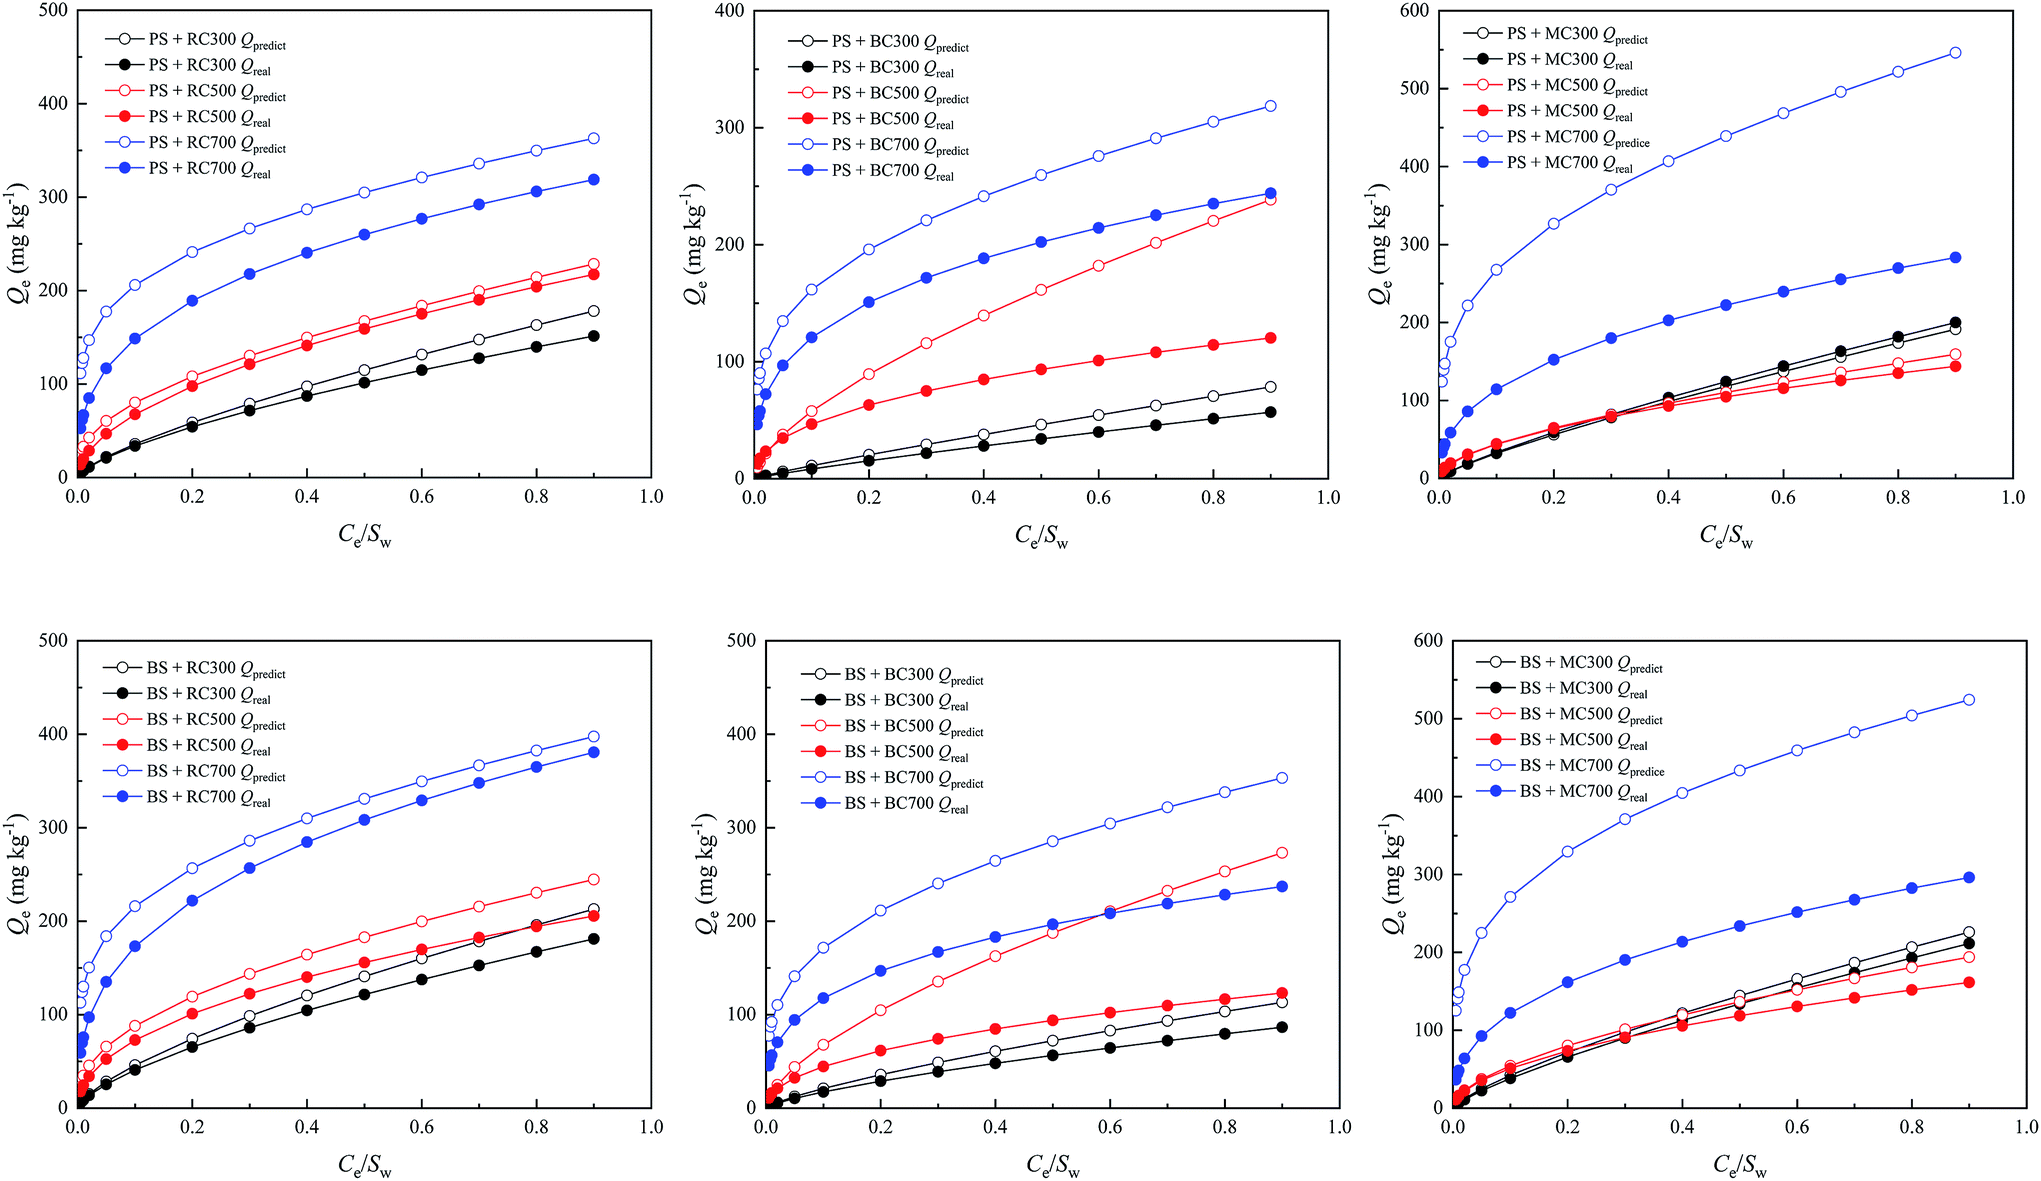 | ||
| Fig. 6 Comparison between the predicted adsorption amounts (Qpredict) and real adsorption amounts (Qreal) of ATZ on PS and BS amended with 2% RC, 2% BC, and 2% MC. | ||
Apparently, the real adsorption amounts of ATZ on biochar-amended soil were far lower than the predicted adsorption amounts; moreover, the attenuation effect was more obvious with the increase in the ATZ equilibrium concentration in an aqueous solution. This further proved that biochar would interact with the soil/soil components to influence the adsorption capacity of biochar-amended soil for ATZ. In particular, for the soil amended with high-temperature biochar (700 °C), the differences between the real and predicted adsorption amounts of ATZ on MC-amended soil were much greater than those on BC- and RC-amended soils, which indicated that the interaction of MC with soil exceeded those of RC and BC. This was because MC has higher ash content than BC and RC, which was detrimental toward adsorption due to the blocked and inaccessible organic adsorption sites in the original biochar.
Interestingly, the real adsorption amounts of ATZ on PS and BS amended with 2% RC300, 2% BC300, and 2% MC300 were more approximate to their predicted adsorption amounts, respectively, when compared with those of ATZ on PS and BS amended with 2% RC700, 2% BC700, and 2% MC700. It was based on traditional acceptance, which suggested that dissolved organic matter and native adsorbate in soils decreased the adsorption of ATZ on biochar by competing for or blocking the surface adsorption sites of biochar.13,39,41 However, new evidence has revealed the potential mechanism in which organic matter in biochar might compensate the role of soil organic matter in the competition for adsorption sites with a decrease in biochar pyrolysis temperatures, thereby narrowing the difference between the real and predicted adsorption amounts of ATZ. In addition to the effect of organic matter on ATZ adsorption, soil minerals, a major soil component, could prevent the exposure of carbon and oxygen by providing physical isolation and then suppress the formation of O-containing functional groups on the biochar surface, which was not favorable for the adsorption of ATZ.3,7
4. Conclusions
In this study, the adsorption of ATZ on BS and PS was considerably enhanced due to the amendment of different types of biochars; moreover, this enhancement was dependent on the pyrolysis temperature, addition ratio, and physicochemical properties of biochar. In addition, biochar-amended soils exhibited stronger nonlinearity adsorption when compared with original soils. The surface and partition adsorption amounts of ATZ on biochar-amended soil increased with the amendment of biochar. However, the degree of increase of the surface adsorption amount was much higher than that of the partition adsorption amount. The multiple nonlinear regression analysis, combined with the three-dimensional surface plots of the interactive effects of the studied biochar properties on the adsorption behavior of ATZ on biochar-amended soil indicated that the adsorption behavior of ATZ on biochar-amended soil could be simultaneously influenced by the amended multiple biochar properties. In addition, the interaction between the different biochar properties might affect the adsorption of ATZ in biochar-amended soil mixtures. The real adsorption amounts of ATZ on biochar-amended soils were far lower than the predicted adsorption amounts, suggesting the interaction between biochar and soil/soil components, including dissolved organic matter and soil minerals.Conflicts of interest
There are no conflicts to declare.Acknowledgements
This study was financially supported by the National Natural Science Foundation of China (21577124) and the National Key Research and Development Program of China (2017YFA0207002).References
- C. Peiris, S. R. Gunatilake, T. E. Mlsna, D. Mohan and M. Vithanage, Bioresour. Technol., 2017, 246, 150–159 CrossRef CAS PubMed.
- M. Safaei Khorram, Q. Zhang, D. L. Lin, Y. Zheng, H. Fang and Y. L. Yu, J. Environ. Sci., 2016, 44, 269–279 CrossRef PubMed.
- F. Yang, L. Zhao, B. Gao, X. X. Xu and X. D. Cao, Environ. Sci. Technol., 2016, 50, 2264–2271 CrossRef CAS PubMed.
- M. Kah, G. Sigmund, F. Xiao and T. Hofmann, Water Res., 2017, 124, 673–692 CrossRef CAS PubMed.
- D. Y. Xu, Y. Zhao, K. Sun, B. Gao, Z. Y. Wang, J. Jin, Z. Y. Zhang, S. F. Wang, Y. Yan, X. T. Liu and F. C. Wu, Chemosphere, 2014, 111, 320–326 CrossRef CAS PubMed.
- W. J. Liu, H. Jiang and H. Q. Yu, Chem. Rev., 2015, 115, 12251–12285 CrossRef CAS PubMed.
- K. Sun, M. J. Kang, Z. Y. Zhang, J. Jin, Z. Y. Wang, Z. Z. Pan, D. Y. Xu, F. C. Wu and B. S. Xing, Environ. Sci. Technol., 2013, 47, 11473–11481 CrossRef CAS PubMed.
- Y. Y. Zhou, X. C. Liu, Y. J. Xiang, P. Wang, J. C. Zhang, F. F. Zhang, J. H. Wei, L. Luo, M. Lei and L. Tang, Bioresour. Technol., 2017, 245, 266–273 CrossRef CAS PubMed.
- F. R. Oliveira, A. K. Patel, D. P. Jaisi, S. Adhikari, H. Lu and S. K. Khanal, Bioresour. Technol., 2017, 246, 110–122 CrossRef CAS PubMed.
- Y. Y. Zhou, Y. Z. He, Y. J. Xiang, S. J. Meng, X. C. Liu, J. F. Yu, J. Yang, J. C. Zhang, P. F. Qin and L. Luo, Sci. Total Environ., 2019, 646, 29–36 CrossRef CAS PubMed.
- M. Kah, G. Sigmund, P. L. Manga Chavez, L. Bielská and T. Hofmann, PeerJ, 2018, 6, e4996 CrossRef PubMed.
- J. Jin, M. J. Kang, K. Sun, Z. Z. Pan, F. C. Wu and B. S. Xing, Sci. Total Environ., 2016, 550, 504–513 CrossRef CAS PubMed.
- X. H. Ren, H. W. Sun, F. Wang, P. Zhang and H. K. Zhu, Environ. Pollut., 2018, 242, 1880–1886 CrossRef CAS PubMed.
- P. Zhang, H. W. Sun, L. J. Min and C. Ren, Environ. Pollut., 2018, 236, 158–167 CrossRef CAS PubMed.
- F. Lian and B. S. Xing, Environ. Sci. Technol., 2017, 51, 13517–13532 CrossRef CAS PubMed.
- K. B. Delwiche, J. Lehmann and M. T. Walter, Chemosphere, 2014, 95, 346–352 CrossRef CAS PubMed.
- A. Dechene, I. Rosendahl, V. Laabs and W. Amelung, Chemosphere, 2014, 109, 180–186 CrossRef CAS PubMed.
- Y. P. Qiu, M. W. Wu, J. Jiang, L. Li and G. Daniel Sheng, Chemosphere, 2013, 93, 69–74 CrossRef CAS.
- K. G. I. D. Kumari, P. Moldrup, M. Paradelo and L. W. de Jonge, Water, Air, Soil Pollut., 2014, 225, 2105 CrossRef.
- G. Cornelissen, Ö. Gustafsson, T. D. Bucheli, M. T. O. Jonker, A. A. Koelmans and P. C. M. van Noort, Environ. Sci. Technol., 2005, 39, 6881–6895 CrossRef CAS.
- B. L. Chen and M. X. Yuan, J. Soils Sediments, 2011, 11, 62–71 CrossRef CAS.
- M. S. Khorram, A. K. Sarmah and Y. Yu, Water, Air, Soil Pollut., 2018, 229, 60 CrossRef.
- F. Yang, W. Zhang, J. M. Li, S. Y. Wang, Y. Tao, Y. F. Wang and Y. Zhang, Chemosphere, 2017, 189, 507–516 CrossRef CAS PubMed.
- X. Y. Yu, G. G. Ying and R. S. Kookana, J. Agric. Food Chem., 2006, 54, 8545–8550 CrossRef CAS PubMed.
- P. Zhang, H. W. Sun, C. Ren, L. J. Min and H. M. Zhang, Environ. Pollut., 2018, 234, 812–820 CrossRef CAS PubMed.
- C. Anyika, Z. Abdul Majid, Z. Ibrahim, M. P. Zakaria and A. Yahya, Environ. Sci. Pollut. Res., 2015, 22, 3314–3341 CrossRef CAS.
- J. F. Li, J. S. Li, H. P. Dong, S. S. Yang, Y. M. Li and J. X. Zhong, J. Agric. Food Chem., 2015, 63, 5740–5746 CrossRef CAS PubMed.
- S. Y. Wei, M. B. Zhu, J. Z. Song and P. A. Peng, BioResources, 2017, 12, 3316–3330 CrossRef CAS.
- B. P. Koch and T. Dittmar, Rapid Commun. Mass Spectrom., 2006, 20, 926–932 CrossRef CAS.
- I. J. Schreiter, W. Schmidt and C. Schüth, Chemosphere, 2018, 203, 34–43 CrossRef CAS PubMed.
- A. Mandal, N. Singh and T. J. Purakayastha, Sci. Total Environ., 2017, 577, 376–385 CrossRef CAS PubMed.
- H. Deng, D. Feng, J. X. He, F. Z. Li, H. M. Yu and C. J. Ge, Ecol. Eng., 2017, 99, 381–390 CrossRef.
- J. Jin, K. Sun, Z. Y. Wang, L. F. Han, P. Du, X. K. Wang and B. S. Xing, Sci. Total Environ., 2017, 598, 789–796 CrossRef CAS.
- A. Zielińska and P. Oleszczuk, Environ. Sci. Pollut. Res., 2016, 23, 21822–21832 CrossRef.
- E. Rosales, J. Meijide, M. Pazos and M. A. Sanromán, Bioresour. Technol., 2017, 246, 176–192 CrossRef CAS PubMed.
- A. Accardi-Dey and P. M. Gschwend, Environ. Sci. Technol., 2003, 37, 99–106 CrossRef CAS.
- K. A. Spokas, W. C. Koskinen, J. M. Baker and D. C. Reicosky, Chemosphere, 2009, 77, 574–581 CrossRef CAS PubMed.
- J. Jin, K. Sun, W. Liu, S. W. Li, X. Q. Peng, Y. Yang, L. F. Han, Z. W. Du and X. K. Wang, Environ. Pollut., 2018, 236, 745–753 CrossRef CAS PubMed.
- X. H. Ren, X. J. Yuan and H. W. Sun, Environ. Sci. Pollut. Res., 2018, 25, 81–90 CrossRef CAS PubMed.
- Z. D. Zhao and W. J. Zhou, Environ. Pollut., 2019, 245, 208–217 CrossRef CAS PubMed.
- S. M. Martin, R. S. Kookana, L. Van Zwieten and E. Krull, J. Hazard. Mater., 2012, 231–232, 70–78 CrossRef CAS PubMed.
Footnote |
| † Electronic supplementary information (ESI) available. See DOI: 10.1039/c8ra08544g |
| This journal is © The Royal Society of Chemistry 2019 |