 Open Access Article
Manipulating thermal resistance at the solid–fluid interface through monolayer deposition
Mohammad Rashedul Hasana,
Truong Quoc Vo*b and
BoHung Kim *a
*a
aSchool of Mechanical Engineering, University of Ulsan, Daehak-ro 93, Namgu, Ulsan 680-749, South Korea. E-mail: bohungk@ulsan.ac.kr
bUniversity of Kaiserslautern, Laboratory of Engineering Thermodynamics, Erwin-Schrodinger-Str. 44, Kaiserslautern 67663, Germany. E-mail: truong.vo@mv.uni-kl.de
First published on 8th February 2019
Abstract
Heat transfer across an interface between a monolayer coated solid substrate and fluid has been extensively analyzed through a series of non-equilibrium molecular dynamics simulations. The effect of the monolayer was studied by varying its atomic mass (mM) and interaction energy between monolayer particles (εMM). Even though the fluid adsorption plays a role in heat transfer at the solid–fluid interface, we found that the interfacial thermal resistance (Kapitza resistance) is highly affected by the insertion of monolayer without any further change in the liquid structure near the solid surface. The Kapitza length monotonically increases with the increase of mM irrespective of εMM. The observations were explained by analysis of the overlap of the phonon spectrum at the interface using vibrational density of states. The effect of the monolayer on the Kapitza length was summarized by a fourth polynomial function that demonstrates the contribution of both mM and εMM with respect to each other on the Kapitza resistance within the parametric range studied.
1. Introduction
Thermal transport through an interface between two dissimilar materials is known to result in a temperature jump, ΔT. The ratio of this temperature jump to the rate of heat transfer (Q) determines the interfacial thermal resistance (Kapitza resistance; i.e., RK = ΔT/Q).1 Therefore, RK plays a key role in controlling heat dissipation at the interfaces. As with the concept of velocity slip length when fluid passes to solid surfaces,2 thermal resistance length (LK, known as the Kapitza length) can be defined by extrapolating the temperature profile from the fluid into the solid. Consequently, the Kapitza length is defined as the equivalent thickness of fluid at the solid–fluid interface, with the same temperature gradient of the respective fluid region, that causes equivalent thermal resistance on the interface.3 If the Fourier law (Q = −λ∇T) is valid with constant thermal conductivity λ, then the Kapitza length can be estimated as
 | (1) |
Recent developments in nanoscience and technology have attracted a vast number of investigations of mass, momentum, and energy transport in nanoscale structures and nanoconduits.4,5 Several methods have been used to manipulate the Kapitza resistance, such as changing the pressure of the nano-confined fluid,6,7 using different solid lattice orientations,8,9 changing the wall temperature,10,11 inserting metallic nanoparticles into the fluids (i.e., nanofluids),12,13 and nanoengineering the solid substrate.14–17 However, wall–fluid interaction energy, which solely determines the surface wettability,18–20 is the key factor affecting the Kapitza resistance. Increasing intermolecular interaction strength at the interface (i.e., enhancing the wetting degree) reduces the interfacial thermal resistance and vice versa.3,10,21–27 In case of nanoparticle–fluid interfaces, Tascini et al. also showed that large interfacial curvature (nanoparticle size) coupled with strong nanoparticle–fluid interaction strength provide optimum heat transport near the interfacial region.28 Moreover, in 2016, Ge et al. used time-domain thermoreflectance to measure the Kapitza length between water and various solids through the transport of thermally excited vibrational energy across the interfaces.29 It was reported that the Kapitza length at hydrophobic interfaces (10–12 nm) is a factor of 2–3 larger than the Kapitza length at hydrophilic interfaces (3–6 nm). Nevertheless, changing solid substrate material seems inapplicable, because every device has its own specific application and usage and operating conditions.
For such a case, using two-dimensional (2D) material coated on solid substrate has become a potential solution because one atom thick layers of almost any material are transparent to visible light; however, this can vary the energy transport at the interface. Since the discovery of graphene in 2004,30 it has become a cutting-edge material; that opens up a pandora's box for other 2D materials that might be beyond the limited current applicability of graphene. Recently, 2D materials have been attracting increasing attention due to the many interesting properties originating from bulk to monolayer transition.31,32 For instance, Rafiee et al. measured a 30–40% increase in condensation heat transfer as a result of the ability of graphene coating to suppress copper oxidation.33 The enhancement of condensation heat transfer performance with graphene coatings was also confirmed in the report of Preston et al.34 More recently, the results on Kapitza resistance revealed that the interfacial temperature jump increases with the introduction of graphene at the interface between solid and fluid water.35–37 Meanwhile, the dominant influence of monolayers WS2 and MoS2 on the wettability of the underlying substrates has also been investigated.38 It was shown that even when a monolayer WS2 (or MoS2) is coated, the measured contact angle highly increases compared to the substrate without coatings.
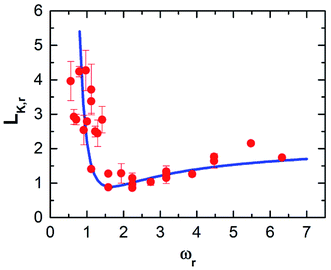
For the reasons given above, a systematic study on the effects of monolayer coating on the interfacial heat transfer is required. There have been several studies on thermal boundary resistance at the perfect interfaces between solids,39,40 and with the introduction of monolayer near the solid–solid interface.41,42 However, they lack an investigation on the variation of Kapitza length at solid–fluid interfaces with the presence of monolayer inserted under a wide range of its atomic properties. Note that substrate and monolayer particles are likely to vibrate back and forth in both horizontal and vertical directions about a fixed lattice point unlike the fluid particles, as the interatomic potential is comparatively weak for fluids. In that case, the mutual combination of atomic mass (mM) and interaction energy (εMM) of monolayer may lead to a significant influence in heat transport at the interfacial region. Therefore, in this paper, we aim to study the effects of the interfacial monolayer on Kapitza resistance between solid and fluid using molecular dynamics (MD) simulations by the variation of mM and εMM. Finally, LK under the effect of monolayer was compared as the function of mM and εMM. It is known that interaction energy (ε) and mass (m) are related to the thermal oscillation frequency, which is proportional to  22 Hence, in this paper, we attempt to correlate LK and
  Herein, ωr denotes the interfacial mismatch at the solid–fluid interface, where ωM and ωF represents the thermal oscillation frequency of monolayer and fluid particles respectively.
2. Theoretical background
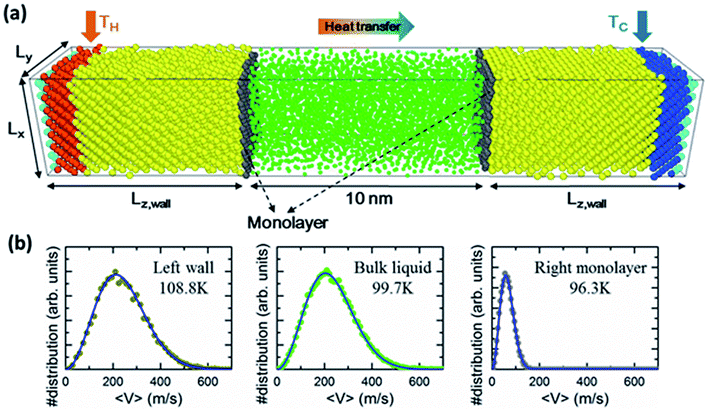
The solid wall atoms are initially constructed in perfect FCC structure with a computational domain of Lx = 8a, Ly = 8a and Lz = 15a across each respective direction, where the lattice constant a = 0.5256 nm (see Fig. 1). Fluid particles were confined between two solid walls with and without monolayer coating. The number density (ρ = Nσ3/V) of fluid was set to 0.8 at a distance of 10 nm along the z-direction. For simulations where the interfacial monolayers (colored gray) are presented, the innermost solid layers, (i.e. the ones facing the fluid argon), are replaced by the monolayer. We limit the monolayer to the non-lattice-mismatch to the lattice structure of the solid walls, but with a different atomic mass and interaction energy depending on the cases studied.To perform the non-equilibrium MD (NEMD) simulations of heat transport through the z-direction of the systems, the outermost layers of both sides of the simulation domains (colored cyan) were fixed to their original positions to maintain a constant volume. Thermostats were situated at four consecutive layers (colored orange and blue) next to the outmost layers. Meanwhile, the remaining solid and fluid atoms were free to move without thermostats applied when heat transfer occurs. The temperature of the left wall was kept higher than the right to generate thermal energy fluxes from left to right. Periodic conditions were applied in the x- and y-directions.
In this study, we used the truncated (12–6) Lennard-Jones (LJ) potential to model the interactions between atoms as follows
 | (2) |
| Interaction | ε | σ | m |
|---|---|---|---|
| a εFF = 0.0103 eV. σFF = 0.3405 nm. mF = 39.948 gram per mol. | |||
| Fluid–fluid (F–F) | εFF | σFF | mF |
| Wall–wall (W–W) | 9εFF | σFF | mF |
| Monolayer–monolayer (M–M) | [5–20]εFF | σFF | [0.5–16]mF |
| M–W |  |
(σMM + σWW)/2 | |
| W–F | 0.2εFF | σFF | |
| M–F | 0.2εFF | σFF | |
The heat flux Q in the fluid is calculated by using the Irving–Kirkwood (I–K) expression as follows:44,45
 | (3) |
Once the heat flux is calculated, the thermal conductivity of fluid argon can be obtained from the Fourier law. Also, we compute the vibrational density of states (VDOS) of atoms at the interface using the Fourier transform of its velocity auto-correlation function (VACF) as:
 | (4) |
 . According to condensed matter physics, the VDOS of a system characterized by the number of states per interval of energy at each energy level that is available to be occupied by phonons.
Simulations start with an NVT (i.e., constant number of atoms, constant volume, and constant temperature) ensemble applied to the entire system. In this stage, the Maxwell–Boltzmann velocity distribution is used for the initial velocities of all atoms, while the Nose–Hoover thermal thermostat maintains system temperature at 100 K. Subsequently, the hot and cold reservoirs are respectively subjected to 110 K and 90 K using Langevin thermostats NVE (i.e., constant number of atoms, constant volume, and constant energy). The simulation time step is set to 1.0 fs. The simulations are performed for 12 ns: the first 3 ns to allow the systems to reach equilibrium, the next 3 ns to ensure the systems to gain a steady state in the presence of heat flux, and the last 6 ns for averaging. All simulations in this study are carried out using LAMMPS.46
Before we present the temperature distributions and discuss the effects of the monolayer, we must demonstrate the local thermal equilibrium (LTE) in the system. It is known that the local temperature can be defined only if the LTE is established. In this paper, the temperature distributions are obtained using slab bins parallel to the walls. For instance, slab bins 0.2628 nm and 0.4 nm in thickness are used to observe the local temperatures in solid walls and fluids, respectively. Fig. 1b shows the distribution of velocity components of atoms contained in one bin at different positions (i.e., in the mean position of the left solid wall, in the mean position of the fluid region, and at the mean position of the monolayer particles in the colder side when mM = 12mF and εMM = 10εFF). The results reveal that atomic velocity components satisfy the Maxwell–Boltzmann distribution very well; thus, the LTE is established.
3. Results and discussion
3.1 Effect of monolayer on interfacial heat transfer
To provide a general picture of the effect of monolayer coating on heat transfer at solid–fluid interfaces, we show in Fig. 2 the temperature distributions along the z-direction of channels without and with monolayer. From Fig. 2b–d, we keep the interaction energy of monolayer at εMM = 10εFF, while gradually increasing its mass. In order to determine the interfacial temperature jumps, we extrapolate the linear temperature from the fluid region to the solid surfaces, which are described by the black arrows. Throughout our analysis, surface positions are defined at the mean position of the solid surface adjacent to the fluid. When the monolayer is coated, the surface positions are then at the mean position of the monolayers. We also observe additional temperature jumps between the solid substrate and monolayer interfaces, indicating the impact of solid–solid interactions of nanocomposite structure into the overall thermal resistance at solid–fluid interface. For such a case, the temperature jumps need to be defined considering both interface (i.e., monolayer–fluid) and near-interface (wall–monolayer) temperature discontinuity. Therefore, we extrapolate the linear temperature from the wall substrate across the monolayer. The results shown in Fig. 2 demonstrate the effects of monolayer as seen in the variation in temperature jump and temperature gradient within the fluid region compared to the substrate–fluid case. In addition, there is a slight discrepancy in temperature jumps at the hot and cold sides; however, no tendency is observed. Therefore, in the following, Kapitza length is shown as an average of the two walls.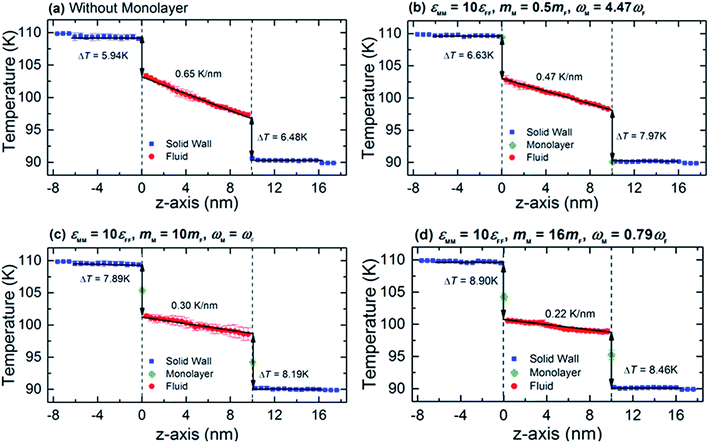 | ||
| Fig. 2 Typical temperature profiles across the wall–fluid interface (a) without and (b–d) with monolayer coated for εMM = 10εFF at various values of mM. | ||
Fig. 3 shows the thermal conductivity (λ) measured in the confined fluid. The average thermal conductivity of the bulk fluid Argon at 100 K is in agreement with other MD studies3,11,47 (where the relative deviation of λ is 0.9% to 7.66%), as well as in experiments48,49 (where the relative deviation of λ is 3.2% to 4.63%). The results from Fig. 3 reveal that the thermal resistance on the interface solely depends on the interfacial characteristics, and the thermal conductivity of the fluid is independent of the thermal resistance at the interface. In this study, the effect of monolayer is studied by the variation of its atomic mass (mM) and particle–particle interaction energy (εMM). Therefore, it is interesting to know the contribution of mM and εMM to the interfacial heat transfer.
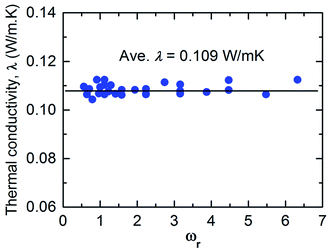 | ||
| Fig. 3 Dependence of thermal oscillation frequency between monolayer and fluid on thermal conductivity (black line represents the value for λ without monolayer coating). | ||
3.2 Role of monolayer mass and interaction energy
 Therefore, we plot the variation of Kapitza length versus monolayer mass (c.f. Fig. 4a) and monolayer interaction energy (c.f. Fig. 4b). Here, after reaching the minimum, LK,r increases monotonically with the increase of the monolayer mass independent of its interaction energy. In addition, the monolayer surface for different εMM doesn't show any significant effect on LK,r. Hence it would seem to be the monolayer-mass that plays a dominant role in the interfacial thermal resistance, as demonstrated also in Fig. 2.
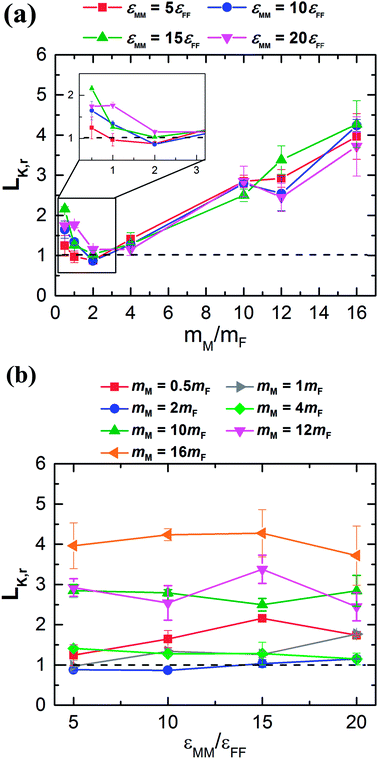 | ||
| Fig. 4 Variation of LK,r as a function of (a) mM at different εMM/εFF and (b) εMM/εFF at different mM. | ||
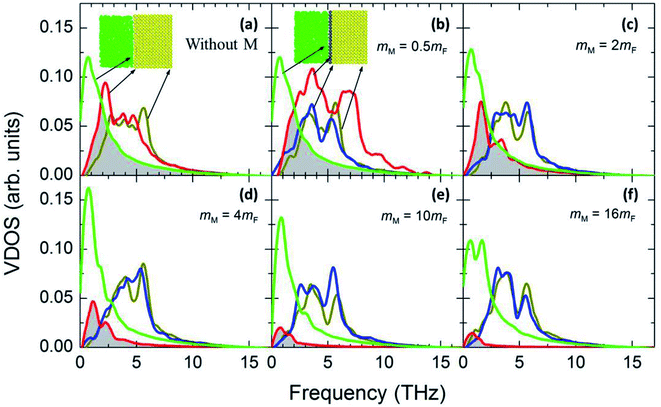
Note that the vibrating period of monolayer particles continuously gets longer with subsequent increase of mM regardless of any lower value for εMM. Thus, the monolayer surface continuously becomes very rough. However, the amplitude of the respective particles weakly depends on atomic mass for a high stiff surface (increased interaction energy between surface particles) that is largely controlled by the wall's temperature.50–52 Primarily, LK,r is found to be smaller for lighter monolayer particles than heavier particles for all the cases of εMM (see Fig. 4a). Starting from mM = 0.5mF, LK,r likely to decrease mainly due to the reduced vibrational mismatch between the absorbed fluid and the solid surface at the interfacial region. Consequently, a reduced LK,r is observed for a delicate amount of mass at mM = 2mF, which marginally varies for different εMM around the dashed line. This line represents the result of Kapitza length at the solid–fluid interface without monolayer coating. Afterward the interfacial region experienced a greater vibrational mismatch between the respective materials, and eventually, the LK,r becomes critical for heavy monolayer particles (i.e., mM > 2mF). These results indicate that the thermal vibration of monolayer surface, which is light in weight, similarly correlated with the wall and fluid particles as the vibrating period is considerably very short. In contrary, heavier monolayer molecules further hinder the heat transport due to the increased elastic properties as well as long vibrating period at the substrate–monolayer and monolayer–fluid region in spite of any alteration of εMM. However, it is still unclear what factor mainly contributes to the LK,r for different values of εMM.
In Fig. 4b, the LK,r fluctuates around an average value along each respective mass curve; therefore, variation in εMM contributes a minor part to further change in the LK,r. For the case of mM = 2mF, LK,r is slightly under the dashed line when εMM = 5εFF, that has gone up to more than unity when εMM = 20εFF. Such an observation also has been found for almost the entire remaining strong monolayer surface (εMM = 15εFF or 20εFF). This indicates that εMM has an indirect but important effect at the interface when the substrate is coated with monolayer. In 2011, Liang and Tsai studied the effect of single atom thick film confined between two dissimilar solids.41 They also found that the interfacial thermal resistance slightly increases with the increase of film–solid binding strength.
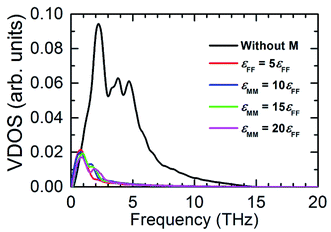
Fig. 7 illustrates the possible scenario of the VDOS with the variation of εMM for mM = 10mF. Here the black line represents the innermost solid layer, and the colored lines represent the monolayer particles. Apparently, there is no obvious change in the phonon states of the monolayer with the increase of εMM, and the difference in peaks between the innermost solid layer and monolayer is considerably large. This indicates that εMM has no such control over the thermal energy transport at the interfacial region for the heavy monolayer particles. Liang and Tsai also studied the VDOS of a thin film between two different solid materials.41 They found better vibrational coupling at the solid–film–solid interface with the increase of film–solid binding strength. Since the solid particles oscillate about a fixed lattice point unlike fluids; therefore, increased inelastic or strong solid surface was likely to have a good agreement in the vibrations with the thin film near the interface.
 | (5) |
4. Conclusions
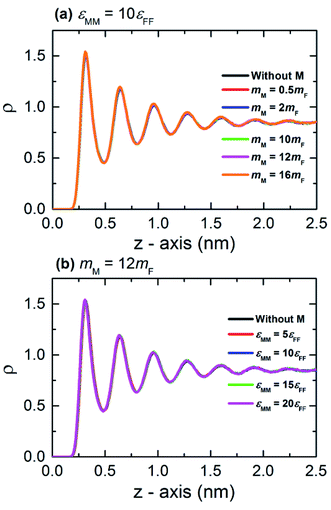
The role of monolayer particles mass (mM) and interaction energy (εMM) on Kapitza length between the monolayer coated solid surface and fluid argon has been extensively analyzed through non-equilibrium molecular dynamics simulation. Within this monoatomic nano-composite structure, thermal conductivity of fluid showed a constant value at 100 K using Fourier's law. The fluid density structure near the solid surface is also independent of any change in mM and εMM. This indicates that heat transport at the interfacial region solely depends on the monolayer properties. Considering the mutual combination of mM and εMM, we also observed that the temperature jump increases with decreasing ωr, suggesting a greater interfacial mismatch between the particles with a lower oscillation frequency.Primarily, our results indicate that mM is the dominant factor for controlling the amount of heat transport at the interface as the Kapitza length monotonically increases with increasing mM, regardless of εMM. Because the vibrational mismatch of atoms continuously increases with the subsequent addition of mass, the measured LK,r was expectedly much higher for heavier monolayer particles than lighter monolayer particles for a given value of εMM. This is because the interaction energy between heavier monolayer particles has no control over the interfacial thermal resistance which results in a greater vibrational mismatch between the materials near the interface. On the other hand, for lighter monolayer particles, the interaction energy of monolayers is likely to maintain a better vibrational coupling with the solid substrate. Therefore, even if the vibrational mismatch marginally increases with the increase of mM, εMM minimizes that mismatch which eventually leads to a reduced Kapitza resistance at the interfacial region.
Further improvement of interfacial thermal transport is possible when the nano-composite materials remain mismatched in the lattice structure. Hence, further examinations of the lattice mismatch monolayer surface with the existing monatomic crystal structure will be a part of our future research.
Conflicts of interest
There are no conflicts to declare.Acknowledgements
This work was supported by the 2018 Research Fund of University of Ulsan.References
- P. L. Kapitza, J. Phys., 1941, 4, 181 Search PubMed.
- P. A. Thompson and S. M. Troian, Nature, 1997, 389, 360–362 CrossRef CAS.
- B. H. Kim, A. Beskok and T. Cagin, J. Chem. Phys., 2008, 129, 174701 CrossRef PubMed.
- G. E. Karniadakis, A. Beskok and N. Aluru, Microflows and Nanoflows: Fundamentals and Simulation, Springer-Verlag, New York, 2005 Search PubMed.
- D. G. Cahill, P. V. Braun, G. Chen, D. R. Clarke, S. Fan, K. E. Goodson, P. Keblinski, W. P. King, G. D. Mahan, A. Majumdar, H. J. Maris, S. R. Phillpot, E. Pop and L. Shi, Appl. Phys. Rev., 2014, 1, 011305 Search PubMed.
- H. Han, S. Mérabia and F. Müller-Plathe, J. Phys. Chem. Lett., 2017, 8, 1946–1951 CrossRef CAS PubMed.
- A. Pham, M. Barisik and B. Kim, J. Chem. Phys., 2013, 139, 244702 CrossRef PubMed.
- T. Ohara and D. Torii, J. Chem. Phys., 2005, 122, 214717 CrossRef PubMed.
- A. R. bin Saleman, H. K. Chilukoti, G. Kikugawa, M. Shibahara and T. Ohara, Int. J. Heat Mass Transfer, 2017, 105, 168–179 CrossRef CAS.
- M. Barisik and A. Beskok, Int. J. Therm. Sci., 2014, 77, 47–54 CrossRef CAS.
- Z. Shi, M. Barisik and A. Beskok, Int. J. Therm. Sci., 2012, 59, 29–37 CrossRef CAS.
- H. Han, S. Merabia and F. Müller-Plathe, Nanoscale, 2017, 9, 8314–8320 RSC.
- P. Keblinski, S. R. Phillpot, S. U. S. Choi and J. A. Eastman, Int. J. Heat Mass Transfer, 2002, 45, 855–863 CrossRef CAS.
- H. Hu and Y. Sun, J. Appl. Phys., 2012, 112, 053508 CrossRef.
- Y. Wang and P. Keblinski, Appl. Phys. Lett., 2011, 99, 073112 CrossRef.
- K. M. Issa and A. A. Mohamad, Phys. Rev. E: Stat., Nonlinear, Soft Matter Phys., 2012, 85, 031602 CrossRef CAS PubMed.
- T. Q. Vo and B. Kim, J. Chem. Phys., 2018, 148, 034703 CrossRef PubMed.
- T. Q. Vo, M. Barisik and B. Kim, Phys. Rev. E: Stat., Nonlinear, Soft Matter Phys., 2015, 92, 053009 CrossRef PubMed.
- S. Becker, H. M. Urbassek, M. Horsch and H. Hasse, Langmuir, 2014, 30, 13606–13614 CrossRef CAS PubMed.
- M. Barisik and A. Beskok, Mol. Simul., 2013, 39, 700–709 CrossRef CAS.
- T. Q. Vo and B. Kim, Int. J. Precis. Eng. Manuf., 2015, 16, 1341–1346 CrossRef.
- B. Kim, Chem. Phys. Lett., 2012, 554, 77–81 CrossRef CAS.
- J.-L. Barrat and F. Chiaruttini, Mol. Phys., 2003, 101, 1605–1610 CrossRef CAS.
- J. Ghorbanian and A. Beskok, Phys. Chem. Chem. Phys., 2017, 19, 10317–10325 RSC.
- J. Ghorbanian, A. T. Celebi and A. Beskok, J. Chem. Phys., 2016, 145, 184109 CrossRef PubMed.
- T. Q. Vo, B. Park, C. Park and B. Kim, J. Mech. Sci. Technol., 2015, 29, 1681–1688 CrossRef.
- B. H. Kim, A. Beskok and T. Cagin, Microfluid. Nanofluid., 2010, 9, 31–40 CrossRef CAS.
- A. S. Tascini, J. Armstrong, E. Chiavazzo, M. Fasano, P. Asinari and F. Bresme, Phys. Chem. Chem. Phys., 2017, 19, 3244–3253 RSC.
- Z. Ge, D. G. Cahill and P. V. Braun, Phys. Rev. Lett., 2006, 96, 186101 CrossRef PubMed.
- K. S. Novoselov, A. K. Geim, S. V. Morozov, D. Jiang, Y. Zhang, S. V. Dubonos, I. V. Grigorieva and A. A. Firsov, Science, 2004, 306, 666–669 CrossRef CAS PubMed.
- R. Mas-Ballesté, C. Gómez-Navarro, J. Gómez-Herrero and F. Zamora, Nanoscale, 2011, 3, 20–30 RSC.
- D. Akinwande, C. J. Brennan, J. S. Bunch, P. Egberts, J. R. Felts, H. Gao, R. Huang, J.-S. Kim, T. Li, Y. Li, K. M. Liechti, N. Lu, H. S. Park, E. J. Reed, P. Wang, B. I. Yakobson, T. Zhang, Y.-W. Zhang, Y. Zhou and Y. Zhu, Extreme Mech. Lett., 2017, 13, 42–77 CrossRef.
- J. Rafiee, X. Mi, H. Gullapalli, A. V. Thomas, F. Yavari, Y. Shi, P. M. Ajayan and N. A. Koratkar, Nat. Mater., 2012, 11, 217–222 CrossRef CAS.
- D. J. Preston, D. L. Mafra, N. Miljkovic, J. Kong and E. N. Wang, Nano Lett., 2015, 15, 2902–2909 CrossRef CAS PubMed.
- B. Ramos-Alvarado, S. Kumar and G. P. Peterson, J. Phys. Chem. Lett., 2016, 7, 3497–3501 CrossRef CAS.
- A. T. Pham, M. Barisik and B. Kim, Int. J. Heat Mass Transfer, 2016, 97, 422–431 CrossRef CAS.
- T. Q. Vo and B. Kim, Sci. Rep., 2016, 6, 33881 CrossRef CAS PubMed.
- P. K. Chow, E. Singh, B. C. Viana, J. Gao, J. Luo, J. Li, Z. Lin, A. L. Elías, Y. Shi, Z. Wang, M. Terrones and N. Koratkar, ACS Nano, 2015, 9, 3023–3031 CrossRef CAS PubMed.
- R. J. Stevens, L. V. Zhigilei and P. M. Norris, Int. J. Heat Mass Transfer, 2007, 50, 3977–3989 CrossRef.
- S. Merabia and K. Termentzidis, Phys. Rev. B: Condens. Matter Mater. Phys., 2012, 86, 094303 CrossRef.
- Z. Liang and H.-L. Tsai, J. Phys.: Condens. Matter, 2011, 23, 495303 CrossRef.
- Z. Liang and H.-L. Tsai, Int. J. Heat Mass Transfer, 2012, 55, 2999–3007 CrossRef.
- M. P. Allen and D. J. Tildesley, Computer Simulation of Liquids, Oxford University Press, 2nd edn, 2017 Search PubMed.
- J. H. Irving and J. G. Kirkwood, J. Chem. Phys., 1950, 18, 817–829 CrossRef CAS.
- B. D. Todd, P. J. Daivis and D. J. Evans, Phys. Rev. E: Stat. Phys., Plasmas, Fluids, Relat. Interdiscip. Top., 1995, 51, 4362–4368 CrossRef CAS.
- S. Plimpton, J. Comput. Phys., 1995, 117, 1–19 CrossRef CAS.
- A. J. H. McGaughey and M. Kaviany, Int. J. Heat Mass Transfer, 2004, 47, 1783–1798 CrossRef CAS.
- B. J. Bailey and K. Kellner, Physica, 1968, 39, 444–462 CrossRef CAS.
- H. Ziebland and J. T. A. Burton, Br. J. Appl. Phys., 1958, 9, 52 CrossRef CAS.
- B. H. Kim, A. Beskok and T. Cagin, Microfluid. Nanofluid., 2008, 5, 551–559 CrossRef.
- N. Asproulis and D. Drikakis, Phys. Rev. E: Stat., Nonlinear, Soft Matter Phys., 2011, 84, 031504 CrossRef PubMed.
- N. Asproulis and D. Drikakis, Phys. Rev. E: Stat., Nonlinear, Soft Matter Phys., 2010, 81, 061503 CrossRef PubMed.
- L. Xue, P. Keblinski, S. R. Phillpot, S. U.-S. Choi and J. A. Eastman, Int. J. Heat Mass Transfer, 2004, 47, 4277–4284 CrossRef.
- A. T. Pham, M. Barisik and B. Kim, Int. J. Precis. Eng. Manuf., 2014, 15, 323–329 CrossRef.
- M. Frank, M. Kio, D. Drikakis, L. Könözsy and N. Asproulis, J. Comput. Theor. Nanosci., 2018, 15, 141–146 CrossRef CAS.
- E. T. Swartz and R. O. Pohl, Rev. Mod. Phys., 1989, 61, 605–668 CrossRef.
| This journal is © The Royal Society of Chemistry 2019 |

