 Open Access Article
Synthesis, characterization and activity performance of nickel-loaded spent FCC catalyst for pine gum hydrogenation
Xiaopeng Chen*a,
Lu Rena,
Muhammad Yaseenab,
Linlin Wang a,
Jiezhen Lianga,
Ruixue Lianga,
Xiankun Chena and
Huiqing Guoa
aGuangxi Key Laboratory of Petrochemical Resources Processing and Process Intensification Technology, School of Chemistry and Chemical Engineering, Guangxi University, Nanning 53004, PR China. E-mail: lilm@gxu.edu.cn; Fax: +86-771-323-3718; Tel: +86-771-3272702
bInstitute of Chemical Sciences, University of Peshawar, Peshawar, 25120, KP, Pakistan
First published on 25th February 2019
Abstract
A Ni-based catalyst supported over a spent fluid catalytic cracking (FCC) catalyst was prepared by a wet impregnation method. The catalytic characteristic was investigated in pine gum hydrogenation. Optimum conditions for catalyst preparation were obtained as: 15% Ni loading, 723 K calcination temperature, and 723 K reduction temperature for 2.5 h. The characterization results indicate that the specific surface area of the spent catalyst increased from 65.70 m2 g−1 to 67.78 m2 g−1 after calcination. The H2-TPR profile of the spent FCC catalyst exhibited two reduction peaks at 1123 °C and 670 °C. The TG curves showed that the second and third steps occur at 440 K and 550 K, respectively, having a total weight loss of 16%. The NiO grains possess rhombus particles on the surface or between the layers of the supported NiO catalyst. After activation in H2 flow, the metallic Ni loads on the support with no covalent bond between them. The NH3-TPD results indicated that the spent FCC catalyst held an obvious distribution of weakly acidic sites, and the acid sites became stronger after loading the catalyst with Ni. The hydrogenation products of pine gum were identified by GC-MS and a reaction mechanism was proposed. This study demonstrated its cost-effectiveness, environment-friendly nature and that the utilization of a spent FCC catalyst can be effectively applied as an alternative approach to pine gum hydrogenation on an industrial level.
1. Introduction
Pine gum is one of the biggest biomass oil resources in the world. Because of the suitable climate, pine gum has spread all over China, particularly in the Sichuan, Yunnan, Guizhou, Guangxi, Fujian, Anhui and Jiangxi provinces.1 Rosin and turpentine oil can be obtained from pine gum by distillation. The main component of rosin is abietic acid that contains a conjugated double bond, which upon oxidation deepens its color and brittleness, increases the hydroxyl contents and ultimately enhances its polarity. Thus, it causes the reduction in its solubility in gasoline or petroleum ether and decreases its use in plastics and ink industry.Hydrogenated rosin is used in many industries,2 such as adhesives,3–10 coatings,11 printing ink,12 corrosion prevention,13 chewing gum14,15 and medicine,16 due to its good oxidation resistance, light color, low brittleness and high thermal stability.
In general, hydrogenated rosin is produced by melting rosin between 220–270 °C in a pressure range of 10–25 MPa using noble metal (Pd/C) as the catalyst.17,18 Some major drawbacks of this process are the rigorous conditions, high catalyst costs, and a large-scale equipment investment. Similarly, the high temperature operation inevitably results in a series of side reactions of dehydrogenation and decarboxylation, which can decrease the performance of rosin products. The other method of producing hydrogenated rosin is the solution method of mixing rosin and no. 200 industrial grade solvent oil together.19 This method improves the condition of the reaction in a temperatures range of 120–150 °C and mild pressures of 4–5 MPa.20 This method was developed as pine gum hydrogenation and finally the no. 200 industrial grade solvent oil was replaced by turpentine oil. Because turpentine oil originally comes from pine gum, its mass transfer gets promoted, which results in the color and luster of the product.
A Pd/C catalyst has been ubiquitously used for the catalytic hydrogenation of rosin.21,22 A major question of this process is the uncontrolled process cost due to Pd utilization. Thus, developing a base metal catalyst, which is cost-effective, without sacrificing the activity is becoming more critical.
Fluid catalytic cracking (FCC) is a central technology in the secondary manufacturing of crude oil23 and the amount of catalyst used in this process is more than 90 kt a−1.24 Owing to carbonaceous deposits formed over FCC catalysts during operation, the acid sites of catalysts are reduced and the mass transfer in the channels of zeolites is hampered, which can considerably decrease catalytic activity.25 The analysis of the state of coke deposits on spent FCC catalysts shows that there are two different types of coke i.e. soluble and insoluble.25,26 The former includes aromatics with 2–3 rings adsorbed on the external surface and PAHs with 2–7 rings adsorbed inside the pore, while the latter is confirmed as an amorphous structure, and may consist of a disordered arrangement of polyaromatic molecules. Bibby et al.27 and Behera et al.28 presented the formation, nature and properties of coke, and studied the techniques for analyzing and characterizing coke. The FCC catalysts literally go to waste as they are poisoned by the adsorption of heavy metal ions such as V, Ni and Sn in the rework process. According to the reported literature, almost 100% of the metal contaminants in feed is decomposed and deposited on the FCC catalyst surface causing its deactivation.29,30 Discarding these spent catalysts has not only led to an economic loss but also resulted in the air, underground water and solids pollution.
In order to address these issues, many studies have focused on making full use of the spent FCC catalyst. Wang et al.31 investigated the conversion of pinenes to pinane over nickel supported over a spent FCC catalyst, with a total pinenes conversion of 98.48% and a cis–trans ratio of 13.89. Lu32 introduced a novel method of using spent FCC catalysts or additives to upgrade n-butene into more useful propylene, iso-butene, iso-butane and even gasoline. Commingled polymer waste and polyolefin waste were converted into chemicals and valuable hydrocarbons, respectively, over spent FCC commercial catalysts.33,34 Some studies evaluated “used” FCC catalysts for the recycling of polymer wastes,35,36 while removal of metallic ions using spent FCC catalysts have also been reported.37,38 To the best of our knowledge, no work has been reported on the reuse of these poisonous ions, such as, Ni, V and Fe supported over FCC spent catalysts for the hydrogenation of pine gum.
In this study, we report on metal ions (Ni, Fe, and V) deposited on the surface of a spent FCC catalyst in the hydrogenation reaction of pine gum. This work makes full use of the poisoning Ni ions and the molecular sieve structure of spent FCC catalysts to prepare load-type non-noble metal catalysts by a wet impregnation method followed by hydrogen reduction and applied in the catalytic hydrogenation of pine gum, demonstrating high activity and selectivity. The hydrogenation rosin product exhibits high quality properties (1.9 wt% abietic acid, acid value 164.2 mg g−1, and Lovibond color number, red 0.7, yellow 4.0). The as-prepared catalysts were characterized using scanning electron microscopy (SEM), Brunauer–Emmett–Teller (BET), X-ray diffraction (XRD), Fourier transform infra-red spectroscopy (FT-IR), hydrogen programmed temperature reduction (H2-TPR), nitrogen programmed temperature desorption (N2-TPD), and thermogravimetric differential thermal analysis (TG-DTA). The reaction products were analyzed using gas chromatography mass spectrometry (GC-MS) based on which a proper reaction mechanism was proposed. This study provides a new and environment-friendly route for the regeneration and application of spent FCC catalysts with a highly cost-effective nature and enhanced catalytic activity and selectivity for pine gum hydrogenation on an industrial level.
2. Materials and methods
2.1. Materials
The spent FCC catalyst was purchased from Guangxi Tiandong Oil Refinery. Ni(NO3)2·6H2O (over 98 wt%) was purchased from Chengdu Kelong Chemical Co. China. Pine gum was purchased from Guangxi Wuzhou Pine Chemical Co., Ltd., China. The pine gum contains palustric acid (54.5 wt%), dehydroabietic acid (4.4 wt%), abietic acid (10.4 wt%) and neoabietic acid (15.0 wt%).2.2. Catalyst preparation
The catalysts were prepared for support by a wet impregnation method reported previously.39,40 The calcined spent FCC catalyst was impregnated with a desired amount of Ni(NO3)2·6H2O solution. After being dried at 120 °C, the precursors were maintained at 523–923 K for 3 h to control the decomposition of nitrate. Then, the precursors were reduced for 2.5 h at 523–923 K under a hydrogen flow in an automatic-temperature-controlled tube furnace reactor, which was connected with N2 and H2 piping.2.3. Catalyst characterization
The morphology of the catalyst was analyzed in a JEOL JM-6400 SU8020 scanning electronic microscope (SEM), using an acceleration voltage of 7 kV. FTIR spectra of the samples were recorded using a spectrophotometer (NICOLET 6700, wavelength 400–4000 cm−1) at room temperature. Powder X-ray diffraction (XRD) was performed in a Rigaku analytical diffractometer model D/MAX-UItima IV with a Cu–K anode, at 40 kV and 200 mA, while scanning the sample over a Bragg angle (2 h) of 5° to 70°. The specific surface area (BET), total pore volume and average pore diameter were measured by N2 adsorption at 77 K in a Builder SSA-4300 Surface Area and Pore Size Analyzer (with outgassing of the samples at 523 K during 2.5 h). Thermal stabilities of the samples were obtained by using a thermogravimetric analyzer (NETZSCH STA 409 PC/PG TG-DT) at a scanning rate of 10 °C min−1 in a temperature range of 25–1073 °C in N2 atmosphere. Hydrogen temperature-programmed reduction (H2-TPR) was performed on a FINESORB 3010C 243 adsorption system. The NH3 temperature programmed desorption (NH3-TPD) experiments were performed on a TP-5079 TPDRO instrument equipped with a TCD detector.2.4. Catalytic activity tests and product analysis
Hydrogenation reactions were performed in an agitated 2 L stainless steel batch reactor (Dalian Tongchan Autoclave Vessel Manufacturing Co., Ltd., China), whose design temperature was 623 K and design pressure 20 MPa. 470 g pine gum and 300 g turpentine oil were mixed together and heated in a water bath, followed by filtration. The reactor was charged with this filtrate, a specific amount of catalyst and then sealed, and the reaction temperature was 453 K. The air was pumped out of the reactor to an absolute pressure of about 0.003 MPa, followed by charging with N2 to a pressure at 0.5 MPa and holding for 10 min. Then, the N2 was pumped out, and the system was re-filled with N2 to a pressure of 0.1 MPa. This replacement procedure was repeated twice. Subsequently, the reactor was filled with H2 to a pressure of 0.5 MPa and was heated to the desired reaction temperature with continuous stirring at 100 rpm. When the required reaction temperature was attained, the stirring rate was increased to 500 rpm and the CO2 pressure was filled to 4.0 MPa. On reaction completion, i.e. 1 h, the reactor was cooled to room temperature.The reaction species in the samples were methylated with 25% aqueous tetramethylammonium hydroxide (TMAH) solution (ASTM Standard D 5974-00) and quantitatively analyzed by gas chromatography (GC) (GC-7820, Agilent), while qualitative analyses were performed using GC-MS (QP5050A, Shimadzu). The gas chromatograph equipped with a fused silica capillary column was coated with DB-5 (30 m × 0.25 mm i.d. × 0.25 m film thickness, J&W Scientific, USA) and a flame ionization detector (FID) using a temperature programmed GC as follows:
The temperature of the gas chamber was 250 °C and N2 was used as the carrier gas with a flow rate of 25 mL min−1.
3. Results and discussion
3.1. Catalyst characterization
Surface particle structure and morphology characterization was performed using SEM and the scans are depicted in Fig. 1. It can be seen from Fig. 1(a) that the spent FCC catalyst had serious agglomeration and the blocked pores present were due to the accumulation of carbon and the deposition of heavy metal, which caused the inactivation of the catalyst. Fig. 1(b) shows that the calcined spent FCC catalyst had less agglomeration with cleaner and bigger pore structures to some extent. This can also be found by the BET data in Table 1 that the surface area of the spent FCC catalyst is smaller than that of the calcined version, though with a minimal increase attributed to structure collapse.41,42 Many rhombus particles i.e. NiO grains, on the surface or between the layers of the supported NiO catalyst can be seen (Fig. 1(c)). As shown in Fig. 1(d), the grain size decreases after hydrogen reduction with the Ni grains possessing a smaller size than NiO.43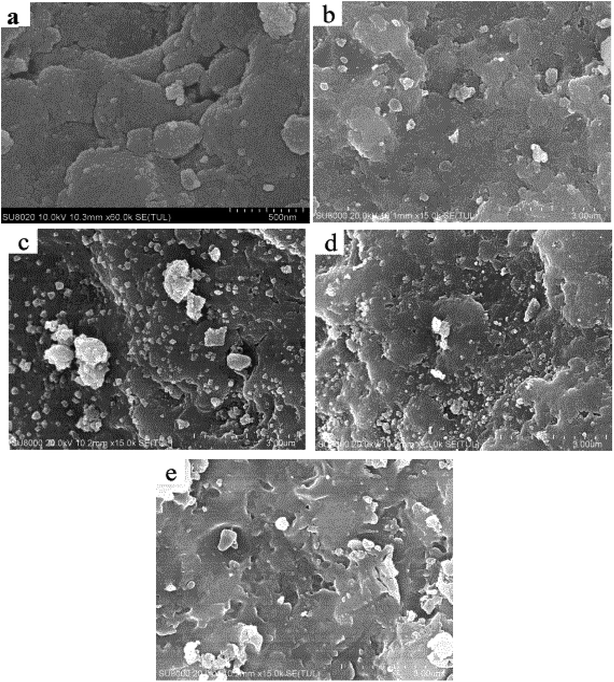 | ||
| Fig. 1 SEM images of (a) spent FCC catalyst, (b) calcined spent FCC catalyst, (c) supported NiO catalyst, (d) supported nickel catalyst and (e) used Ni loaded catalyst. | ||
| FCC catalyst sample | BET surface area (m2 g−1) | Pore volume (cm3 g−1) | Pore size (nm) |
|---|---|---|---|
| New | 170.8 | 0.076 | 3.097 |
| Spent | 65.70 | 0.112 | 7.091 |
| Calcined spent | 67.78 | 0.123 | 7.453 |
| Supported Ni | 56.84 | 0.095 | 7.078 |
Supposing that the Ni grain entered into the pore on the catalyst surface, the surface area, the pore volume and pore size of the supported Ni catalyst decreased compared with the nascent calcined spent FCC catalyst (Table 1). However, it has no effect on the reaction rate because the rate determining step is considered to be the reaction between atomic hydrogen and the adsorbed components in pine gum on Ni active sites.21 Fig. 1(e) further reveals that the catalyst recycled from the hydrogenation of pine gum still had Ni particles visible on the surface and hence possessed enough catalytic activity.
The microstructure of the catalyst sample was examined using XRD and the pattern in Fig. 2 suggests that the newly synthesized FCC catalyst exhibited Y type molecular sieve structure.44 The XRD peaks of the spent FCC catalyst were widened and weakened compared with the fresh catalyst because of the collapsing molecular sieve structure during the reaction procedure. This is consistent with the SEM results discussed above. It can be seen that the sample (d) exhibited three peaks at 2θ of 37.16°, 43.26° and 62.88°, which could be ascribed respectively to the (101), (012) and (110) reflections of NiO with a face-centered cubic structure.45 The supported Ni catalyst exhibited two obvious, sharp diffraction peaks (2θ = 44.559° and 51.879°) corresponding to the (111) and (200) planes of the face-centered cubic structure of Ni, confirming its successful incorporation onto the support after hydrogen reduction. Further, it was deduced that the metallic Ni was reduced sufficiently, with no further oxidation after storing in open air before the characterization. The catalytic activity of the already used catalyst (in the hydrogenation reaction) can be explained by comparing their XRD patterns with other supported Ni-based catalysts where both exhibited identical XRD peaks suggesting the presence of active Ni species.
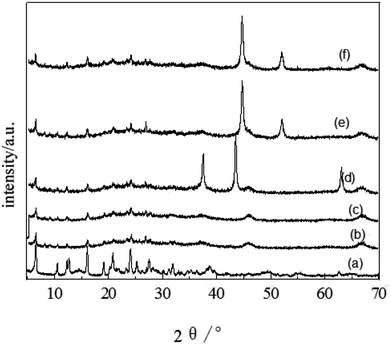 | ||
| Fig. 2 XRD patterns of (a) fresh FCC catalyst, (b) spent FCC catalyst, (c) calcined spent FCC catalyst, (d) supported NiO catalyst, (e) supported Ni catalyst and (f) used Ni loaded catalyst. | ||
FT-IR spectra of the catalytic samples are shown in Fig. 3. A strong band at 3470 cm−1 is related to the H–O–H stretching vibration, while the band at 1646 cm−1 is assigned to the H–O–H bending vibration.46 Samples 3–5 all exhibited two wide absorption bands nearby 3470 cm−1 and 1646 cm−1, which were assigned to the association of H–O–H. The absorptions near 1078 cm−1 and 455 cm−1 were assigned to the asymmetric stretching vibration and bending vibration of Si–O, respectively.47 The absorption band for the Si–H (stretching) mode was observed around 2350 cm−1. The Ni catalyst derived from precursor (nickel nitrate) had no absorption at 985 cm−1 for Si–O(H)–Ni,48 suggesting the absence of a covalent bond between the metal and support. Sample 5 had an absorption feature near 3000–2800 cm−1 assigned to the stretching vibration of C–H, which demonstrates the association of used catalyst with the product molecules.
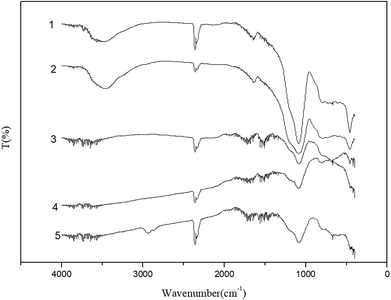 | ||
| Fig. 3 IR spectra of (1) spent FCC catalyst, (2) calcined spent FCC catalyst, (3) supported NiO catalyst, (4) supported Ni catalyst and (5) used Ni loaded catalyst. | ||
The H2-TPR profiles of the fresh and spent catalysts are depicted in Fig. 4(a), while Fig. 4(b) shows the fitting profile of the spent FCC catalyst. From the profiles, it can be observed that the spent FCC catalyst expressed one high temperature strong reduction peak at 1123 °C and one weak reduction peak at 670 °C, which indicates the presence of some metal oxide on the spent FCC catalyst that can be reduced. These two peaks can be assigned to the reduction of NiAl2O4 (or V oxide) and NiO, which is confirmed by the XRD results mentioned above. The comparison of the curve 3, 1 and 2 shows the main peaks of the latter moved to lower reduction temperatures, which is attributed to the adsorption of metal ion (or poison) over the catalyst surface in the FCC process (Fig. 5). Another factor that could lead to the decrease in reduction temperature of NiO is the presence of La2O3.49 In addition, shoulder peaks were detected around 780 K on curve 1 and curve 2, while curve 3 has two shoulder peaks at 673 K and 780 K, respectively. The peak at 780 K is attributed to the reduction of NiO in close contact with the support. All these data show that the fresh FCC catalyst had a strong interaction with NiO, which improved the dispersion of Ni and hindered the catalyst sintering and agglomeration. It can be seen from Fig. 4 that the optimum reduction temperature was about 673 K, which is in good agreement with the results reported in Fig. 8(b).
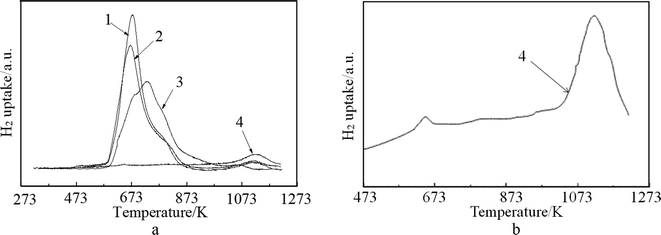 | ||
| Fig. 4 TPR profiles of (1) NiO/spent FCC catalyst, (2) NiO/calcined spent FCC catalyst; (3) NiO/fresh FCC catalyst; (4) spent FCC catalyst. | ||
The TG curve presented in Fig. 6 shows a three-step weight loss pattern for the precursors of the catalyst (Fig. 6(a) and (b)) and inactivated catalyst (Fig. 6(c)). The first step below 440 K is assigned to the weight loss of the physisorbed and interlayer water.50,51 It can be seen from the first two figures that the second and the third steps occurred at 440 K and 550 K, respectively, showing a total weight loss of 16%, which is consistent with the theoretical value of 18.8% caused by the decomposition of Ni(NO3)2. The positions of these steps coincided well with those of the endothermic peaks observed in the DTA patterns. As shown in Fig. 6(a), the weight loss curve does not level out until 900 K as compared with Fig. 6(b) which levels out at 673 K. The inflexions around 567 K on the TG curves of the samples correspond to the decomposition of groups and rupture of molecular bonds. Apparently, the third step on the Ni/fresh FCC catalyst curve is longer than on the Ni/spent FCC catalyst, resulting from different interactions between Ni and the support molecules. It can also be observed from H2-TPR (Fig. 4) that there was a stronger interaction between Ni ions and the fresh FCC catalyst support compared with spent FCC catalyst. Fig. 6(d) shows a weak weight-gain peak at 666 K, corresponding to the DTA pattern, because Ni ions on the inactivated catalyst had already been oxidized in the air. On average, the TG pattern exhibited a 4% weight loss because of the coke deposition in the catalytic reaction.
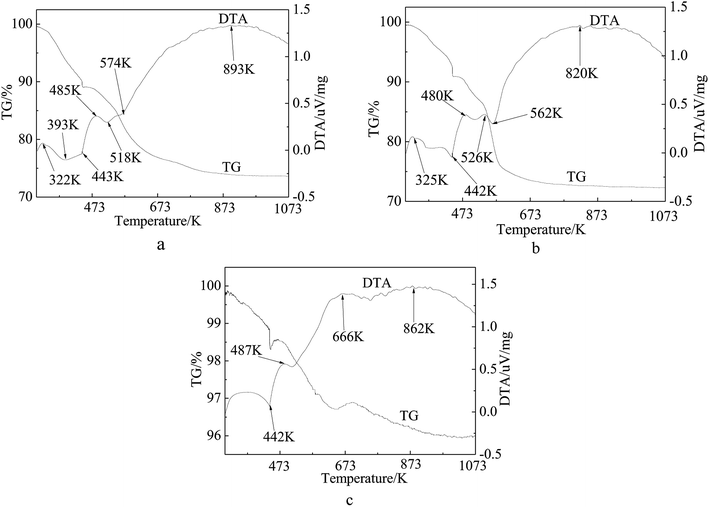 | ||
| Fig. 6 TG-DTA curves of supported Ni catalysts and deactivated catalyst. (a) 15 wt% Ni loaded fresh FCC catalyst by one step (b) 15 wt% Ni loaded spent FCC catalyst (c) inactive catalyst. | ||
The NH3-TPD measurement was performed to evaluate the strength and number of acidic sites on the samples. In Fig. 7, peaks below 573 K represent weak acidic sites, those between 573 K to 723 K correspond to medium strength, while those above 550 K correspond to strong acidic sites. From Fig. 7, it is clear that the fresh FCC catalyst shows broad desorption in the range of 273–1073 K, and there exist three kinds of acidic sites on the fresh FCC catalyst (weak acid sites at 363 K and 446 K and strong acid sites around 787 K). In case of the Ni-loaded fresh FCC catalyst, all the desorption peaks move to higher temperatures, suggesting stronger acidic sites are caused by the interaction between Ni ions and the support. These strong acidic sites in the case of spent FCC catalyst obviously disappeared, and the curve exhibits a decrease in the weak acid amount with the desorption peak moved to higher temperatures, which is concomitantly ascribed to a collapsed catalyst structure and metal deposition via FCC process. After calcination, the spent FCC catalyst showed a slight decrease in weak acid amount and almost did not change in acid site strength. Otherwise, it detected a weak desorption peak ranging from 633 K to 673 K on the calcined spent FCC catalyst, implying a few weak acid sites were recovered after removal of the coke deposits with calcination. When the spent FCC catalyst was loaded with NiO, the strong acid site was detected concurrently with the weak desorption peak moving to lower temperatures.
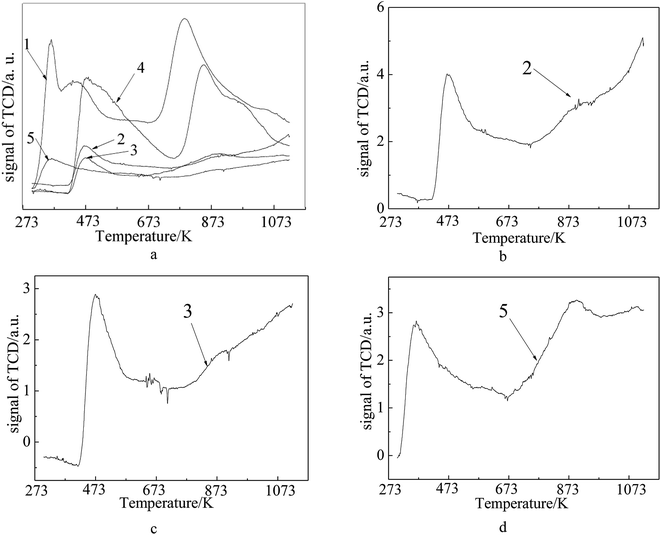 | ||
| Fig. 7 NH3-TPD profiles of (1) fresh FCC catalyst, (2) spent FCC catalyst, (3) calcined spent FCC catalyst, (4) NiO/fresh FCC catalyst, (5) NiO/spent FCC catalyst. | ||
3.2. Catalytic activity evaluation
The pine gum hydrogenation reaction was used to evaluate the catalytic activity at a temperature of 453 K, 4 MPa pressure, 500 rpm stirring speed, 1 h reaction time, using a catalyst dose of 5%. As there was a mixture of reactants, the conversion and selectivity are obtained by the follow equations
 | (1) |
 | (2) |
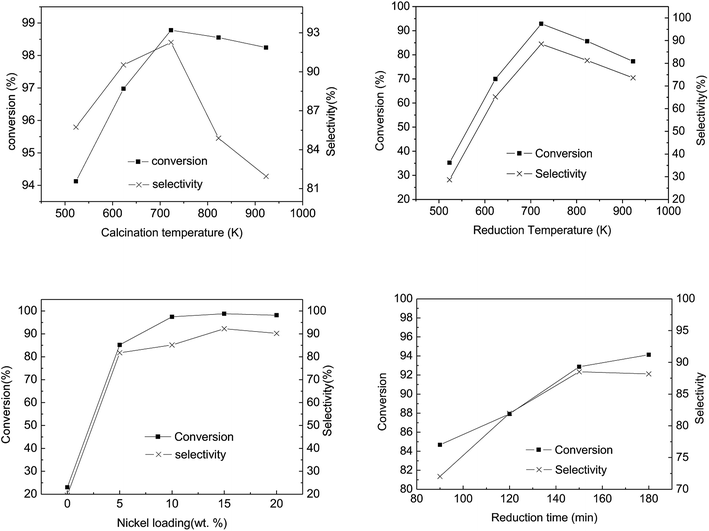
Fig. 8(a) illustrates the influence of calcination temperature on the conversion and selectivity of the abietic acid over the as-prepared catalysts. It can be seen that the maximum conversion and selectivity occurred at 723 K, while a further rise in temperature led to a decrease in both of these properties. The hydrogenation activity of the catalysts decreased at a calcination temperature below 573 K, which may be attributed to the fact that Ni(NO)3 cannot be decomposed completely at such a low temperature, while the reverse happened above 723 K (Fig. 8). At 723 K, the conversion and selectivity achieved 98.8% and 92.3%, higher than that reported by Wang18 with a 95% conversion and 80% selectivity, respectively. The hydrogenation activity gradually decreased with increasing catalyst calcination temperature, which may be due to the formation of agglomerates of NiO grains.52
The catalytic activity as a function of reduction temperature, as shown in Fig. 8(b), shows a marked relation between the two parameters. In Fig. 8(b), as the reduction temperature elevated from 523 K to 923 K, the conversion and the selectivity of the abietic type acid increased from 30% to 90%. It is worth noting that the supported Ni catalyst (prepared via an impregnation method) resulted in a nickel-aluminum spinel structure, which required a higher reduction temperature compared to other methods53 It is worth mentioning that a further increase in reduction temperature can lead to a gradual increase in Ni particle size, resulting in the lowering of specific surface area with an ultimately lower Ni particle dispersion.
Fig. 8(c) illustrates the influence of Ni loading on catalytic activity. The untreated spent FCC catalyst (without Ni loading) in pine gum hydrogenation exhibited 20% conversion of abietic type acid and selectivity of the desired products, which increased to 85% after 5% Ni loading. The conversion and selectivity remained in a range of 80–100% with further loadings, while the maximum was attained at 15% Ni loadings.
As the reduction proceeded, Ni active sites were generated and the catalyst's abietic acid hydrogenation activity increased (Fig. 8(d)). Apparently, the range of conversion and the selectivity narrowed with increasing reduction time, whereas at a reduction time > 150 min, the selectivity declined slowly. This may be attributed to the fact that the particle size grew larger with increasing reduction time, leading to agglomerate formation.
3.3. Reaction mechanism
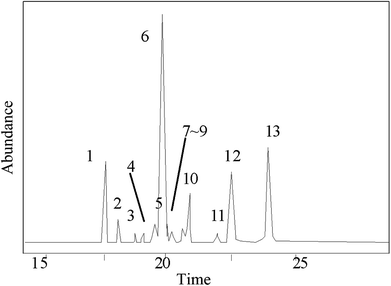
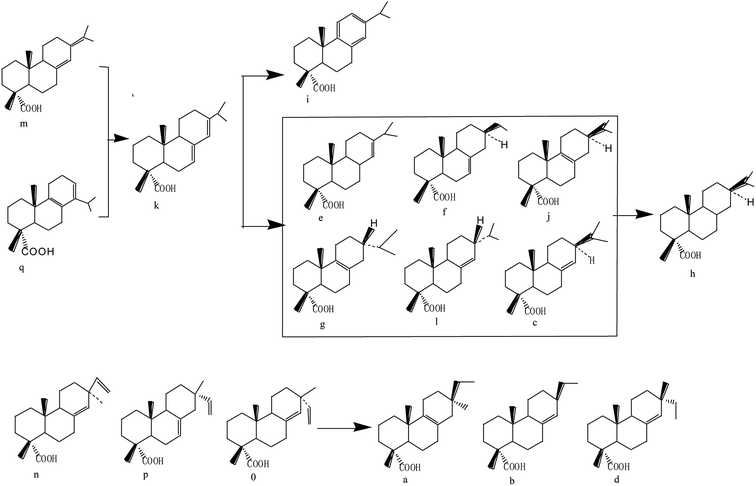
The GC-MS results of pine gum are shown in Fig. 9 and Table 2, which shows that there were 13 components in the reaction mixture among which 12 were identified.| No. | Retention time (min) | Compound | Molecular formula | Molecular weight (g mol−1) | Similarity degree (%) | Relative content wt% | No. in Fig. 11 |
|---|---|---|---|---|---|---|---|
| 1 | 17.694 | Pimaric acid | C20H30O2 | 302 | 89 | 7.78 | n |
| 2 | 18.098 | Sandaracopimaric![[thin space (1/6-em)]](https://www.rsc.org/images/entities/char_2009.gif) acid acid |
C20H30O2 | 302 | 95 | 0.97 | o |
| 3 | 18.601 | 8(14)-Pimarenoic acid | C20H30O2 | 302 | 96 | 0.53 | b |
| 4 | 18.903 | Pimaric acid decarboxylation products | C20H32 | 272 | 96 | 0.72 | — |
| 5 | 19.246 | Isopimaric acid | C20H30O2 | 302 | 88 | 0.91 | p |
| 6 | 19.913 | Palustric acid | C20H30O2 | 302 | 96 | 54.01 | q |
| 7 | 20.029 | 13-Abietenoic acid | C20H32O2 | 304 | 90 | 3.62 | e |
| 8 | 20.232 | 13β-7-Abietenoic acid | C20H32O2 | 304 | 98 | 1.67 | f |
| 9 | 20.488 | 8α-13β-Abietanoic acid | C20H32O2 | 304 | 95 | 0.60 | h |
| 10 | 20.607 | Dehydroabietic acid | C20H28O2 | 300 | 96 | 3.02 | i |
| 11 | 21.988 | Juniper acid | C20H30O2 | 304 | 96 | 0.31 | — |
| 12 | 22.114 | Abietic acid | C20H30O2 | 302 | 95 | 10.85 | k |
| 13 | 24.255 | Neoabietic acid | C20H30O2 | 302 | 93 | 15.01 | m |
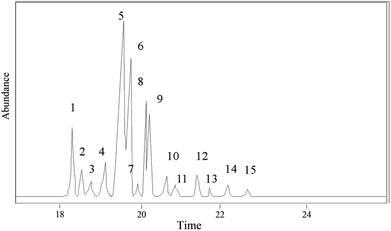
The hydrogenation products of pine gum after 1 h reaction were analyzed and identified by GC-MS. In total 14 components were identified, which are shown in Fig. 10 and Table 3.
| No. | Retention time (min) | Compound | Molecular formula | Molecular weight (g mol−1) | Similarity degree (%) | Relative content (wt%) | No. in Fig. 11 |
|---|---|---|---|---|---|---|---|
| 1 | 18.42 | 8-Pimarenoic acid | C20H32O2 | 304 | 90 | 2.96 | a |
| 2 | 18.58 | 8(14)-Pimarenoic acid | C20H32O2 | 304 | 96 | 1.79 | b |
| 3 | 18.88 | 13β-8(14)-Abietenoic acid | C20H32O2 | 304 | 92 | 0.93 | c |
| 4 | 19.27 | 8(14)-Isopimarenoic acid | C20H32O2 | 304 | 96 | 5.84 | d |
| 5 | 19.66 | 13-Abietenoic acid | C20H32O2 | 304 | 90 | 41.12 | e |
| 6 | 19.8 | 13β-7-Abietenoic acid | C20H32O2 | 304 | 98 | 18.64 | f |
| 7 | 19.91 | 8-Abietenoic acid | C20H32O2 | 304 | 95 | 1.27 | g |
| 8 | 20.16 | 8α-13β-Abietanoic acid | C20H34O2 | 306 | 95 | 13.89 | h |
| 9 | 20.21 | Dehydroabietic acid | C20H28O2 | 300 | 96 | 8.06 | i |
| 10 | 20.67 | 13β-8-Abietenoic acid | C20H32O2 | 304 | 90 | 0.49 | j |
| 11 | 20.77 | Juniper acid | C20H30O2 | 304 | 96 | 0.30 | — |
| 12 | 21.46 | Abietic acid | C20H30O2 | 302 | 95 | 1.20 | k |
| 13 | 21.73 | Unknown | — | — | — | 0.63 | — |
| 14 | 22.23 | 8(14)-Abietenoic acid | C20H32O2 | 304 | 92 | 2.53 | l |
| 15 | 22.73 | Neoabietic acid | C20H30O2 | 302 | 93 | 0.34 | m |
According to the GC-MS results and in light of some previous reports,54,55 the proposed reaction mechanism is shown in Fig. 11. Palustric acid and neoabietic acid are converted into abietic acid because of thermal isomerization. Then, 6 isomers of the dihydroabietic acid and tetrahydroabietic acid are obtained by hydrogenation reaction of abietic acid. Comparing dehydroabietic acid in Table 2 with Table 3, it was found that the quantity of dehydroabietic acid increased from 3.02 wt% to 8.06 wt%, which demonstrated that the hydrogenation reaction was accompanied by a dehydrogenation reaction. Pimaric acid, isopimaric acid and sandaracopimaric acid are hydrogenated on the side chain, while cyclic olefinic bond isomerism occurred instead of hydrogenation attributed to steric hindrance.
4. Conclusions
In this study, the pine gum hydrogenation reaction was used to evaluate the catalytic activity of a Ni-loaded spent FCC catalyst at a temperature of 453 K, 4 MPa pressure, stirring rate of 500 rpm, 1 h reaction time, and catalyst dose of 5% as optimum conditions for maximum conversion. A Ni loading of 15%, reduced at 723 K for 2.5 h, exhibited the maximum catalytic activity. BET and SEM results show that the spent FCC catalyst possessed a layered structure, while the porosity and surface area were improved by calcination. XRD and IR analysis indicated the absence of any covalent bonds between the metal and support. H2-TPR and TG results indicated that the fresh FCC catalyst had strong interaction with NiO, which improved the dispersion of Ni and hindered catalyst sintering. H2-TPD profiles indicated that the strength of acid sites increased because of interaction between the Ni ions and support. GC-MS results of pine gum and hydrogenation products indicated there were 13 components in the reaction mixture, while 14 components were identified in the hydrogenation products. Based on GC-MS results, a proper reaction mechanism was proposed. The present study, based on the utilization of spent FCC catalyst, is assumed to be highly cost-effective and environment-friendly and can be applied on an industrial level for the hydrogenation of pine gum, leading to the production of useful chemicals.Conflicts of interest
There are no conflicts of interest to declare.Acknowledgements
The authors gratefully acknowledge the financial support for this research from the National Natural Science Foundation of China (Grant No. 21566002, 21878056 and 31560241) and the Key Laboratory of Petrochemical Resource Processing and Process Intensification Technology (Grant No. 2016Z002).References
- D. Xi, L. Hua, P. Liu, Z. Hua, Q. Wen, C. Gu and H. Yuan, Comparative analysis of resin resource in rosin producing areas in china, J. Southwest For. Univ., 2010, 30(1), 73–79 Search PubMed.
- D. F. Zinkel and J. Russell, Naval stores: production, chemistry, utilization, Pulp Chemicals Association, New York, 1989 Search PubMed.
- I. M. Klein, US Pat. 3,232,895, 1961-05-26.
- S. Tsuchida, Y. Kodama and H. Hara, US Pat. 4,618,640, 1983-07-27.
- Y. K. S. Tsuchida and H. Hara, US Pat. 3,222,419, 1962-07-05.
- I. J. Balinth, US Pat. 4,147,831, 1977-08-31.
- H. S. Do, J. H. Park and H. J. Kim, Synthesis and characteristics of photoactive-hydrogenated rosin epoxy methacrylate for pressure sensitive adhesives, J. Appl. Polym. Sci., 2009, 111(3), 1172–1176 CrossRef CAS.
- A. Matsumura, S. Shigematsu and T. Itou, US Pat. 4,981,939, 1986-11-17.
- P. Guo, M. Danish, P. Du, Z. Kong and R. Guan, Viscoelastic and adhesive properties of polystyrene-hydrogenated (3,4-polyisoprene and 1,4-polyisoprene)-polystyrene and polymethyl methacrylate-polybutyl acrylate-polymethyl methacrylate-based HMPSA, J. Adhes. Sci. Technol., 2014, 28(5), 417–433 CrossRef CAS.
- M. Takemoto, M. Kajiyama, H. Mizumachi, A. Takemura and H. Ono, Miscibility and adhesive properties of ethylene vinyl acetate copolymer (EVA)-based hot-melt adhesives. I. Adhesive tensile strength, J. Appl. Polym. Sci., 2002, 83(4), 719–725 CrossRef CAS.
- M. Gillard, F. M. Cattiaux, M. Vos and J. Prinsen, EP Pat. 2,399,963, 2010-04-20.
- A. Matsumura, T. Itou, T. Kusuda and S. Shigematsu, US Pat. 4,968,575, 1987-07-23.
- E. A. Brled, US Pat. 2,510,063, 1948-07-20.
- E. R. Koch, L. P. Abbazia and W. J. Puglia, US Pat. 4,187,320, 1978-05-01.
- S. DeTora and R. P. D'amelia, US Pat. 4,459,311, 1983-01-03.
- H. Wang, T. T. H. Nguyen, S. Li, T. Liang, Y. Zhang and J. Li, Quantitative structure–activity relationship of antifungal activity of rosin derivatives, Bioorg. Med. Chem. Lett., 2015, 25(2), 347–354 CrossRef CAS PubMed.
- A. L. Glasebrook, US Pat. 2,776,276, 1953-08-18.
- L. Wang, X. Chen, W. Sun, J. Liang, X. Xu and Z. Tong, Kinetic model for the catalytic disproportionation of pine oleoresin over Pd/C catalyst, Ind. Crops Prod., 2013, 49, 1–9 CrossRef CAS.
- L. Wang, X. Chen, J. Liang, Y. Chen, X. Pu and Z. Tong, Kinetics of the catalytic isomerization and disproportionation of rosin over carbon-supported palladium, Chem. Eng. J., 2009, 152(1), 242–250 CrossRef CAS.
- Z. Cheng, Natural resin process technology, China Forestry Publishing House, Beijing, 1996 Search PubMed.
- M. Wang, S. Liu, L. Li, S. Yu, C. Xie and Z. Song, Hydrogenation of rosin over PVP-stabilized Pd nanoparticles in aqueous/organic biphasic system, Res. Chem. Intermed., 2016, 42(6), 6181–6190 CrossRef CAS.
- Y. Huang, L. Wang, X. Chen, Q. Xie, P. Gan, X. Wei and J. Liang, LDH-derived Ni catalyst as an effective catalyst in colophony hydrogenation and process optimization using response surface methodology, J. Taiwan Inst. Chem. Eng., 2016, 60, 229–235 CrossRef CAS.
- C. Wei, X. Chen, J. Xue, X. Wei, J. Liang, R. Liang and L. Wang, A small eggshell Ni/SFC3R catalyst for C5 petroleum resin hydrogenation: preparation and characterization, RSC Adv., 2016, 6(54), 49113–49122 RSC.
- J. W. Chen, Catalytic cracking technology and engineering, China Petrochemical Press, Beijing, 2005 Search PubMed.
- P. Magnoux, H. S. Cerqueira and M. Guisnet, Evolution of coke composition during ageing under nitrogen, Appl. Catal., A, 2002, 235(1), 93–99 CrossRef CAS.
- S. Du, D. P. Gamliel, M. V. Giotto, J. A. Valla and G. M. Bollas, Coke formation of model compounds relevant to pyrolysis bio-oil over ZSM-5, Appl. Catal., A, 2016, 513, 67–81 CrossRef CAS.
- D. M. Bibby, R. F. Howe and G. D. Mclellan, Coke formation in high-silica zeolites, Appl. Catal., A, 1992, 93(1), 1–34 CrossRef CAS.
- B. Behera and S. S. Ray, Structural changes of FCC catalyst from fresh to regeneration stages and associated coke in a FCC refining unit: a multinuclear solid state NMR approach, Catal. Today, 2009, 141(1), 195–204 CrossRef CAS.
- O. Bayraktar, Bioleaching of nickel from equilibrium fluid catalytic cracking catalysts, World J. Microbiol. Biotechnol., 2005, 21(5), 661–665 CrossRef CAS.
- A. de Rezende Pinho, M. B. de Almeida, F. L. Mendes, L. C. Casavechia, M. S. Talmadge, C. M. Kinchin and H. L. Chum, Fast pyrolysis oil from pinewood chips co-processing with vacuum gas oil in an FCC unit for second generation fuel production, Fuel, 2017, 188, 462–473 CrossRef.
- L. Wang, H. Guo, X. Chen, Y. Huang, L. Ren and S. Ding, Kinetic study of the hydrogenation of a monoterpene over spent FCC catalyst-supported nickel, Can. J. Chem. Eng., 2015, 93(10), 1770–1779 CrossRef CAS.
- Y. Lu, M.-Y. He, X.-T. Shu and B.-N. Zong, Exploratory study on upgrading 1-butene using spent FCC catalyst/additive under simulated conditions of FCCU's stripper, Appl. Catal., A, 2003, 255(2), 345–347 CrossRef CAS.
- Y. H. Lin and M. H. Yang, Catalytic conversion of commingled polymer waste into chemicals and fuels over spent FCC commercial catalyst in a fluidised-bed reactor, Appl. Catal., B, 2007, 69(3), 145–153 CrossRef CAS.
- Y. H. Lin and M. H. Yang, Catalytic pyrolysis of polyolefin waste into valuable hydrocarbons over reused catalyst from refinery FCC units, Appl. Catal., A, 2007, 328(2), 132–139 CrossRef CAS.
- Y. H. Lin and M. H. Yang, Chemical catalysed recycling of polypropylene over a spent FCC catalyst and various commercial cracking catalysts using TGA, Thermochim. Acta, 2008, 470(1), 52–59 CrossRef CAS.
- S. Ali, A. Garforth, D. Harris, D. Rawlence and Y. Uemichi, Polymer waste recycling over “used” catalysts, Catal. Today, 2002, 75(1), 247–255 CrossRef CAS.
- S. Zheng, S. Huang, D. Qian, K. Tang and J. Yi, Modification of FCC waste catalyst and its adsorption performance for heavy metal ions, Acta Pet. Sin., Pet. Process. Sect., 2010, 26(4), 612–616 CAS.
- S. M. Shah and H. Tu, US Pat. 4,280,897, 1980-05-27.
- Y. Muhammad and C. Li, Dibenzothiophene hydrodesulfurization using in situ generated hydrogen over Pd promoted alumina-based catalysts, Fuel Process. Technol., 2011, 92(3), 624–630 CrossRef CAS.
- Y. Muhammad, Y. Lu, C. Shen and C. Li, Dibenzothiophene hydrodesulfurization over Ru promoted alumina based catalysts using in situ generated hydrogen, Energy Convers. Manage., 2011, 52(2), 1364–1370 CrossRef CAS.
- T. H. Nguyen, P. T. Ngo, T. V. Tran, S. Nguyen, D. M. Vu, Q. L. Ha and T. T. Dang, Effect of hydrothermal conditions on the catalytic deactivation of a fluid cracking catalyst, Energy Convers. Manage., 2013, 109(2), 563–574 CAS.
- S. J. Silva, R. M. de Jesus-Neto, R. A. Fiuza, J. P. Gonçalves, A. J. Mascarenhas and H. M. Andrade, Alkali-activation of spent fluid cracking catalysts for CO2 capture, Microporous Mesoporous Mater., 2016, 232, 1–12 CrossRef.
- N. Deraz, M. Selim and M. Ramadan, Processing and properties of nanocrystalline Ni and NiO catalysts, Mater. Chem. Phys., 2009, 113(1), 269–275 CrossRef CAS.
- S. Chandrasekhar and P. Pramada, A precursor for cordierite ceramics, Appl. Clay Sci., 2004, 27(3), 187–198 CrossRef CAS.
- A. D. Khalaji and D. Das, Synthesis and characterizations of NiO nanoparticles via solid-state thermal decomposition of nickel (II) Schiff base complexes, Int. Nano Lett., 2014, 4(3), 117 CrossRef.
- J. Hao, H. Wang, S. Shi, R. Lu, T. Wang, G. Li and H. Sun, Phase behaviour and microstructures of microemulsions (I), Sci. China, Ser. B: Chem., 1997, 40(3), 225–235 CrossRef CAS.
- X. Feng, X. Niu, B. A. I. Xue, X. M. Liu and H. H. Sun, Cementing properties of oil shale ash, J. China Univ. Min. Technol., 2007, 17(4), 498–502 CrossRef CAS.
- Y. Shu, Y. Shao, X. Wei, X. Wang, Q. Sun, Q. Zhang and L. Li, Synthesis and characterization of Ni-MCM-41 for methyl blue adsorption, Microporous Mesoporous Mater., 2015, 214, 88–94 CrossRef CAS.
- W. Nabgan, T. A. T. Abdullah, R. Mat, B. Nabgan, A. A. Jalil, L. Firmansyah and S. Triwahyono, Production of hydrogen via steam reforming of acetic acid over Ni and Co supported on La2O3 catalyst, Int. J. Hydrogen Energy, 2017, 42(14), 8975–8985 CrossRef CAS.
- I. Cota, E. Ramírez, F. Medina, J. E. Sueiras, G. Layrac and D. Tichit, Highly basic catalysts obtained by intercalation of La-containing anionic complexes in layered double hydroxides, Appl. Catal., A, 2010, 382(2), 272–276 CrossRef CAS.
- S. Casenave, H. Martinez, C. Guimon, A. Auroux and V. Hulea, Acid-base properties of Mg–Ni–Al mixed oxides using LDH as precursors, Thermochim. Acta, 2001, 379(1), 85–93 CrossRef CAS.
- X. Xin, Z. Lv, B. Zhou, X. Huang, R. Zhu, X. Sha and W. Su, Effect of synthesis conditions on the performance of weakly agglomerated nanocrystalline NiO, J. Alloys Compd., 2007, 427(1), 251–255 CrossRef CAS.
- Y. song, X. Dong and W. Lin, A study of Ni-Ce/Al2O3 catalysts for catalytic reforming of CH4, CO2 and O2 to syngas, J. South China Univ. Technol., Nat. Sci., 2002, 30(8), 16–19 CAS.
- M. Besson, P. Gallezot and C. pinel, Conversion of biomass into chemicals over metal catalysts, Chem. Rev., 2013, 114(3), 1827–1870 CrossRef PubMed.
- Y. Y. Huang, L. L. Wang, X. P. Chen, X. J. Wei, J. Z. Liang and W. Li, Intrinsic kinetics study of rosin hydrogenation on a nickel catalyst supported on spent equilibrium catalyst, RSC Adv., 2017, 7(41), 25780–25788 RSC.
| This journal is © The Royal Society of Chemistry 2019 |


