 Open Access Article
Synthesis of ZnO doped high valence S element and study of photogenerated charges properties†
Lijing Zhang *,
Xiufang Zhu,
Zhihui Wang,
Shan Yun
 ,
Tan Guo,
Jiadong Zhang,
Tao Hu,
Jinlong Jiang and
Jing Chen
College of Chemical Engineering, Key Laboratory for Palygorskite Science and Applied Technology of Jiangsu Province, Huaiyin Institute of Technology, Huaian 223003, China. E-mail: lijingz16@hyit.edu.cn
First published on 5th February 2019
Abstract
Nonmetal doping is an efficient way to increase the photoresponse range of ZnO. However, the mechanism for improving the light response range of ZnO with nonmetal doping is not clear. Herein, ZnO doped with S was successfully prepared by ion exchange and calcination methods, which resulted in the uniform distribution of sulfur ions in ZnO. The S element doped was mainly S4+ and S6+, which was identified by XPS. We studied the influence of S on the photogenerated charge characteristics of ZnO with SPS. Results indicated that the uniform distribution of S dopants elevated the valence band maximum by mixing S 3p with the upper valence band states of ZnO. The valence band maxima of S–ZnO was 0.37 eV higher than that of ZnO. This result was the main reason for the improvement in the light response. We also studied the photocatalytic activity of Ag/S–ZnO. Ag/S–ZnO with 10 wt% Ag loading showed the highest photocatalytic degradation rate for MO. In this paper, a potential photocatalytic mechanism has been proposed.
Introduction
Photocatalytic reactions have attracted much attention in recent years due to their value in applications involving solar energy conversion and environmental purification. Over the past few decades, zinc oxide (ZnO) has been recognized as a promising photocatalyst for decomposing organic pollutants due to its high electron mobility, faster photoinduced electron transport rates, and high catalytic activity.1–5 However, ZnO can only utilize ultraviolet light for its wide band gap, which is about 4% of the solar spectrum. This implies that visible light, which is about 42% of the solar spectrum, is not effectively utilized. In order to increase the photoresponse range of ZnO and improve the photocatalytic activity of ZnO, considerable efforts have been made such as controlling the morphology,6,7 combining ZnO with other semiconductor materials,8–12 loading noble metals,13 and doping with other elements.14,15 Among these, one efficient way involves doping with metals such as cobalt, iron or manganese.14,15 However, doping with metals often causes thermal instability, which is easy to become the carrier recombination center.16 In 2001, Asahi et al. proved the feasibility of doping nonmetal elements by theoretical calculations.17 Nonmetal doping with N, C, F has become a hot research topic for improving the activity of semiconductor photocatalysts.18–21 In general, nonmetal doping can result in lattice defects or energy level impurities, which can enhance the visible-light response of ZnO, improve carrier mobility rate and enhance the photogenerated charge separation efficiency.22,23 For example, Feng et al. prepared sulfur-doped carbon nitride, which showed a higher photocatalytic H2 evolution activity than that by carbon nitride.24 Xiang et al. synthesized nitrogen and sulfur co-doped TiO2, which showed an enhanced photocatalytic activity for degrading 4-chlorophenol compared to pure TiO2.25 However, there are relatively few studies on S doped ZnO for the photocatalytic degradation of organic pollutants and the photocatalytic mechanism of S–ZnO is not clear.Herein, we utilized ion exchange and calcination methods for the synthesis of S–ZnO photocatalysts, which resulted in the uniform distribution of sulfur ions in ZnO. We discovered that the S element doped was mainly S4+ and S6+. The obtained S–ZnO sample extended the photoresponse range for ZnO. In order to explore S element doped ZnO, the photogenerated charge properties of S–ZnO were characterized by surface photovoltage spectroscopy (SPS). In this paper, a possible photocatalytic mechanism has been proposed.
Experimental section
Material synthesis
The ZnO nanoflowers were synthesized using the hydrothermal method. First, 0.878 g Zn(CH3COO)2·2H2O was dispersed in 60 mL deionized water. Then, 20 mL NaOH (3 mol L−1) was added to the above solution with stirring. The clear solution turned turbid. When NaOH was added in excess, the solution turned from turbid to clear. The solution was stirred for 5 additional minutes, transferred to a 100 mL stainless steel autoclave, and maintained at 160 °C for 10 h. The obtained white powder was washed with water and absolute ethanol several times and dried at 80 °C for 12 h.0.2 g of the obtained white powder was added into a round-bottom flask. 50 mL Na2S (0.5 mol L−1) was added to the round-bottom flask. Then, the mixed solution was maintained at 60 °C for 4 h with stirring. The obtained powder was washed with deionized water and ethanol. The powder was then treated with NaOH (4 mol L−1). The sample was heated at 600 °C for 6 h.
Material characterization
The crystal morphologies of the samples were obtained on an XL 30 ESEM FEG field-emission scanning electron microscope (FESEM; FEI Company). The X-ray diffraction patterns were recorded on a Thermo Scientific ARL X’TRA Power Diffractometer with Cu Kα radiation (λ = 1.54056 Å) in the 20–70° range. The X-ray photoelectron spectra (XPS) of the samples were characterized with an Escalab 250 spectrometer with monochromatized Al Kα. The UV-Vis-NIR spectrophotometer (Shimadzu UV-3600) was used to characterize the UV-Vis diffuse reflectance spectra (UV-Vis DRS) of the samples. The SPV of the samples was characterized with an equipment reported in our earlier study.Photocatalytic reaction
The photocatalytic activity of the Ag/S–ZnO photocatalyst was evaluated by photodegradation of methyl orange (MO). The mixed light, provided by a 500 W Xenon lamp, acted as the light source. 25 mg of photocatalyst was dispersed in a 25 mL MO solution (10 mg L−1) by ultrasonication and stirring. In order to obtain the adsorption and desorption equilibrium between the catalyst and the dye solution, the solution was stirred in the dark for 1 h before illumination. Then, aliquots were taken from the suspension at 30 min intervals. The catalytic efficiency of the photocatalyst was evaluated using a UV-2014 ultraviolet-visible spectrophotometer. The results were used to monitor absorbance changes at room temperature for the MO solution at the maximum absorption wavelength (464 nm).Results and discussion
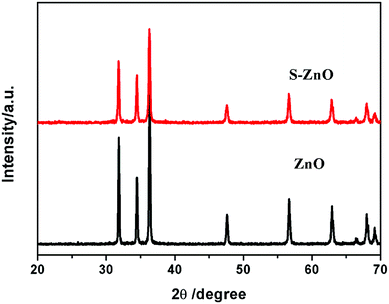
Fig. 1 shows the XRD patterns for ZnO and S–ZnO. The diffraction peaks for ZnO at 31.5°, 34.2°, and 36.2° can be indexed to the wurtzite phase of ZnO. The ratio of the (100) diffraction peak to the (002) diffraction peak was bigger than 1, which indicates that ZnO grew along the polar and the non-polar surfaces that were exposed to the outer surface. The XRD pattern for the S–ZnO sample was similar to that of ZnO, which indicates that S doping may not alter the crystal structure of ZnO. However, the intensity of the ZnO diffraction peaks was weaker than that of S–ZnO because S doping may have decreased the crystallinity of ZnO.The S–ZnO morphologies were studied using a field-emission scanning electron microscope (FESEM). As shown in Fig. 2(a), the ZnO sample after treatment with Na2S showed self-assembled nanoflowers having nanorods with the length of 3–3.5 μm and diameter of 350–700 nm. After treatment with NaOH, the sample showed hollow nanometer rods (shown in Fig. 2(b)). After calcination, the sample showed hollow porous nanorods, which were made of nanoparticles (shown in Fig. 2(c and d)).
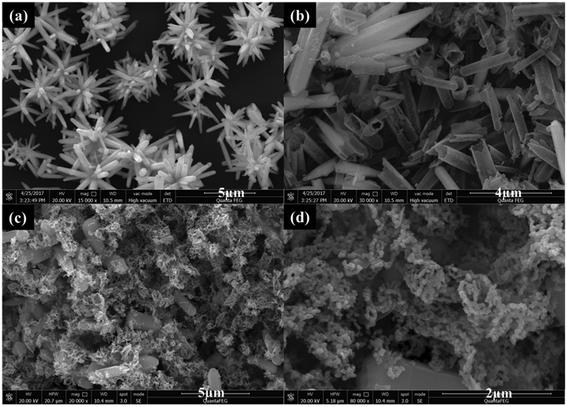 | ||
| Fig. 2 FESEM images of (a) ZnO after treating with Na2S, (b) ZnO after treating with NaOH, (c and d) S–ZnO. | ||
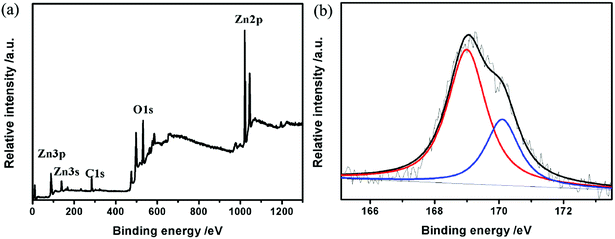
In order to validate the valence state of S, the S–ZnO samples were investigated by XPS. Fig. 3 shows the XPS survey spectrum of S–ZnO, which clearly shows Zn 2p, Zn 3p, Zn 3s, C 1s, and O 1s peaks. The C 1s peak can be attributed to the adventitious hydrocarbon from the XPS instrument and CO2 adsorbed on the sample.26 The high-resolution S 2p XPS spectra of S–ZnO are shown in Fig. 2(b). The peaks at 169.0 eV and 170.0 eV can be assigned to S4+ and S6+, respectively. This result reveals that the high valent sulfur was doped into the lattice of ZnO.27–29
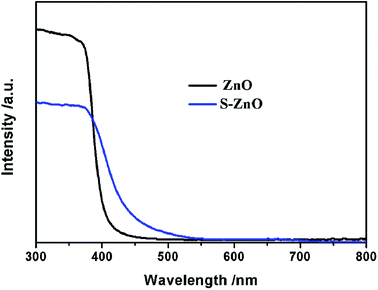
In order to study the photoresponse properties of S–ZnO samples, the UV-Vis diffuse reflection spectra of ZnO and S–ZnO were measured. As shown in Fig. 4, the undoped ZnO sample showed a characteristic spectrum of pure ZnO with a sharp fundamental absorption edge at ∼390 nm. Compared to ZnO, the absorption range of the S–ZnO sample showed a significant red shift to the visible light region (550 nm) after S doping, which indicated that S–ZnO can utilize the visible range.
In order to detect the photogenerated charge characteristics of S–ZnO, a surface photovoltage technique (SPV) was used. SPV is a powerful technique used to study the transfer behavior of photogenerated charge carriers with high sensitivity (108 q cm−2). Fig. 5(a) shows the SPV spectra of ZnO and S–ZnO. It can be seen that ZnO exhibits a high photovoltage response band (300–385 nm) with the response edge of 385 nm, which is related to the intrinsic transition of ZnO. The band gap of ZnO was 3.22 eV. The photovoltage response of ZnO in the 300–385 nm range was positive (shown in Fig. 5(a)) and the corresponding phase spectrum was in the range of 0–90° (shown in Fig. 5(b)), which indicated that the photogenerated holes transferred to the photoelectrode under ultraviolet light.30,31 The photovoltage response range of S–ZnO compared to that of ZnO extended into the visible light region (500 nm) with the response edge of 435 nm, which indicated that the band gap of S–ZnO was 2.85 eV. Yu et al. reported that the theoretical calculation of the first-principle density function showed that the ZnO band gap could be reduced with S doping.32 The S–ZnO sample was synthesized by ion exchange and calcination, which resulted in the uniform distribution of sulfur ions in ZnO. The uniform distribution of anion dopants could elevate the valence band maximum by mixing anion doped states with the upper valence band states of the bulk material.33,34 According to the tested results of SPS (in Fig. 4(a)), the SPS response edge f S–ZnO extended to 435 nm, which indicated that the valence band maxima of S–ZnO was 0.37 eV higher than that of ZnO whose SPS response edge was 385 nm. According to the band-to-band transition, the photovoltage response of S–ZnO was in the range of 300–435 nm and the phase spectrum was in the range of 0–90°, which indicated that the photogenerated holes transferred to the photoelectrode. The photovoltage response of S–ZnO in the range of 435–500 nm is due to the sub-gap transition. However, as seen in Fig. 4(a), the photovoltage response intensity of S–ZnO in the range of 300–380 nm was weaker than that of ZnO. This result, which is consistent with XRD analysis, may be due to the lattice defect caused by the doping of sulfur element. According to the band-to-band transition, the SPS response was not sensitive to external bias. Therefore, we tested the SPS response of S–ZnO at 410 nm with external bias. As shown in Fig. S1,† the SPS responses of S–ZnO with 0, 0.1, 0.5, and 1 V external bias at 410 nm were 4.6469 × 10⁻⁵, 4.8272 × 10⁻⁵, 4.7222 × 10⁻⁵, and 4.2552 × 10⁻⁵ V, respectively. This result also indicates that the SPS response of S–ZnO at 410 nm was based on the band-to-band transition.
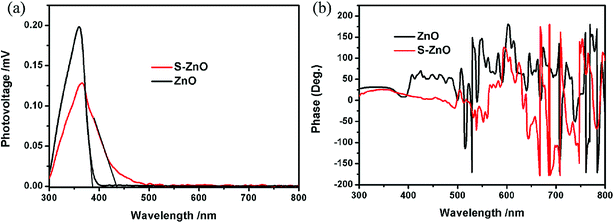 | ||
| Fig. 5 The surface photovoltage spectrum (SPS) of ZnO and S–ZnO (a). The phase spectra of ZnO and S–ZnO (b). | ||
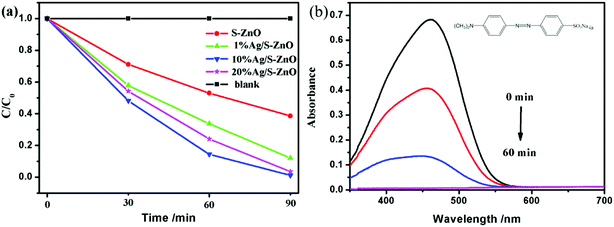
In order to evaluate the photocatalytic activity of the S–ZnO sample, the degradation of a standard organic dye, methyl orange (MO), was used as a probe reaction (molecular structural formula of MO is shown in Fig. 6(b)). Fig. 6(a) shows the degradation spectra of Ag/S–ZnO with various Ag/S–ZnO mass fractions. As shown in Fig. 6(a), no degradation activity was obtained without a catalyst, which implied that the reaction was light-catalyzed. Pure S–ZnO showed poor degradation activity with light, which caused the easy recombination of the photogenerated charges in S–ZnO. After illumination for 90 min, only about 62% of methyl orange (MO) degraded. Compared with pure S–ZnO, Ag/S–ZnO composites exhibited significant improvement in the photocatalytic degradation of MO. In addition, Ag/S–ZnO with 10 wt% Ag loading showed the highest photocatalytic degradation rate for MO. After illumination for 90 min, about 100% of methyl orange (MO) was degraded.
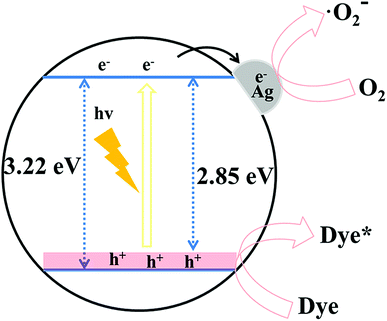
Based on the above analysis, we proposed a possible photocatalytic mechanism. The potential photogenerated charge transfer process of S–ZnO is shown in Scheme 1. The uniform distribution of S dopants could elevate the valence band maximum by mixing S 3p with the upper valence band states of ZnO. The valence band maxima of S–ZnO was 0.37 eV higher than that of ZnO. When the photogenerated electrons from the valence band of S–ZnO were transferred to the conduction band under light, the photogenerated electrons were captured by Ag. This resulted in the formation of a superoxide radical with oxygen molecules on the surface. The photogenerated holes in the valence band of S–ZnO degraded MO.
Conclusion
In this study, the ZnO doped with a high valent S element was successfully prepared by ion exchange and calcination methods, resulting in the uniform distribution of sulfur ions in ZnO. We studied the influence of the uniform distribution of S (S4+ and S6+) doping on photogenerated charge characteristics of ZnO with SPS. The photoelectron response of ZnO was extended to 500 nm due to the high valent S doping. The uniform distribution of S dopants elevated the valence band maximum by mixing S 3p with the upper valence band states of ZnO. The valence band maxima of S–ZnO was 0.37 eV higher than that of ZnO. Ag/S–ZnO, with 10 wt% Ag loading, showed the highest photocatalytic degradation rate for MO.Conflicts of interest
There are no conflicts to declare.Acknowledgements
For financial support, we are grateful to the National Natural Science Foundation of China (No. 51574130), the National Science Youth Foundation of China (No. 51704123, No. 21602074, and No. 21605055), the Foundation of Key Laboratory for Palygorskite Science and Applied Technology of Jiangsu Province (No. HPK201504) and the Provincial Science Youth Foundation of Jiangsu (No. BK20160424, No. BK20160425, and No. BK20150416).References
- S. Rajendran, M. M. Khan and F. Gracia, et al., Ce3+-ion-induced visible-light photocatalytic degradation and electrochemical activity of ZnO/CeO2 nanocomposite, Sci. Rep., 2016, 6, 31641 CrossRef CAS PubMed.
- P. K. Sanoop, S. Anas and S. Ananthakumar, et al., Synthesis of yttrium doped nanocrystalline ZnO and its photocatalytic activity in methylene blue degradation, Arabian J. Chem., 2016, 9, S1618–S1626 CrossRef CAS.
- X. Chen, Z. Wu and D. Liu, et al., Preparation of ZnO Photocatalyst for the Efficient and Rapid Photocatalytic Degradation of Azo Dyes, Nanoscale Res. Lett., 2017, 12(1), 143 CrossRef PubMed.
- H. Sudrajat and S. Babel, Comparison and mechanism of photocatalytic activities of N-ZnO and N-ZrO2 for the degradation of rhodamine 6G, Environ. Sci. Pollut. Res., 2016, 23(10), 10177–10188 CrossRef CAS PubMed.
- H. Sudrajat and S. Babel, Comparison and mechanism of photocatalytic activities of N-ZnO and N-ZrO2 for the degradation of rhodamine 6G, Environ. Sci. Pollut. Res., 2016, 23(10), 10177–10188 CrossRef CAS PubMed.
- Y. Yuan, G. F. Huang and W. Y. Hu, et al., Tunable synthesis of various ZnO architectural structures with enhanced photocatalytic activities, Mater. Lett., 2016, 175, 68–71 CrossRef CAS.
- Y. M. Hunge, A. A. Yadav and S. B. Kulkarni, et al., A multifunctional ZnO thin film based devices for photoelectrocatalytic degradation of terephthalic acid and CO2 gas sensing applications, Sens. Actuators, B, 2018, 274, 1–9 CrossRef CAS.
- T. Xu, L. Zhang and H. Cheng, et al., Significantly enhanced photocatalytic performance of ZnO via graphene hybridization and the mechanism study, Appl. Catal., B, 2011, 101(3–4), 382–387 CrossRef CAS.
- Y. Wang, R. Shi and J. Lin, et al., Enhancement of photocurrent and photocatalytic activity of ZnO hybridized with graphite-like C3N4, Energy Environ. Sci., 2011, 4(8), 2922–2929 RSC.
- Y. Yuan, G. F. Huang and W. Y. Hu, et al., Construction of g-C3N4/CeO2/ZnO ternary photocatalysts with enhanced photocatalytic performance, J. Phys. Chem. Solids, 2017, 106, 1–9 CrossRef CAS.
- J. H. Xiao, W. Q. Huang and Y. Hu, et al., Facile in situ synthesis of wurtzite ZnS/ZnO core/shell heterostructure with highly efficient visible-light photocatalytic activity and photostability, J. Phys. D: Appl. Phys., 2018, 51(7), 075501 CrossRef.
- N. Li, Y. Tian and J. Zhao, et al., Z-scheme 2D/3D g-C3N4@ ZnO with enhanced photocatalytic activity for cephalexin oxidation under solar light, Chem. Eng. J., 2018, 352, 412–422 CrossRef CAS.
- Y. Zheng, L. Zheng and Y. Zhan, et al., Ag/ZnO heterostructure nanocrystals: synthesis, characterization, and photocatalysis, Inorg. Chem., 2007, 46(17), 6980–6986 CrossRef CAS PubMed.
- G. Poongodi, P. Anandan and R. M. Kumar, et al., Studies on visible light photocatalytic and antibacterial activities of nanostructured cobalt doped ZnO thin films prepared by sol–gel spin coating method, Spectrochim. Acta, Part A, 2015, 148, 237–243 CrossRef CAS PubMed.
- Y. G. Habba, M. Capochichi-Gnambodoe and Y. Leprince-Wang, Enhanced Photocatalytic Activity of Iron-Doped ZnO Nanowires for Water Purification, Appl. Sci., 2017, 7(11), 1185 CrossRef.
- W. Choi, A. Termin and M. R. Hoffmann, The Role of Metal Ion Dopants in Quantum-Sized TiO2: Correlation between Photoreactivity and Charge Carrier Recombination Dynamics, J. Phys. Chem., 1994, 98(51), 13669–13679 CrossRef.
- R. Asahi, T. Morikawa and T. Ohwaki, et al., Visible-light photocatalysis in nitrogen-doped titanium oxides, Science, 2001, 293(5528), 269–271 CrossRef CAS PubMed.
- Z. Yu, L. C. Yin and Y. Xie, et al., Crystallinity-dependent substitutional nitrogen doping in ZnO and its improved visible light photocatalytic activity, J. Colloid Interface Sci., 2013, 400(12), 18–23 CrossRef CAS PubMed.
- Y. Qiu, K. Yan and H. Deng, et al., Secondary branching and nitrogen doping of ZnO nanotetrapods: building a highly active network for photoelectrochemical water splitting, Nano Lett., 2012, 12(1), 407 CrossRef CAS PubMed.
- S. H. Choi, D. Lim and J. W. Park, et al., The Role of Carbon Doping in ZnO, J. Korean Phys. Soc., 2010, 57(6), 1482–1485 CrossRef.
- P. M. R. Kumar, C. S. Kartha and K. P. Vijayakumar, et al., Effect of fluorine doping on structural, electrical and optical properties of ZnO thin films, Mater. Sci. Eng., B, 2005, 117(3), 307–312 CrossRef.
- H. Qin, W. Li and Y. Xia, et al., Photocatalytic activity of heterostructures based on ZnO and N-doped ZnO, ACS Appl. Mater. Interfaces, 2011, 3(8), 3152–3156 CrossRef CAS PubMed.
- D. Li and H. Haneda, Synthesis of nitrogen-containing ZnO powders by spray pyrolysis and their visible-light photocatalysis in gas-phase acetaldehyde decomposition, J. Photochem. Photobiol., A, 2003, 155(1–3), 171–178 CAS.
- L. L. Feng, Y. Zou and C. Li, et al., Nanoporous sulfur-doped graphitic carbon nitride microrods: A durable catalyst for visible-light-driven H2 evolution, Int. J. Hydrogen Energy, 2014, 39(28), 15373–15379 CrossRef CAS.
- Q. Xiang, J. Yu and M. Jaroniec, Nitrogen and sulfur co-doped TiO2 nanosheets with exposed {001} facets: synthesis, characterization and visible-light photocatalytic activity, Phys. Chem. Chem. Phys., 2011, 13(11), 4853–4861 RSC.
- J. Yu, Y. Hai and B. Cheng, Enhanced photocatalytic H2 production activity of TiO2 by Ni(OH)2 cluster modification, J. Phys. Chem. C, 2011, 115, 4953–4958 CrossRef CAS.
- T. Ohno, T. Tsubota, Y. Nakamura and K. Sayama, Preparation of S, C cation-codoped SrTiO3 and its photocatalytic activity under visible light, Appl. Catal., A, 2005, 288, 74–79 CrossRef CAS.
- T. Ohno, T. Mitsui and M. Matsumura, Photocatalytic activity of S-doped TiO2 photocatalyst under visible light, Chem. Lett., 2003, 32, 364–365 CrossRef CAS.
- J. C. Yu, W. Ho, J. G. Yu, H. Yip, P. K. Wong and J. C. Zhao, Efficient visible-light-induced photocatalytic disinfection on sulfur-doped nanocrystalline titania, Environ. Sci. Technol., 2005, 39, 1175–1179 CrossRef CAS PubMed.
- H. Fan, T. Jiang and H. Li, et al., Effect of BiVO4 Crystalline Phases on the Photoinduced Carriers Behavior and Photocatalytic Activity, J. Phys. Chem. C, 2016, 116(3), 2425–2430 CrossRef.
- T. Jiang, T. Xie and W. Yang, et al., Photoelectrochemical and Photovoltaic Properties of p–n Cu2O Homojunction Films and Their Photocatalytic Performance, J. Phys. Chem. C, 2013, 117(9), 4619–4624 CrossRef CAS.
- W. Yu, J. Zhang and T. Peng, New insight into the enhanced photocatalytic activity of N-, C-and S-doped ZnO photocatalysts, Appl. Catal., B, 2016, 181, 220–227 CrossRef CAS.
- G. Liu, L. Wang and H. G. Yang, et al., Titania-based photocatalysts—crystal growth, doping and heterostructuring, J. Mater. Chem., 2010, 20(5), 831–843 RSC.
- G. Liu, P. Niu and C. Sun, et al., Unique electronic structure induced high photoreactivity of sulfur-doped graphitic C3N4, J. Am. Chem. Soc., 2010, 132(33), 11642–11648 CrossRef CAS PubMed.
Footnote |
| † Electronic supplementary information (ESI) available. See DOI: 10.1039/c8ra07751g |
| This journal is © The Royal Society of Chemistry 2019 |

