
 Open Access Article
 This Open Access Article is licensed under a Creative Commons Attribution-Non Commercial 3.0 Unported Licence
Optimization of ultrasonic-assisted extraction of pigment from Dioscorea cirrhosa by response surface methodology and evaluation of its stability†
Manli Zhong‡
a,
Shiya Huang‡a,
Huanhuan Wanga,
Yuelong Huangb,
Jianren Xub and
Lijuan Zhang *a
*a
aSchool of Chemistry and Chemical Engineering, South China University of Technology, Guangzhou 510640, China. E-mail: celjzh@scut.edu.cn
bGuangzhou Jiao Zi Daily Chemical Co., Ltd., Guangzhou 510315, China
First published on 11th January 2019
Abstract
Response surface methodology (RSM) was utilized to optimize the ultrasonic-assisted extraction (UAE) of Dioscorea cirrhosa pigment (DCP). The results demonstrated that the yield of DCP is the highest (32.27%) when acetone volume fraction is 74%, extraction time is 31 min, and the temperature is 54 °C. Next, the effects of pH, temperature, light, metal ions, reductants and oxidants on the stability of DCP were further evaluated to confirm the best storage conditions of DCP. The results showed that DCP should be stored at a wide pH range of 3 to 9, below 80 °C and away from light. Metal ions such as Fe2+, Fe3+, and Ti4+ can destabilize DCP, while K+, Al3+, Ca2+, Cu2+, Mg2+, and Zn2+ have little impact on DCP. Moreover, DCP showed good anti-reduction and poor anti-oxidization properties. These results might provide the basic data and theoretical guidance for the application of DCP.
Introduction
Dioscorea cirrhosa is a plant which belongs to the family Dioscoreaceae, native to China, Indochina, and the Philippines. Dioscorea cirrhosa is rich in natural pigments, contains condensed tannins, and it can be used for dyeing food, silk fabric and cloth. DCP is a multifunctional pigment, which has strong dyeing ability, corrosion resistance and safety, good dyeing effect and uniform color can be obtained.1 In addition, DCP have many health benefits, including hemostasis, antioxidant, hypolipidemic, hypotensive, and anti-tumor effects.2 Thus, DCP has been widely utilized in medicine, food, and cosmetics.3,4DCP was usually extracted by solvent extraction method in previous studies,5,6 whose mechanism is based on the different solubility of DCP in different solvents. However, this method is time-consuming, inefficient, and not easy to extract DCP. It takes 3 hours to extract DCP in 60 °C water bath.7 The application of this method is limited due to its long extraction time and low yield. Recently, various non-conventional methods such as supercritical fluid extraction, pressurized liquid extraction, microwave-assisted extraction and ultrasound-assisted extraction have emerged as alternatives to the conventional methods, with advantages including lower solvent consumption, shorter extraction time and greater environmental friendliness. Among these non-conventional methods, UAE has been applied to many plant products for its ability to enhance the solvent penetration and increase the solid–liquid contact area due to the solvent cavitation effect, then the effective components can be extracted.8 The extraction yield of flavonoids by UAE could reached up to 17.2%, which was much higher than that extracted by heated, microwaves-assisted and enzyme-assisted extractions.9 During the extraction of hesperidin from penggan peel10 or hemicellulose from grape pomace,11 the UAE was more effective than the conventional procedures. However, there are only a few reports regarding ultrasonic-assisted extraction of DCP. Some papers researched the ultrasonic-assisted extraction of DCP using ethanol. However, it takes long time and large amount of solvent, the optimum extraction process showed that the extraction time was 50 min12 and the ratio of solid to liquid was 1![[thin space (1/6-em)]](https://www.rsc.org/images/entities/char_2009.gif) :40.13 Meanwhile, there is no study of the interactions between the factors, the extraction process was only investigated by single factor experiment, and the yield of DCP had not been determined. In this research, DCP was extracted by UAE, which has advantages on respect to extraction time, solvent consumption, extraction yields and economy. The mechanism of UAE is to accelerate the release, diffusion and dissolution process of tannins in DCP by cavitation bubbles, mechanical and thermal effects.
:40.13 Meanwhile, there is no study of the interactions between the factors, the extraction process was only investigated by single factor experiment, and the yield of DCP had not been determined. In this research, DCP was extracted by UAE, which has advantages on respect to extraction time, solvent consumption, extraction yields and economy. The mechanism of UAE is to accelerate the release, diffusion and dissolution process of tannins in DCP by cavitation bubbles, mechanical and thermal effects.
Response surface methodology (RSM) is an effective statistical method for analyzing each level of experimental factors continuously during the optimization process. It overcomes the shortcoming of orthogonal design which can only analyze the effect of independent variables and fails to reflect the effect of interaction between desired response and factors. RSM is concise and efficient, and can assess the effect of independent variables and their interactions.14 Up to now, numerous studies applying RSM method with the purpose of optimizing the process conditions have been published,15 such as extraction of oil, protein, phenolic compounds, pigments, polysaccharides, hydrocolloids, etc. In recent years, RSM has been successfully used to optimize extraction conditions of bioactive compounds, such as grape,16 Feronia limonia17 and blueberry wine pomace.18 Box–Behnken design (BBD), one experimental design of RSM, is more efficient and easier to arrange and interpret experiments in comparison with the Central Composite Design (CCD) and Full Factorial Design (FFD).19 Meanwhile, the BBD with a smaller number of experimental runs is more efficient and appropriate to evaluate the effect of interaction between the factors, and applied popularly in food processes.15,20 This design has been successfully used in optimisation for polysaccharides extraction, anthocyanins extraction and mycosterol extraction.18,21,22 Therefore, the work selected the BBD to design the experiments in RSM. As far as we know, this technique has not yet been utilized to optimize the extraction of Dioscorea cirrhosa which is a potential source of natural pigment.
The objective of this study was to determine the optimal conditions for the UAE of DCP using RSM and BBD. The structural characteristics of DCP obtained by purification with a Sephadex LH-20 column were estimated via Fourier transform infrared spectroscopy (FT-IR) and matrix-assisted laser desorption/ionization time-of-flight (MALDI-TOF) mass spectroscopy. The effects of pH, temperature, light, metal ions, reductants and oxidants on the stability of DCP were investigated to provide a theoretical basis for its preservation.
Experimental
Materials
Dioscorea cirrhosa was obtained from Guangxi. The tubers were peeled, crushed and dried. Acetone, methanol, ethanol, and hydrochloric acid were of analytical grade (AR) and purchased from Guangzhou Chemical Reagent Co., LTD (Guangzhou, China). Hydrogen peroxide (AR) was purchased from Qiangsheng Functional Chemical Co., LTD (Jiangsu, China). Catechin (AR) was purchased from J&K Scientific LTD (Beijing, China). Sephadex LH-20 was purchased from Pharmacia (Uppsala, Sweden). 2,5-Dihydroxybenzoic acid was obtained from Sigma-Aldrich (St. Louis, MO, USA). Other chemicals were of analytical grade and purchased from the Kemiou Chemical Reagent Co., LTD (Tianjin, China).Extraction of DCP and determination of DCP yield
Before experiment, dried Dioscorea cirrhosa was ground into powder (particle diameter 97–900 μm) using mill (HK-02A, Xuzhong Mechanical Equipment Co., LTD, Hangzhou, Zhejiang, China) with meshes size of 97, 150, 300, 450, and 900 μm. UAE was performed in a ultrasonic cleaner (KQ-600DE, Xinzhi Biotechnology Co., LTD, Ningbo, Zhejiang, China). Temperature was controlled with a thermometer. Briefly, the dried sample (2 g) and acetone aqueous solution (volume fraction 30–90%) at various solid–liquid ratios (1:5 to 1:30 g mL−1) were put into a 100 mL beaker, then the samples were extracted at different temperatures (20–80 °C) and powers (120–420 W) for different time (10–60 min). After that, the extracts were centrifuged (1-6P, Sigma, Germany) at 3000 rpm for 5 min, and the supernatant was filtered, evaporated and dried using rotary evaporator (R-210, Christ, Germany) and vacuum oven (DZF-1B, Shanghai Yuejin Medical Instrument Co., LTD, Shanghai, China), brown powder was obtained and stored at 4 °C.
The yield of DCP was determined using a vanillin colorimetric assay as described in the previous report with few modifications.23 In detail, to 1 mL (V1) extract, 99 mL methanol was added to dilute the extract 100-fold. To 1 mL (V) of diluent, 6 mL vanillin (4%, w/v) and 3 mL hydrochloric acid were added. The reaction was conducted in darkness at 25 °C for 30 min. The absorbance at 500 nm was monitored, and the concentration of DCP was expressed as catechin equivalents (mg catechin/mL sample) using a catechin calibration curve (A = 1.11507C + 0.01224, R2 = 0.99933, where A is the absorbance value of sample, C is the concentration of catechin) that ranged from 0.02 mg mL−1 to 1.5 mg mL−1. The yield of DCP (Y) was calculated as eqn (1).
| Y(%) = C × V(V0/V1) × 100 × 10−3/m0 × 100% | (1) |
Experimental design and data analysis
RSM and BBD was used to optimize the operational parameters of UAE. A series of single factor experiments were carried out to identify the independent variables and appropriate ranges of the BBD.The effects of each factor were evaluated by the yield of DCP. The selected variables were coded according to the following eqn (2):
| xi = (Xi − X0)/ΔX | (2) |
After experiment, the data were fitted with a second-order polynomial equation as follows:
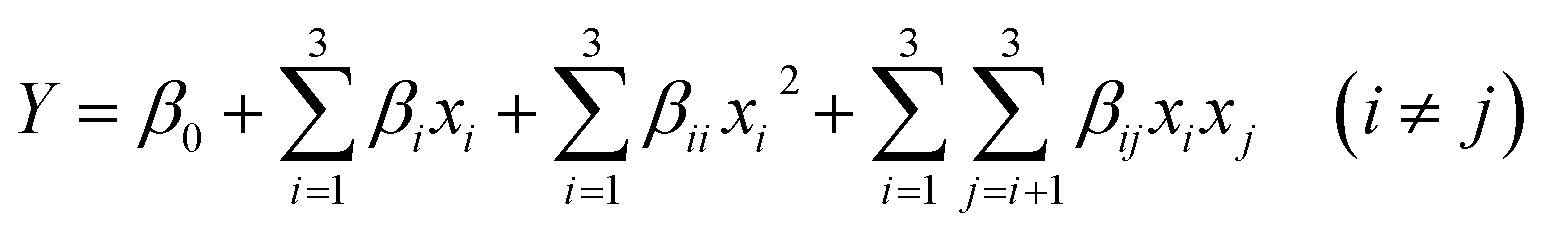 | (3) |
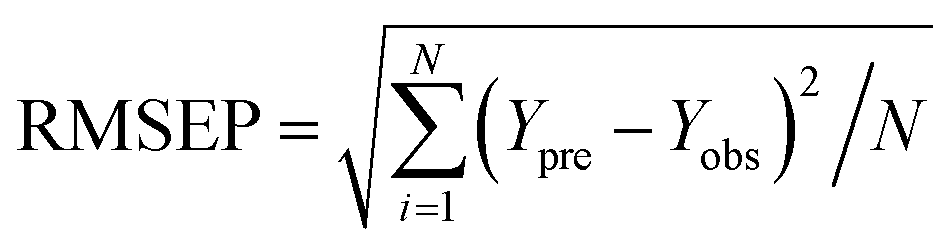
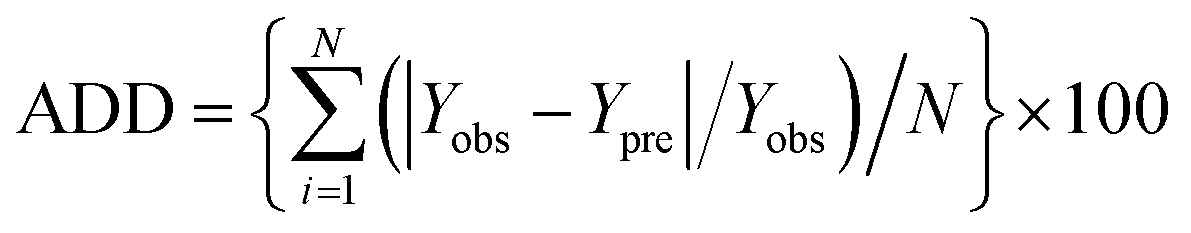
The analysis of variance (ANOVA) was utilized to evaluate the significance of individual, quadratic, and interaction terms in eqn (3). Additionally, the models were compared based on the coefficient of determination (R2), adjusted coefficient of determination (Radj2), root mean square error of prediction (RMSEP), and absolute average deviation (AAD). R2 must be close to 1, the RMSEP and AAD between the estimated and observed data must be as low as possible.24,25
 | (4) |
 | (5) |
The experimental design, graphical and statistical analysis were performed using Design-Expert software (8.0.7.1 Statease Inc., Minneapolis, MN USA). All trials were performed in triplicate.
Purification of DCP
The purification procedure of DCP was performed on a Sephadex LH-20 column, according to the method described in the archival literature.26 Briefly, approximately 100 mg of the dried extract, dissolved in 95% ethanol, and was filled in a column of Sephadex LH-20 equilibrated with 95% ethanol. The column was eluted with ethanol (400 mL), and 20 mL fractions were collected. The column was then eluted with 50% aqueous acetone (200 mL), and 5 mL fractions were collected. The absorbance from 200–400 nm was determined by UV-vis. All acetone-soluble fractions had the same or similar peaks were collected and mixed. After concentration and lyophilization, the fraction was received.Structural characterization of DCP
:3. NaCl (0.52 mg mL−1) was mixed with the analyte-matrix solution (1:3, v/v) to strongly favor the formation of molecular ions with Na+ and avoid any misinterpretation of the mass spectra due to the formation of molecular ions with different cations. Then, the mixture (1 μL) was spotted on the steel target.000 Å column and RI detector. The column system was calibrated with a set of monodisperse polystyrene standards (molecular weight range of 162–5.0 × 10⁶ g mol−1) using HPLC grade THF as mobile phase at a flow rate of 1.0 mL min−1 at 30 °C.Stability of DCP experiments
The loss rate and absorbance were used to evaluate the effect of pH, temperature, light, metal ions, reductants and oxidants on the stability of DCP.28 Approximate 100 mg dried extracts were dissolved in acetone (70%, v/v) to 100 mL. The absorbance of DCP solution at 321 nm was measured before (A0) and after (At) the stability experiments. The loss rate of the pigment was confirmed according to the following equation:| Loss rate (%) = (A0 − At)/A0 × 100% | (6) |
(1) The effect of pH. Hydrochloric acid (1 mol L−1) and sodium hydroxide (1%) were used to adjust the pH of DCP diluent to values between 1 and 14. The mixtures were shaken well, the absorbance at maximum wavelength (321 nm) was determined after storing in darkness for 3 h, and the colors of solutions were compared before and after experiments.
(2) The effect of temperature. To explore the effect of temperature on the stability of DCP, DCP solutions were heated in a water bath for 30 min at the following temperatures: 30, 40, 50, 60, 70, 80, 90 and 100 °C, then cooled to 20 °C. The absorbance at the maximum wavelength (321 nm) and loss rate were determined.
(3) The effect of light. Experiments were conducted in darkness or light (fluorescent lamp, 3000 lx) for 0, 1, 2, 3, 4, 5, and 6 h, respectively. The absorbance at the maximum wavelength (321 nm) and the loss rate were determined.
(4) The effect of metal ions. FeSO4, FeCl3, KCl, AlCl3, CaCl2, CuCl2, MgCl2, ZnCl2, and Ti(SO4)2 were weighed and added to DCP solutions with different metal ions (Fe2+, Fe3+, K+, Al3+, Ca2+, Cu2+, Mg2+, Zn2+, or Ti4+) at concentrations of 0.1 mg mL−1. The absorbance at the maximum wavelength (321 nm) and the loss rate were determined after storage in daylight at room temperature for 3 h. The colors of solutions were observed before and after experiments.
(5) The effect of reductant and oxidant. H2O2 and NaHSO3 were used as oxidant and reductant, respectively. Each sample, containing various concentrations of H2O2 or NaHSO3, was shaken well. After 3 h, the absorbance of the mixtures was measured at the maximum wavelength (321 nm) and loss rates were determined.
Results and discussion
Preliminary experiments (solvent selection)
Distilled water, methanol (70%, v/v), ethanol (70%, v/v), and acetone (70%, v/v) were used as solvents to extract powdered samples (2 g, particle diameter: 300 μm) at a solid–liquid ratio 1:10, 240 W and 50 °C for 30 min, respectively. The yields of DCP were 13.53% in water system, 17.84% in methanol–water system, 25.70% in ethanol–water system and 32.36% in acetone–water system, respectively. The reason could be that the system of acetone–water is able to disrupt the non-covalent bonds between tannins and plant proteins, resulting in more efficient extraction of tannins from Dioscorea cirrhosa. Furthermore, the formation of insoluble condensates based on tannins and proteins could be effectively inhibited by acetone.29 In addition, acetone–water mixtures are easily evaporated. Thus, acetone was selected as the solvent.
Effect of factors on the extraction yield of DCP
:10, temperature 50 °C, time 30 min, and power 240 W. The yield of DCP increased with the decrease of particle size, in agreement with other reports.32,33 The specific surface area increased with the decrease of particle size, which is good for solid–liquid contact. However, the slightly lower yield observed with smaller size of particles could be due to the particles staying at the surface of the solvent during extraction, thereby limiting their exposition to ultrasonic waves.34 Therefore, the suitable particle size was 300 μm.
 | ||
| Fig. 1 Effect of particle size (a), acetone volume fraction (b), solid-to-liquid ratios (c), temperature (d), time (e), and power (f) on yield. | ||
:10, temperature is 50 °C, time is 30 min, and power is 240 W. The yield of DCP increased with the increase of acetone volume fraction firstly. The yield reached a maximum when the volume fraction of acetone was 70%, and then gradually decreased with the increase of acetone volume fraction. This may be attributed to the polarity of the solvent varies with the volume fraction of acetone. The pigment solubility is enhanced when the polarity of solvent is most similar to the polarity of DCP.35 Thus, 70% (v/v) was chosen as the optimum volume fraction.:5, 1:10, 1:15, 1:20, 1:25, and 1:30 g mL−1) while the other factors were as follows: particle size 300 μm, acetone volume fraction 70%, temperature 50 °C, time 30 min, and power 240 W. As shown in Fig. 1c, the yield increased with the increase of solvent volume, then changed little after the solid–liquid ratio exceeded 1:10. This was likely due to the reduction in viscosity as solvent volume increased, as well as the increased cavitation and accelerated dissolution of the target component. Tannins were more likely to be oxidized when they were sufficiently diluted. This trend was previously observed in the extraction of phenolic compounds from Euryale ferox seed shells.36 Thus, we selected a solid–liquid ratio of 1:10.:10, time 30 min, and power 240 W. The results indicated a linear effect on the yield of pigment from 20 to 50 °C. The yield reached a maximum at 50 °C, then gradually decreased with the increase of temperature. Solubility and diffusivity of solid from the plant material accelerated with the increase of temperature, which in turn promoted cavitation and maximized extraction yield.37,38 When temperature is too high, the dissolution of active components would be affected by lower cavitation and higher solution viscosity owing to increasing dissolution of polysaccharides and other components. As a result, the suitable temperature was 50 °C.:10, temperature 50 °C, and power 240 W. It was clear that 30 min was the optimal time for extraction. A long extraction time enhances the ultrasonic effects on Dioscorea cirrhosa. The breakup of bubbles on the surface of micro-jets destroys plant structure, allowing solvent to permeate the plant matrix, which attributes to the exudation of active ingredients.39,40 However, the exposure of pigments to ultrasonic waves for a longer period destroys the pigment structure, resulting in lower extraction yield. Therefore, 30 min was chosen as the optimal time.:10, temperature 50 °C, and time 30 min. Fig. 1f indicates a linear effect on DCP yield as it ranged from 120 W to 240 W, while the yield did not change significantly with the increase of power. A possible explanation is that ultrasound waves increased the number of cavitation bubbles. The collapse of these bubbles produces high shear forces that damage cell wall, improve solvent penetration and accelerate the exudation of active ingredients.41–43 There was a sharp increase in cavitation bubbles when the power increased above 240 W, which negatively influenced the efficiency of ultrasound energy transmitted into the medium, reducing the extraction yield.44 Therefore, the suitable ultrasonic power was 240 W.Optimization of the procedure by RSM
| Levels | Factors | ||
|---|---|---|---|
| Acetone volume fraction X1/% | Time X2/min | Temperature X3/°C | |
| −1 | 60 | 20 | 40 |
| 0 | 70 | 30 | 50 |
| 1 | 80 | 40 | 60 |
| Run | Variable levels | DCP yield/% | |||
|---|---|---|---|---|---|
| X1 | X2 | X3 | Observed | Predicted | |
| 1 | 1 | 1 | 0 | 31.38 | 31.46 |
| 2 | 0 | 0 | 0 | 32.76 | 32.36 |
| 3 | 0 | 1 | 1 | 29.21 | 28.80 |
| 4 | 1 | 0 | −1 | 28.47 | 28.40 |
| 5 | 0 | 1 | −1 | 23.87 | 23.85 |
| 6 | −1 | −1 | 0 | 26.55 | 26.46 |
| 7 | 0 | 0 | 0 | 32.89 | 32.36 |
| 8 | 0 | 0 | 0 | 31.96 | 32.36 |
| 9 | 0 | −1 | −1 | 21.27 | 21.67 |
| 10 | 0 | −1 | 1 | 30.47 | 30.49 |
| 11 | 1 | −1 | 0 | 28.46 | 28.12 |
| 12 | 1 | 0 | 1 | 30.24 | 30.56 |
| 13 | −1 | 0 | 1 | 30.46 | 30.53 |
| 14 | 0 | 0 | 0 | 31.45 | 32.36 |
| 15 | −1 | 1 | 0 | 23.26 | 23.60 |
| 16 | 0 | 0 | 0 | 32.72 | 32.36 |
| 17 | −1 | 0 | −1 | 19.23 | 18.91 |
| Y = 32.36 + 2.38x1 + 0.12x2 + 3.44x3 + 1.55x1x2 − 2.37x1x3 − 0.97x2x3 − 2.02x12 − 2.92x22 − 3.23x32 | (7) |
| Source | Sum of squares | DF | Mean square | F-Value | p-Value |
|---|---|---|---|---|---|
| Model | 283.94 | 9 | 31.55 | 93.93 | <0.0001 |
| X1 | 45.30 | 1 | 45.30 | 134.88 | <0.0001 |
| X2 | 0.12 | 1 | 0.12 | 0.35 | 0.5749 |
| X3 | 94.76 | 1 | 94.76 | 282.13 | <0.0001 |
| X1X2 | 9.62 | 1 | 9.62 | 28.63 | 0.0011 |
| X1X3 | 22.39 | 1 | 22.39 | 66.65 | <0.0001 |
| X2X3 | 3.73 | 1 | 3.73 | 11.12 | 0.0125 |
| X12 | 17.24 | 1 | 17.24 | 51.34 | 0.0002 |
| X22 | 35.93 | 1 | 35.93 | 106.98 | <0.0001 |
| X32 | 43.97 | 1 | 43.97 | 130.91 | <0.0001 |
| Residual | 2.35 | 7 | 0.34 | — | — |
| Lack of fit | 0.80 | 3 | 0.27 | 0.68 | 0.6070 |
| Pure error | 1.55 | 4 | 0.39 | — | — |
| Cor. total | 286.29 | 16 | — | — | — |
| R2 | 0.9918 | — | — | — | — |
| Adj-R2 | 0.9812 | — | — | — | — |
| RMSEP | 0.3716 | — | — | — | — |
| ADD/% | 1.0564 | — | — | — | — |
| CV/% | 2.03 | — | — | — | — |
The suitability and significance of the model equation are mainly related to p-values of model, the determination coefficient (R2), the adjusted coefficient of determination (Radj2), the coefficient of variation (CV), root mean square error of prediction (RMSEP) and absolute average deviation (AAD). Table 3 shows that the model is significant with p < 0.0001 < 0.05 and adequate with satisfactory R2 values.16 The closer the value of R2 is to 1, the better the experimental model fits the real data.48 The value of the determination coefficient (R2) was 0.9918, which implied that 99.18% of the variations could be explained by the fitted model. Meanwhile, the adjusted determination coefficient (Radj2 = 0.9812) and determination coefficient (R2 = 0.9918) values for the model did not differ greatly, indicating a high degree of correlation between the observed values and predicted values.49 Moreover, the failure in correctness was tested by the coefficient of variation (CV). Smaller CV values indicates better reproducibility. In this study, the value of CV was 2.03%, indicating better reliability of the experimental values. In addition, the p-value of the lack of fit (0.6070 > 0.05), the values of RMSEP (0.3716) and ADD (1.0564) implied the suitability of the model.25,50 At the same time, the observed values under different experimental conditions differ slightly from the predicted values in Table 2. The results indicated that the model could well predict the DCP extraction from Dioscorea cirrhosa.
In addition, we selected the following two experimental conditions to verify the applicability of the model equation.
(1) 70% acetone, time 30 min and temperature 50 °C (X1 = 0, X2 = 0, X3 = 1), the predicted yield of DCP is 32.57%. Under the condition, three parallel experiments were carried out, and the observed value of DCP yield is 31.65%.
(2) 80% acetone, time 40 min and temperature 60 °C (X1 = 1, X2 = 1, X3 = 1), the predicted value of DCP yield is 28.34%. Under the condition, three parallel experiments were carried out, and the observed value of DCP yield is 27.36%.
Under the two conditions, the observed values of DCP yield differ slightly from the predicted value, which are within an acceptable range. Therefore, the equation is suitable for our research.
Smaller p-values and greater F-values indicate that the corresponding variables are more significant. According to the Table 3, the p-values of temperature and acetone volume fraction were less than 0.0001, which indicated that these two factors had a significant effect on the extraction yield of DCP.
Fig. 2 shows the Pareto chart analysis. The Pareto analysis gives more significant information to interpret the results. In fact, this analysis calculates the percentage effect of each factor on the response according to the F-value of each factor. The result showed that temperature (X3, 34.70%) was the most important factor affecting the extraction yield of DCP, and the effects of the independent variable and their interactions were ranked as X3 > X1 > X32 > X22 > X1X3 > X12 > X1X2 > X2X3 ≫ X2. Considering the change of temperature will lead to the greater change of DCP yield, temperature should be determined first in the extraction process.
 | ||
| Fig. 2 Pareto chart of the percentage effect of each factor on DCP yield (X1 = acetone volume fraction, X2 = time, X3 = temperature). | ||
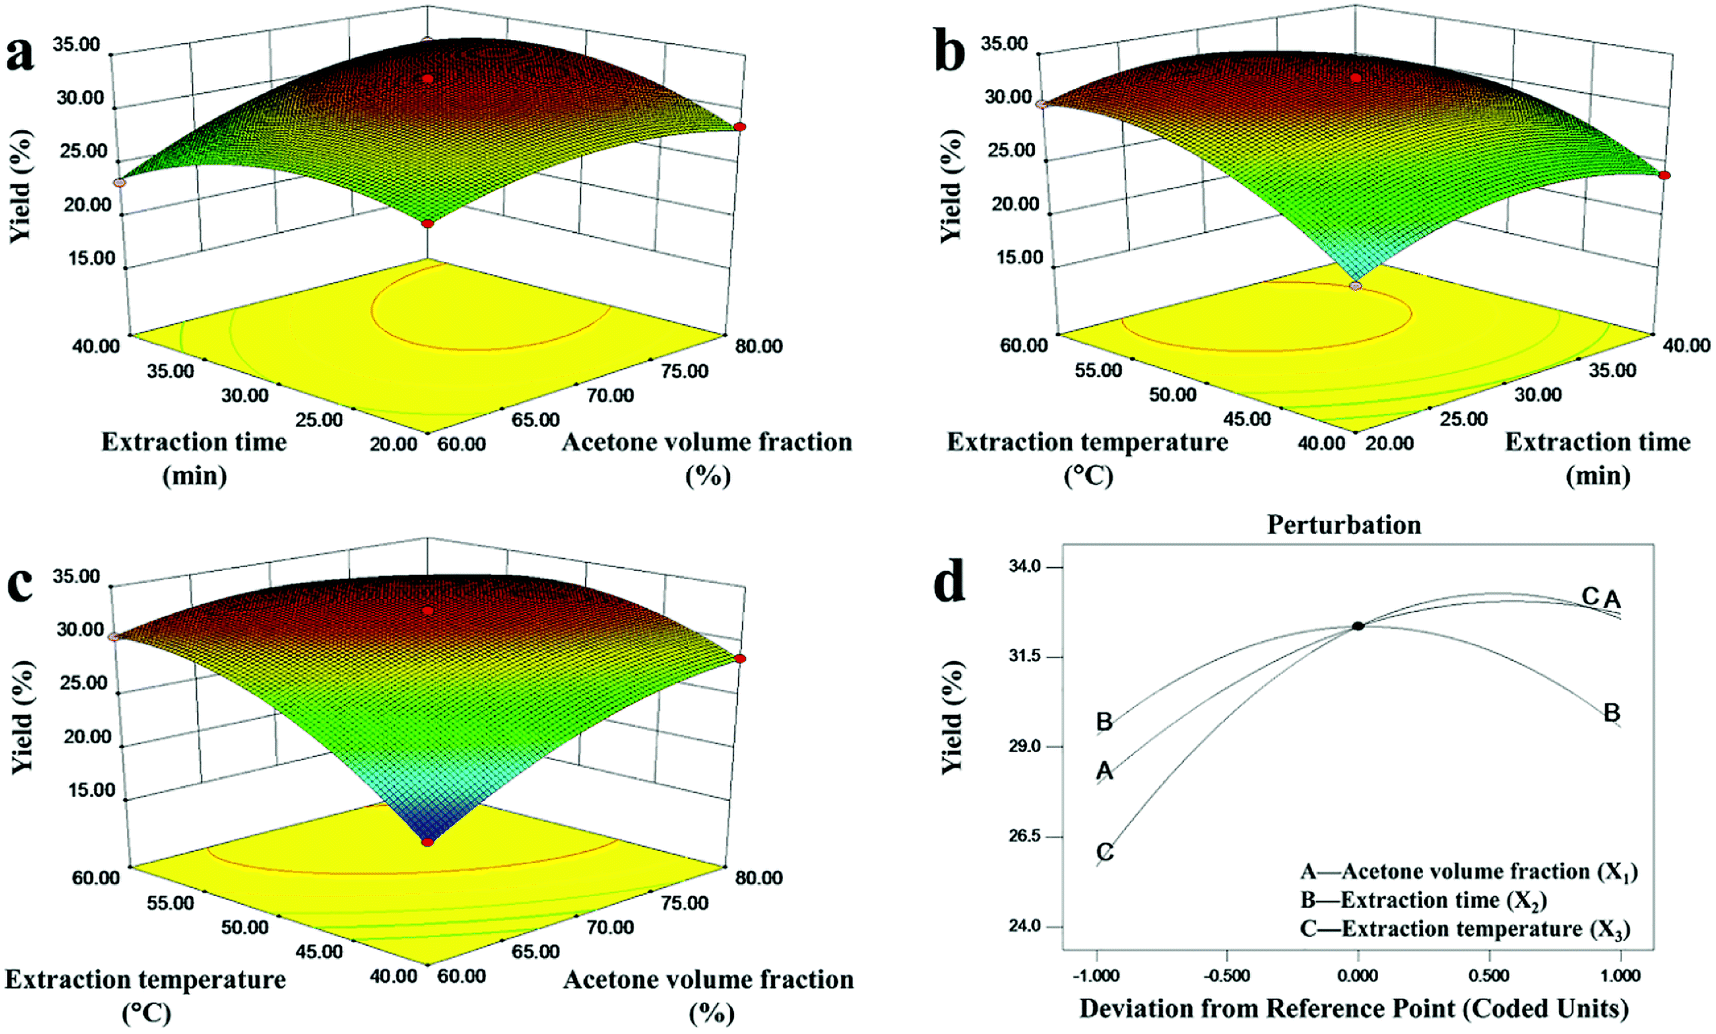 | ||
| Fig. 3 Response surface plots showing the interactive effects of process variables on the DCP yield: (a) time and acetone volume fraction, (b) temperature and extraction time, (c) temperature and acetone volume fraction, and (d) perturbation. | ||
Fig. 3a shows the mutual interaction between extraction time and acetone volume fraction on the yield of DCP when the temperature was fixed at 50 °C, whereas the relationship between extraction time and extraction temperature is shown in Fig. 3b. As observed, the yield increased initially and then decreased with the increase of the two parameters. The mutual interaction of extraction time and acetone volume fraction, and the mutual interaction of extraction time and extraction temperature, were significant (p < 0.05). Meanwhile, the DCP yield was little affected by changes in extraction time within the ranges tested, which also agreed with the results in Table 3. The perturbation graph of these three variables is shown in Fig. 3d, and acetone volume fraction, extraction time, and extraction temperature here corresponded to A, B, and C on the perturbation graph, respectively. It clearly showed that time did not have a significant impact on DCP yield, while temperature and acetone volume fraction affected DCP extraction significantly. Moreover, a longer period of time, higher temperature and higher acetone volume fraction could lead to a decrease in DCP yield, as indicated by the negative coefficient in the fitting equation shown in eqn (7).
Fig. 3c represents the relationship between extraction temperatures and acetone volume fraction when time was fixed at 30 min. Extraction yield increased rapidly to its maximum as both extraction temperature and acetone volume fraction initially increased, but decreased slightly thereafter. DCP yield is greatly affected by temperature and acetone volume fraction when the time is fixed, which resulted in an obvious convex response surface in Fig. 3c. The obvious convex response surface suggested that there was a highly significant interaction between the two variables. Meanwhile the shapes of the contour plots, elliptical or circular, indicate whether the interactions between the corresponding variables are significant or not.52 An elliptical contour plot means the interactions between the variables are significant while a circular contour plot means otherwise.53 As shown in Fig. 3, the shapes of the contour plots in Fig. 3a and b were more circular, while the shape of the contour plots in Fig. 3c was elliptical. The result showed that temperature and acetone volume fraction had the largest interaction effect on DCP yield, which was in agreement with the result of ANOVA analysis in Table 3 (X1X3 has the lowest p-value and highest F-value compared to X1X2 and X2X3). Therefore, we should consider the interaction between temperature and acetone except the effect of temperature in the ultrasonic-assisted extraction process of DCP.
As a result, the derived optimal values were as follows: 73.88% acetone, time 30.61 min, and temperature 53.82 °C; the maximum predicted yield of DCP was 33.48%. In order to operate conveniently, the experiments were performed in the following conditions: acetone volume fraction 74%, time 31 min, and temperature 54 °C. The maximum yield of DCP (32.27%) agreed well with the predicted one, indicating that the model fits the experiments.
Structural characterization of DCP
After purification, the acetone-soluble fractions 13–28 were brown, indicating that these eluates contained tannins.54 After UV analysis, the acetone-soluble fractions with the same or similar peaks were collected and mixed to obtain component 1 (fractions 13–20) and 2 (fractions 21–28). The UV spectral characteristics of component 1 and 2 are shown in Fig. S1a and b.† As observed, the UV-vis spectra of component 1 is unimodal and corresponded to the characteristic of condensed tannins. The concentration of condensed tannins in component 1 was higher, as measured by absorbance at 321 nm. Therefore, component 1 was selected for the subsequent characterization experiment.The FT-IR spectra of DCP is shown in Fig. 4a. The intense and broad peak at 3413 cm−1 denoted O–H stretching vibrations indicating that the O–H of the molecule exists in hydrogen-bonded form. The absorption bands at 1440, 1521, and 1608 cm−1 are associated with the stretching vibrations of aromatic rings. The band at 1283 and 1106 cm−1 indicated the Ar–O–C stretching vibrations. Thus, the FT-IR of DCP demonstrated that the main component of DCP is condensed tannins. The diagnostic peak at 767 cm−1 indicated that the major building block is cis-isomer.
 | ||
| Fig. 4 Structural characterization of DCP: (a) FT-IR spectra of DCP, (b) MALDI-TOF MS spectra of condensed tannins in DCP, and (c) GPC of DCP before and after purification. | ||
MALDI-TOF MS has been widely used to characterize various condensed tannins.55 Fig. 4b shows MALDI-TOF mass spectra of the condensed tannins in DCP. The mass spectra in the range of 700 to 2000 Da revealed intense peaks at 753.1, 888.9, 1040.7, 1177.1, 1329.2, 1465.1, and 1753.3 Da. The mass of the detected main repetition unit matched the 288 Da molecular mass of an (epi) catechin unit, which indicated that DCP is composed of condensed tannins.
The condensed tannins from DCP had different polymer chain lengths, varying from trimer to hexamer. A few peaks were followed by mass signals at a distance of 152 or 136 Da. The 152 Da mass is matched with the addition of one galloyl group at the heterocyclic C-ring, as in (epi) gallocatechin gallate.56 The 136 Da mass does not correspond to any known building block or moieties in tannin oligomers. Nevertheless, the main component of DCP was demonstrated, and the structure of condensed tannins from DCP was thus successfully characterized by MALDI-TOF MS.
Fig. 4c shows GPC chromatograms of DCP before and after purification. GPC analysis of the sample indicated that DCP contains substances of different molecular weight. After purification, there was no obvious change in the high molecular weight fractions, whereas relatively low molecular weight fractions were removed, as demonstrated in other reports.57 This confirms the difficulty of obtaining high-purity of tannins using only a Sephadex LH-20 column.
Effect of factors on the stability of DCP
 | ||
| Fig. 5 Effects of physicochemical factors on DCP stability: (a) pH, (b) temperature, (c) light, (d) metal ions, and (e) reductant–oxidant. | ||
Conclusions
On the basis of single-factor experiments, acetone volume fraction, temperature and time variables were selected for RSM experiments. Among the three dependent variables, the impact of variables on DCP yield decreased in the following order: temperature, acetone volume fraction and time. The optimal conditions for DCP extraction were as follows: acetone volume fraction 74%, extraction time 31 min, and temperature 54 °C. Under these optimal conditions, the experimental yield of DCP was 32.27%, which closely agrees with the predicted value (33.48%). After purification using a Sephadex LH-20 column and chemical characterization by UV, FT-IR, MALDI-TOF MASS and GPC, condensed tannins with catechin monomer units were detected in DCP. In addition, pH, temperature, and light all had an impact on DCP stability. DCP was stable at the pH range of 3 to 9 and temperature below 80 °C. Although light had little impact on DCP stability, prolonged illumination should be avoided. K+, Al3+, Ca2+, Cu2+, Mg2+, and Zn2+ maintained the stability of DCP, but Fe2+, Fe3+, and Ti4+ decreased its stability. DCP showed good anti-reduction and poor anti-oxidization properties. This study improved the ultrasonic-assisted extraction of DCP, providing the basic data and theoretical guidance for the application of DCP, and promoting the application of DCP in food, medicine and cosmetics areas. Further research is needed to optimize this procedure to the capable of industrial production as standard.Conflicts of interest
There are no conflicts to declare.Acknowledgements
This work was financially supported by Science and Technology Project, China (20141205124007).Notes and references
- T. T. Yang, J. P. Guan, G. Chen and R. C. Tang, Ind. Crops Prod., 2018, 111, 117–125 CrossRef CAS.
- Y. J. Liu, S. Ahmed, B. Liu, Z. Y. Guo, W. J. Huang, X. J. Wu, S. H. Li, J. J. Zhou, Q. Y. Li and C. L. Long, J. Ethnobiol. Ethnomed., 2014, 10, 1–9 CrossRef PubMed.
- W. C. Chang and F. L. Hsu, Prostaglandins, Leukotrienes Essent. Fatty Acids, 1989, 38, 181–188 CrossRef CAS.
- Z. H. Huang and G. Z. Fang, Biomass Chem. Eng., 2005, 39, 39–43 CAS.
- F. Hsu, G. Nonaka and I. Nishioka, Chem. Pharm. Bull., 1985, 33, 3293–3298 CrossRef CAS.
- J. F. Peng, R. Z. Fan and X. F. Li, Food Drug, 2014, 16, 106–109 CAS.
- X. He, M. B. Ma, G. Lu, Z. H. Hu and W. L. Zhou, J. Text. Res., 2015, 36, 63–68 CAS.
- J. Liao, B. Qu, D. Liu and N. Zheng, Ultrason. Sonochem., 2015, 27, 110–116 CrossRef CAS PubMed.
- W. Huang, A. Xue, H. Niu, Z. Jia and J. Wang, Food Chem., 2009, 114, 1147–1154 CrossRef CAS.
- Y. Ma, X. Ye, Y. Hao, G. Xu, G. Xu and D. Liu, Ultrason. Sonochem., 2008, 15, 227–232 CrossRef CAS PubMed.
- R. Minjares-Fuentes, A. Femenia, M. C. Garau, M. G. Candelas-Cadillo, S. Simal and C. Rosselló, Carbohydr. Polym., 2016, 138, 180–191 CrossRef CAS PubMed.
- Q. Q. Zhou and J. X. Chen, Prog. Text. Sci. Technol., 2010, 6, 23–26 Search PubMed.
- Y. Z. Luo and J. R. Li, Technol. Dev. Chem. Ind., 2012, 41, 21–23 CAS.
- M. A. Bezerra, R. E. Santelli, E. P. Oliveira, L. S. Villar and L. A. Escaleira, Talanta, 2008, 76, 965–977 CrossRef CAS PubMed.
- M. Yolmeh and S. M. Jafari, Food Bioprocess Technol., 2017, 10, 413–433 CrossRef CAS.
- K. Ghafoor, Y. H. Choi, J. Y. Jeon and I. H. Jo, J. Agric. Food Chem., 2009, 57, 4988–4994 CrossRef CAS PubMed.
- N. Ilaiyaraja, K. Likhith, G. S. Babu and F. Khanum, Food Chem., 2015, 173, 348–354 CrossRef CAS PubMed.
- B. He, L. L. Zhang, X. Y. Yue, J. Liang, J. Jiang, X. L. Gao and P. X. Yue, Food Chem., 2016, 204, 70–76 CrossRef CAS PubMed.
- K. Zhong and Q. Wang, Carbohydr. Polym., 2010, 80, 19–25 CrossRef CAS.
- S. L. C. Ferreira, R. E. Bruns, H. S. Ferreira, G. D. Matos, J. M. David, G. C. Brandão, E. G. P. da Silva, L. A. Portugal, P. S. dos Reis, A. S. Souza and W. N. L. dos Santosc, Anal. Chim. Acta, 2007, 597, 179–186 CrossRef CAS PubMed.
- C. H. Dong, X. Q. Xie, X. L. Wang, Y. Zhan and Y. J. Yao, Food Bioprod. Process., 2009, 87, 139–144 CrossRef.
- S. A. Heleno, P. Diz, M. A. Prieto, L. Barros, A. Rodrigues, M. F. Barreiro and I. C. F. R. Ferreira, Food Chem., 2016, 197, 1054–1063 CrossRef CAS PubMed.
- M. L. Price, S. Van Scoyoc and L. G. Butler, J. Agric. Food Chem., 1978, 26, 1214–1218 CrossRef CAS.
- K. P. Y. Shak and T. Y. Wu, Ind. Crops Prod., 2015, 76, 1169–1178 CrossRef CAS.
- P. Ghorbannezhad, A. Bay, M. Yolmeh, R. Yadollahi and J. Y. Moghadam, Desalin. Water Treat., 2016, 57, 26916–26931 CrossRef CAS.
- D. H. Strumeyer and M. J. Malin, J. Agric. Food Chem., 1975, 23, 909–914 CrossRef CAS PubMed.
- W. M. Chai, Y. Shi, H. L. Feng, L. Qiu, H. C. Zhou, Z. W. Deng, C. L. Yan and Q. X. Chen, J. Agric. Food Chem., 2012, 60, 5013–5022 CrossRef CAS PubMed.
- X. Zhao and X. Li, Trans. Chin. Soc. Agric. Eng., 2014, 30, 287–292 CAS.
- Y. J. Huang, B. Wu, P. Xiang, Y. M. Lin, C. S. Ji and C. Xiang, J. Xiamen Univ., Nat. Sci., 2005, 44, 32–36 Search PubMed.
- Z. Shi, X. Zhu and H. Zhang, J. Pharm. Biomed. Anal., 2007, 44, 867–873 CrossRef CAS PubMed.
- C. Xu, Y. Zhang, J. Wang and J. Lu, Food Chem., 2010, 122, 688–694 CrossRef CAS.
- A. K. Landbo and A. S. Meyer, J. Agric. Food Chem., 2001, 49, 3169–3177 CrossRef CAS PubMed.
- A. S. Meyer, S. M. Jepsen and N. S. Sørensen, J. Agric. Food Chem., 1998, 46, 2439–2446 CrossRef CAS.
- M. K. Khan, M. Abert-Vian, A. S. Fabiano-Tixier, O. Dangles and F. Chemat, Food Chem., 2010, 119, 851–858 CrossRef CAS.
- M. A. Rostagno, M. Palma and C. G. Barroso, J. Chromatogr. A, 2003, 1012, 119–128 CrossRef CAS PubMed.
- Y. Liu, S. Wei and M. Liao, Ind. Crops Prod., 2013, 49, 837–843 CrossRef CAS.
- J. P. Maran and B. Priya, Carbohydr. Polym., 2015, 115, 732–738 CrossRef CAS PubMed.
- Z. Yang and W. Zhai, Innovative Food Sci. Emerging Technol., 2010, 11, 470–476 CrossRef CAS.
- R. Sun and J. Tomkinson, Ultrason. Sonochem., 2002, 9, 85–93 CrossRef CAS PubMed.
- K. Vilkhu, R. Mawson, L. Simons and D. Bates, Innovative Food Sci. Emerging Technol., 2008, 9, 161–169 CrossRef CAS.
- P. R. Gogate and A. M. Kabadi, Biochem. Eng. J., 2009, 44, 60–72 CrossRef CAS.
- S. Hemwimol, P. Pavasant and A. Shotipruk, Ultrason. Sonochem., 2006, 13, 543–548 CrossRef CAS PubMed.
- B. Jaki, S. Franzblau, S. Cho and G. Pauli, J. Pharm. Biomed. Anal., 2006, 41, 196–200 CrossRef CAS PubMed.
- J. P. Maran, B. Priya and C. V. Nivetha, Ind. Crops Prod., 2015, 63, 182–189 CrossRef CAS.
- X. Fang, J. Wang, Y. Wang, X. Li, H. Zhou and L. Zhu, Sep. Purif. Technol., 2014, 138, 55–64 CrossRef CAS.
- C. L. Ye and C. J. Jiang, Carbohydr. Polym., 2011, 84, 495–502 CrossRef CAS.
- V. V. Quan, V. T. Nguyen, T. T. Dang, D. J. Bhuyan, C. D. Goldsmith, E. Sadeqzadeh, C. J. Scarlett and M. C. Bowyer, Ind. Crops Prod., 2015, 63, 197–202 CrossRef.
- M. H. Majd, A. Rajaei, D. S. Bashi, S. A. Mortazavi and S. Bolourian, Ind. Crops Prod., 2014, 57, 195–202 CrossRef.
- J. Chen, T. Zhang, B. Jiang, W. Mu and M. Miao, Carbohydr. Polym., 2012, 87, 40–45 CrossRef CAS.
- F. Dahmoune, B. Nayak, K. Moussi, H. Remini and K. Madani, Food Chem., 2015, 166, 585–595 CrossRef CAS PubMed.
- G. Sharmila, V. Nikitha, S. Ilaiyarasi, K. Dhivya, V. Rajasekar, N. M. Kumar, K. Muthukumaran and C. Muthukumaran, Ind. Crops Prod., 2016, 84, 13–21 CrossRef CAS.
- D. Luo, Carbohydr. Polym., 2008, 71, 544–549 CrossRef CAS.
- Y. L. Yan, C. H. Yu, J. Chen, X. X. Li, W. Wang and S. Q. Li, Carbohydr. Polym., 2011, 83, 217–224 CrossRef CAS.
- A. Jayanegara, G. Goel, H. P. Makkar and K. Becker, Anim. Feed Sci. Technol., 2015, 209, 60–68 CrossRef CAS.
- A. Duval and L. Averous, J. Agric. Food Chem., 2016, 64, 1751–1760 CrossRef CAS PubMed.
- S. Bianchi, A. N. Gloess, I. Kroslakova, I. Mayer and F. Pichelin, Ind. Crops Prod., 2014, 61, 430–437 CrossRef CAS.
- F. Melone, R. Saladino, H. Lange and C. Crestini, J. Agric. Food Chem., 2013, 61, 9316–9324 CrossRef CAS.
Footnotes |
| † Electronic supplementary information (ESI) available. See DOI: 10.1039/c8ra07455k |
| ‡ These authors contributed equally to the work. |
| This journal is © The Royal Society of Chemistry 2019 |