 Open Access Article
A highly selective and sensitive H2S sensor at low temperatures based on Cr-doped α-Fe2O3 nanoparticles
Dongyang Xue ,
Rui Zhou,
Xiaoping Lin,
Xiaochuan Duan
 ,
Qiuhong Li* and
Taihong Wang
Pen-Tung Sah Institute of Micro-Nano Science and Technology, Xiamen University, Xiamen, China. E-mail: liqiuhong@xmu.edu.cn; Fax: +86-0592-2187196; Tel: +86-0592-2187198
First published on 31st January 2019
Abstract
Cr-doped α-Fe2O3 nanoparticles were synthesized by a low-cost and environmentally friendly hydrothermal route. Their gas sensing properties were investigated and the sensor showed high sensitivity and selectivity to H2S gas. Different Cr doping levels from 0 to 8.0 wt% were studied, and the sensor of 4.0 wt% Cr-doped α-Fe2O3 showed the largest response, with a response of 213 to 50 ppm H2S at 100 °C. The incorporation of Cr ions within α-Fe2O3 nanocrystals increases the specific surface area, and promotes the oxidation of H2S and oxygen adsorption in the air. Thus, the doping of Cr into α-Fe2O3 nanostructures would be a promising method for designing and fabricating high performance H2S gas sensors.
1. Introduction
Recently, atmospheric environmental pollution has become one of the most serious problems that all the countries of the earth are facing.1 Many steps have been taken to resolve it, such as enhancing control over pollutant discharge, researching high-performance catalysts for the catalytic conversion of auto exhausts, developing new technologies for the monitoring of toxic gases, enhancing the environmental awareness of people etc. Among these, controlling and monitoring poisonous gases from sources of pollution are quite important so far. Accordingly, the development of gas sensors with enhanced sensitivity and selectivity is very urgent and important.Hydrogen sulfide (H2S) is a colorless, highly flammable and extremely toxic gas with a characteristic foul odour of rotten eggs.2–5 Furthermore, it is also produced in large quantity from industrial activities and places such as petroleum natural gas drilling and refining, wastewater treatment, coke ovens, tanneries, kraft paper mills, and landfills.6,7 Hence, it is necessary to detect concentrations of H2S in work environments such as oil and natural gas industries. To date, much effort has been made to prepare a number of gas-sensing nanomaterials, such as Fe2O3,8–13 WO3,14 SnO2,15 CuO,16 ZnO,3 and some compounds.17–19 Among them, α-Fe2O3 is an excellent potential H2S-sensitive material.
In recent years, α-Fe2O3 has attracted great attention for its distinctive sensing properties toward H2S gas. Despite some exciting results obtained, the development of more highly sensitive and markedly selective gas sensors based on α-Fe2O3 nanostructures remains a challenge. Up to now, many efforts have been taken such as heterostructure constructing, element doping, and decorating in order to improve its performance.10,20,21 Among these methods, element doping has been turned out to be a very simple and feasible method. Chromium, as a member of transition metals, exhibits a wide range of possible oxidation states. And it is a promising candidate for efficient doping materials in sensor applications. There have been some reports showing the performance of Cr dopant in ammonia sensors,22–24 NO2 sensors,25,26 acetone sensors,27 oxygen sensor,28 and so on. Herein we report a facile one-step hydrothermal method to synthesize Cr-doped α-Fe2O3 nanoparticles, for optimizing the gas sensing properties. At 100 °C, the sensor using 4 wt% Cr-doped α-Fe2O3 displayed the highest response toward hydrogen sulfide gases with a low cross-selectivity and short response time. The enhanced sensing response can be attributed to the increases in surface area and catalysis effect by Cr doping.
2. Experimental details
2.1 Synthesis of Cr-doped α-Fe2O3
All of the reagents used in the experiments were of analytical grade without further purification. Fe(NO3)3·9H2O and Cr(NO3)3·9H2O were used as iron and chromium sources, respectively. A series of Cr-doped α-Fe2O3 (0.0, 2.0, 4.0, 6.0, and 8.0 wt%) nanoparticles were synthesized by one-step hydrothermal reaction. In a typical experiment, Fe(NO3)3·9H2O (0.8077 g), Urea (0.5 g) and Cr(NO3)3·9H2O (0.0168 g) were put into 35 ml of distilled water to form homogeneous solution under vigorous stirring. Subsequently 300 μl ammonia was introduced into above solution by magnetic stirring. The precursor solution was continuously stirred at room temperature to obtain a homogeneous mixture. Afterwards, the solution was transferred to a Teflon-lined stainless steel autoclave with a capacity of 50 ml and maintained at 180 °C for 12 h. After the hydrothermal procedure, the autoclave naturally cooled to room temperature. The solid products were subjected to centrifugation, rinsed alternately with distilled water and ethanol several times, and dried at 70 °C in air for 24 h. Finally, the dry precipitates were annealed in a muffle furnace at 500 °C for 2 h in air.2.2 Sensor fabrication and sensing measurements
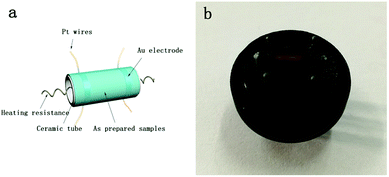
In a typical experiment, a small amount of the sensing material powder was mixed with terpineol followed by 2 h grinding to form a paste, then coated uniformly onto a ceramic tube. After the coating was air dried, the α-Fe2O3-coated Al2O3 microtube was fixed to a special pedestal with six poles by welding four Pt electrodes to four poles of the pedestal. A Ni–Cr heating coil was then inserted through the Al2O3 microtube, and its two ends were welded to the other two poles of the pedestal. A schematic representation and a micrograph image of gas sensor were shown in Fig. 1. The measurements of hydrogen sulfide gases sensing were conducted on a ZhongKe NS-4003 Smart Sensor Analyser (Beijing ZhongKe Micro-Nano Networking Technology Co., Ltd.). The relative humidity at room temperature was about 52% during the whole experiment. The sensor response is defined as response = Ra/Rg, where Ra is the resistance in air and Rg is the measured resistance in the presence of the test gas. The response time is defined as the period in which the sensor output change reached 90% of the stabilized value, similarly, the recovery time is defined as the time required for the sensor to reach 10% of the initial steady-state value after the sensor was taken out of the test chamber.2.3 Characterization
X-ray powder diffraction (XRD) data of the as synthesized materials were collected on a Philips X'pert pro diffractometer using Cu-Kα radiation at 40 kV and 30 mA. Scanning electron microscopy (SEM) images and EDX data were recorded on a scanning electron microscope (SEM, Zeiss SUPRA 55) equipped with an energy dispersive X-ray Spectroscopy (EDS, Oxford). The transmission electron microscopy images (TEM) were obtained using JEOL JEM-2100. The Raman spectra were performed by using the IDSpec ARCTIC Raman system. X-ray photoelectron spectroscopy (XPS) measurements were performed with a PHI Quantum 200 spectrophotometer with Mg K radiation.3. Results and discussion
3.1 Characterization of sensor material
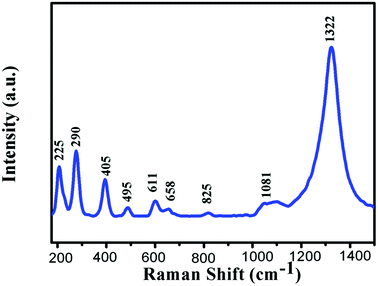
The Raman spectrum of the α-Fe2O3 is presented in Fig. 2. In the range of 200–1500 cm−1, many peaks could be observed, which were located at 225, 290, 405, 495, 611, 658, 825, 1081, and 1322 cm−1, respectively. All these peaks correspond to α-Fe2O3 phase.29,30 The XRD patterns of the pure and Cr-doped α-Fe2O3 samples are shown in Fig. 3a. Clearly, all the diffraction peaks of all the samples could be indexed to the rhombohedral structure of α-Fe2O3 phase (JCPDS file no. 33-0664). No other peaks corresponding to Cr-related compounds were observed in all the XRD patterns of 0–8 wt% Cr-doped α-Fe2O3 samples. In addition, as shown in Fig. 3b, a high angle shift was detected from the (110) peak via comparing the different Cr doping α-Fe2O3. This is due to larger ionic radius of Fe3+ (0.67 Å) as compared to Cr3+ (0.64 Å), which according to Bragg's law shifts the peak position to high diffraction angles. The incorporation of atom with low ionic radius atom results in shrink of unit cell that decreases the lattice parameter and decreases d-spacing thus shifting peak positions to higher angles. Therefore, the substitution of Fe3+ by Cr3+ induced the high angle shift of diffraction peaks, suggesting that Cr element is incorporated into the α-Fe2O3 lattice.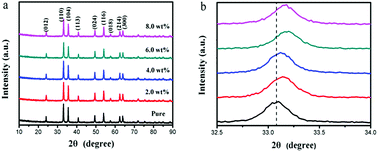 | ||
| Fig. 3 (a) XRD patterns and (b) high-resolution of (110) peak of the pure, 2.0 wt%, 4.0 wt%, 6.0 wt% and 8.0 wt% Cr-doped α-Fe2O3 nanoparticles. | ||
Morphology of the pristine and Cr-doped α-Fe2O3 structures were also discerned by SEM observations. As shown in Fig. 4a, spherical particles coexisted with irregular particle aggregates. As the amount of Cr3+ was increased to 4 wt%, the obtained product consisted of small nanospheres with good monodispersity, as shown in Fig. 4c. However, particle aggregates without an orderly shape were collected when the amount of Cr3+ increased to 8 wt%, as shown in Fig. 4e. α-Fe2O3 nanoparticles can be obtained by using a one-step hydrothermal process at an appropriate concentration of ammonia. And Cr3+ may control the morphology of α-Fe2O3 because of its acid nature.23,31 The detailed mechanism of Cr on Fe2O3 nanoparticle is not clear now and needs further study. The EDS patterns of 4 wt% Cr-doped α-Fe2O3 nanoparticles shown in Fig. 3f indicate that the as-prepared 4 wt% Cr-doped α-Fe2O3 nanoparticles are composed of Fe, O and Cr, where the x-axis represents X-ray energy (in keV) and the y-axis represents the intensity. And it is evident that the peaks associated with chromium in the doped samples confirm the presence of chromium in α-Fe2O3 nanoparticles.
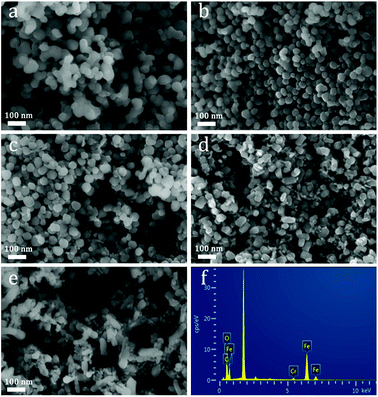 | ||
| Fig. 4 (a–e) Typical SEM images of the pure, 2.0 wt%, 4.0 wt%, 6.0 wt% and 8.0 wt% α-Fe2O3 nanoparticles, (f) the EDX spectrum of the 4.0 wt% α-Fe2O3 nanoparticles. | ||
Microstructures of the as-prepared products were studied by selected area electron diffraction (SAED) and high resolution transmission electron microscopy (HRTEM) characterizations. As shown in Fig. 5a, 4 wt% Cr-doped α-Fe2O3 nanoparticles were observed by low magnification transmission electron microscopy. In the HRTEM images shown in Fig. 5b and c, we found the lattice distances were about 0.368 nm and 0.222 nm, which can be corresponded to the (012) and (113) lattice plane of α-Fe2O3. The diffraction pots in a SAED pattern (Fig. 5d) matched well with (012), (110), (113) and (024) planes of α-Fe2O3.
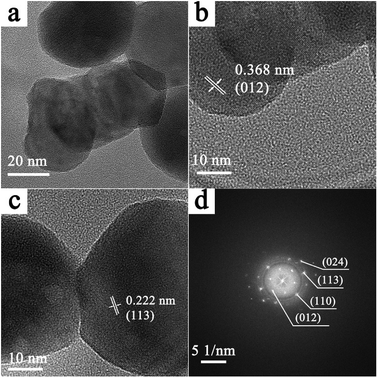 | ||
| Fig. 5 (a) Low magnification TEM image of the 4 wt% Cr-doped α-Fe2O3. (b and c) HRTEM images and (d) SAED pattern of the 4 wt% Cr-doped α-Fe2O3. | ||
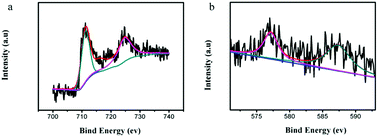
X-ray photoelectron spectroscopy (XPS) was performed to illuminate the surface composition of the studied 4 wt% Cr-doped α-Fe2O3 nanoparticles. The spectra of Fe 2p and Cr 2p are shown in Fig. 6. In Fig. 6a, the bending energies of Fe 2p3/2 and Fe 2p1/2 are 710.7 and 724.3 eV, respectively, which are in good agreement with the literature values of Fe3+ in α-Fe2O3.32–34 The binding energy of Cr 2p3/2 is 577.8 eV and Cr 2p3/2–Cr 2p1/2 binding energy separation is 9.6 eV, that is typical for Cr3+ centers dispersed in an oxide environment (Fig. 6b).35–37
3.2 Gas sensing properties
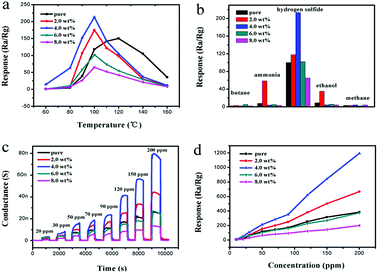
Meanwhile, Fig. 7a shows that the Cr-doped α-Fe2O3 gas sensors achieve a maximum sensitivity at 100 °C, while the pure α-Fe2O3 sensor obtain the maximum sensitivity at 120 °C. The gas responses of the sensors based on the pure, 2.0 wt% 4.0 wt% 6.0 wt% and 8.0 wt% Cr-doped α-Fe2O3 to 50 ppm H2S at 100 °C is 112, 155, 213, 102 and 65, respectively. The result revealed that sensor based on 4.0 wt% Cr-doped α-Fe2O3 showed the highest response to 50 ppm H2S and the value was about two times higher than that of pure α-Fe2O3. According to the above test result, we could surmise that the Cr on sensor would play a crucial role in the governing mechanism. Therefore, further measurements were carried out using this specific composition (4 wt%) and operating temperature (100 °C) to explore the effect of other factors on the sensing properties of Cr-doped α-Fe2O3.
Subsequently, variations in the electrical conductance were measured on α-Fe2O3 nanoparticles. Butane, ammonia, ethanol and methane common gases (50 ppm) used as probe molecules to investigate the cross-sensitivity of the sensor at an operating temperature of 100 °C (Fig. 7b). Compared with the conductance change in response to 50 ppm H2S at 100 °C, the responses of the 4.0 wt% Cr-doped α-Fe2O3 sensor to other gases are negligible. The 2.0 wt% Cr-doped α-Fe2O3 sensor shows a low response to ammonia and ethanol. Consequently, it was concluded that the sensor using as-synthesized 4.0 wt% Cr-doped α-Fe2O3 nanoparticles showed excellent selectivity to H2S as opposed to other test gases.
The concentrations of hydrogen sulfide were varied from 20 to 200 ppm. Transient response curves of the sensor (composed of pure, 2.0 wt%, 4.0 wt%, 6.0 wt%, and 8.0 wt% Cr-doped α-Fe2O3) at the optimal temperature of 100 °C are shown in Fig. 7c. The nearly rectangle-shaped response and recovery curves indicate the excellent hydrogen sulfide response and rapid reaction rate of the sensor. Exposing the sensor to H2S significantly increases conductance until it reaches saturation. After the removal of H2S, the conductance approaches its initial value.
Fig. 7d shows the relationship between the response of the sensor and H2S concentration from 20 to 200 ppm calculated from Fig. 7c. Increasing the concentration accelerates the response. Among them, the response of the sensor based on the 4.0 wt% Cr-doped α-Fe2O3 was apparently higher than the other sensors. The response of Cr-doped Fe2O3 sensors showed almost no saturation with the variation of H2S concentrations between 20 and 200 ppm, indicating a wide response range of the Cr-doped sensor and its possible application in detecting high H2S concentration environment.
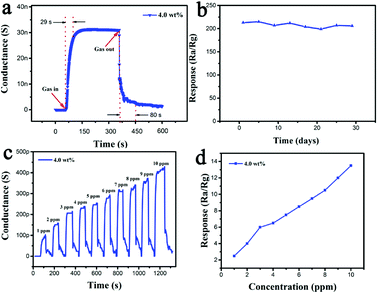
From these, the Cr doping amount of 4.0 wt% was considered as the optimum doping concentration. Then the response and recovery characteristics of the sensor based on 4.0 wt% Cr-doped α-Fe2O3 nanoparticles were investigated to 50 ppm hydrogen sulfide gases at 100 °C. As shown in Fig. 8a, the conductance increased upon exposure to hydrogen sulfide gases, which was consistent with the gas sensing behavior of n-type oxide semiconductor. The response and recovery times of the sensors based on the 4.0 wt% Cr-doped α-Fe2O3 were 29 and 80 s, respectively. Stability of the sensors is also investigated. The 4.0 wt% Cr-doped α-Fe2O3 sensor was stored in air and kept working at 100 °C for subsequent sensing property tests at a level of 50 ppm H2S after aging for 30 days. It can be seen that the sensor presented a nearly constant response to H2S during the test, showing that the sensor exhibited long-term stability (Fig. 8b). We also investigated the detection limit of H2S by the developed sensor. As shown in Fig. 8c, we detected dynamic response curve of sensor based 4 wt% Cr-doped α-Fe2O3 to H2S ranging from 1 ppm to 10 ppm at 100 °C. Fig. 8d showed the relationship between the response of the sensor and H2S concentration from 1 to 10 ppm. The detection of 4 wt% Cr-doped α-Fe2O3 to 1 ppm H2S had the responses of about 2.5. When we tested H2S below 1 ppm at optimal temperature, the sensor did not have response.
A comparison of the sensing performances between the sensor in this work and other H2S sensors based on α-Fe2O3 reported previously is summarized in Table 1. From the table, comprehensively considering the gas response and operating temperature, it is obvious that 4.0 wt% Cr-doped α-Fe2O3 nanoparticles showed a high gas response at a low operating temperature. This was conducive to practical application and energy conservation. Therefore, the sensor based on 4.0 wt% Cr-doped α-Fe2O3 nanoparticles had more superiority than those reported in the literature.
| O2(gas) → O2(ads) | (1) |
| O2(ads) + e− → O2−(ads) | (2) |
| O2−(ads) + e− → 2O−(ads) | (3) |
| O−(ads) + e− → O2− | (4) |
When the α-Fe2O3 sensor is exposed to H2S atmosphere, the surface oxygen ions react with the H2S molecule and release a number of electrons back into the semiconductor, resulting in a decrease in resistance of the sensor. This reaction process may be as eqn (5)
| H2S + 3O2 → H2O + SO2 + 3e− | (5) |
However, α-Fe2O3 presented high catalyst for H2S oxidation, and the dominant product was SO2. Steijns et al. studied the H2S oxidation reaction, they showed that the SO2 formation rate was very slow at low temperatures. It was attributed to the high activation energy of SO2 formation, which would be about 125 kJ mol−1. Whereas the activation energy for sulfur formation was between 8 and 50 kJ mol−1. So, Berben et al. prepared α-Fe2O3-based catalysts, with chromium as additives. It showed good activity and good selectivity, which directly and selectively oxidized H2S with O2 into elemental sulfur.42,43
Fig. 9 shows in a double logarithmic plot the variation of the response of α-Fe2O3 sensor versus H2S concentration. The linear trend can be related to the conductance model limited by the electron transport across the intergranular Schottky barrier24,44 where
| σ ∝ exp(−eVs/kT) | (6) |
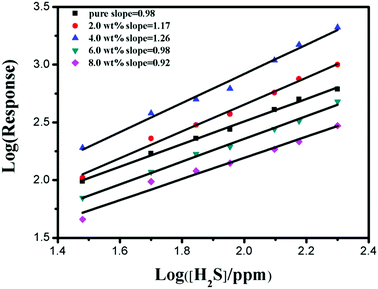 | ||
| Fig. 9 Response variation for the pure, 2.0 wt%, 4.0 wt%, 6.0 wt% and 8.0 wt% Cr-doped α-Fe2O3 nanoparticles. | ||
According to this model, the response of the α-Fe2O3 nanoparticles is explained by using the following equation:45,46
log![[thin space (1/6-em)]](https://www.rsc.org/images/entities/char_2009.gif) σ/σ0 = Ag + β σ/σ0 = Ag + β![[thin space (1/6-em)]](https://www.rsc.org/images/entities/char_2009.gif) log log![[thin space (1/6-em)]](https://www.rsc.org/images/entities/char_2009.gif) Pg Pg
| (7) |
In the case of pristine α-Fe2O3 nanoparticles (Fig. 9), the calculated β value (i.e., the slope of the curve described by eqn (7)) was about 0.98. Differently, 2.0 and 4.0 wt% Cr-doped α-Fe2O3 sensors show β values about 1.17 and 1.26. This can be reasonably ascribed to the presence of Cr element which may give rise to a different sensing mechanism at the microscale level.
Therefore, a mechanism was suggested to explain the excellent gas response of Cr-doped α-Fe2O3. First, when H2S gas flows in, the H2S molecules are oxidized into elemental sulfur and H2O by the Cr3+ catalyst in α-Fe2O3. The adsorption process is as follows (eqn (8)):
 | (8) |
In the meantime, some of the chemisorbed oxygen species reacted with elemental sulfur (eqn (9))
| 1/nSn + 2O2− → SO2 + 2e− | (9) |
The ability of a reacting species to overcome a free energy barrier that is preventing a reaction is commonly modeled by the Arrhenius equation. For most of the chemical reactions, including the primitive reaction and primitive action, the Arrhenius equation gives the dependence of rates, K, of a chemical reaction on the absolute temperature T (in Kelvin) as shown in eqn (10):
K = A![[thin space (1/6-em)]](https://www.rsc.org/images/entities/char_2009.gif) exp(−Ea/RT) exp(−Ea/RT)
| (10) |
This equation shows that the rate constant exponentially increases as activation energy (Ea) decreases. For the pristine α-Fe2O3 sensor, higher activation energy is required for produce SO2. Therefore, the operating temperature of the reaction is higher. In the presence of Cr3+, the α-Fe2O3 sensor provides a reaction path with lower activation energy, providing a high response at a low temperature. For these reasons, the working temperature of the Cr-doped α-Fe2O3 sensors can be reduced to low temperature while the sensitivity was still kept high.
Finally, the further increasing of Cr doping content, the size of α-Fe2O3 gas sensing material became larger and the agglomeration of the nanoparticles became more obvious (Fig. 4d and e), which would reduce surface-to-volume ratio and efficient diffusion of the gas molecules. This may be the reason for the poor performance of 6.0 wt%, and 8.0 wt% Cr-doped α-Fe2O3 sensors.
4. Conclusions
In summary, we have developed a simple one-step hydrothermal method for the synthesis of Cr-doped α-Fe2O3 nanoparticles with different doping levels. The results of X-ray diffraction, EDS and XPS data proved that Cr ion successfully entered into the crystal lattice of α-Fe2O3 without deteriorating the original crystal structure. Furthermore, an appropriate amount of Cr-doped α-Fe2O3 (4.0 wt% Cr-doped α-Fe2O3 sensor in this work) display, upon exposure to H2S, outstanding sensing properties even at relatively low operating temperature, and the sensitivity resulted as much higher than that of the pristine sensor. This behaviour could be attributed to the nanometer size effect and catalysis effect. Hence, we can confirm that the doping of Cr into α-Fe2O3 is a promising strategy for improving the gas sensing performance of the α-Fe2O3 based gas sensor.Conflicts of interest
There are no conflicts to declare.Acknowledgements
This work was partly supported by the National Natural Science Foundation of China (Grant No. 61574118), and the Key Project of Science and Technology Plan of Fujian Province (Grant No. 2015H0038).Notes and references
- C. K. Chan and X. Yao, Atmos. Environ., 2008, 42, 1–42 CrossRef CAS.
- Y. Zeng, K. Zhang, X. Wang, Y. Sui, B. Zou, W. Zheng and G. Zou, Sens. Actuators, B, 2011, 159, 245–250 CrossRef CAS.
- N. S. Ramgir, P. K. Sharma, N. Datta, M. Kaur, A. K. Debnath, D. K. Aswal and S. K. Gupta, Sens. Actuators, B, 2013, 186, 718–726 CrossRef CAS.
- S. Moon, N. M. Vuong, D. Lee, D. Kim, H. Lee, D. Kim, S.-K. Hong and S.-G. Yoon, Sens. Actuators, B, 2016, 222, 166–172 CrossRef CAS.
- T. Yu, X. Cheng, X. Zhang, L. Sui, Y. Xu, S. Gao, H. Zhao and L. Huo, J. Mater. Chem. A, 2015, 3, 11991–11999 RSC.
- K.-H. Kim, E.-C. Jeon, Y.-J. Choi and Y.-S. Koo, Atmos. Environ., 2006, 40, 4478–4490 CrossRef CAS.
- K.-H. Kim, Y. J. Choi, E. C. Jeon and Y. Sunwoo, Atmos. Environ., 2005, 39, 1103–1112 CrossRef CAS.
- Y. Wang, Y. Wang, J. Cao, F. Kong, H. Xia, J. Zhang, B. Zhu, S. Wang and S. Wu, Sens. Actuators, B, 2008, 131, 183–189 CrossRef CAS.
- V. Balouria, N. S. Ramgir, A. Singh, A. K. Debnath, A. Mahajan, R. K. Bedi, D. K. Aswal and S. K. Gupta, Sens. Actuators, B, 2015, 219, 125–132 CrossRef CAS.
- Y. Wang, F. Kong, B. Zhu, S. Wang, S. Wu and W. Huang, Mater. Sci. Eng., B, 2007, 140, 98–102 CrossRef CAS.
- Z. Jiang, J. Li, H. Aslan, Q. Li, Y. Li, M. Chen, Y. Huang, J. P. Froning, M. Otyepka, R. Zbořil, F. Besenbacher and M. Dong, J. Mater. Chem. A, 2014, 2, 6714–6717 RSC.
- J. Deng, J. Ma, L. Mei, Y. Tang, Y. Chen, T. Lv, Z. Xu and T. Wang, J. Mater. Chem. A, 2013, 1, 12400–12403 RSC.
- Z. Sun, H. Yuan, Z. Liu, B. Han and X. Zhang, Adv. Mater., 2005, 17, 2993–2997 CrossRef CAS.
- L. Yin, D. Chen, M. Feng, L. Ge, D. Yang, Z. Song, B. Fan, R. Zhang and G. Shao, RSC Adv., 2015, 5, 328–337 RSC.
- K.-I. Choi, H.-J. Kim, Y. C. Kang and J.-H. Lee, Sens. Actuators, B, 2014, 194, 371–376 CrossRef CAS.
- G.-J. Sun, S.-W. Choi, A. Katoch, P. Wu and S. S. Kim, J. Mater. Chem. C, 2013, 1, 5454–5462 RSC.
- A. B. Bodade, A. B. Bodade, H. G. Wankhade, G. N. Chaudhari and D. C. Kothari, Talanta, 2012, 89, 183–188 CrossRef CAS PubMed.
- X. Wang, W. Wang, H. Li, C. Fu, Y. Ke and S. He, Sens. Actuators, B, 2012, 169, 10–16 CrossRef CAS.
- M. K. Verma and V. Gupta, Sens. Actuators, B, 2012, 166–167, 378–385 CrossRef CAS.
- Y. Wang, S. Wang, H. Zhang, X. Gao, J. Yang and L. Wang, J. Mater. Chem. A, 2014, 2, 7935–7943 RSC.
- I. Giebelhaus, E. Varechkina, T. Fischer, M. Rumyantseva, V. Ivanov, A. Gaskov, J. R. Morante, J. Arbiol, W. Tyrra and S. Mathur, J. Mater. Chem. A, 2013, 1, 11261–11268 RSC.
- S. Bhuvaneshwari and N. Gopalakrishnan, J. Alloys Compd., 2016, 654, 202–208 CrossRef CAS.
- I. Jiménez, M. A. Centeno, R. Scotti, F. Morazzoni, J. Arbiol, A. Cornet and J. R. Morante, J. Mater. Chem., 2004, 14, 2412–2420 RSC.
- M. D'Arienzo, L. Armelao, C. M. Mari, S. Polizzi, R. Ruffo, R. Scotti and F. Morazzoni, J. Am. Chem. Soc., 2011, 133, 5296–5304 CrossRef PubMed.
- P. Elumalai, J. Zosel, U. Guth and N. Miura, Ionics, 2009, 15, 405–411 CrossRef CAS.
- E. Rossinyol, A. Prim, E. Pellicer, J. Arbiol, F. Hernández-Ramírez, F. Peiró, A. Cornet, J. R. Morante, L. A. Solovyov, B. Tian, T. Bo and D. Zhao, Adv. Funct. Mater., 2007, 17, 1801–1806 CrossRef CAS.
- L. Wang, A. Teleki, S. E. Pratsinis and P. I. Gouma, Chem. Mater., 2008, 20, 4794–4796 CrossRef CAS.
- R. K. Sharma, M. C. Bhatnagar and G. L. Sharma, Sens. Actuators, B, 1997, 45, 209–215 CrossRef CAS.
- X. Fu, F. Bei, X. Wang, X. Yang and L. Lu, J. Raman Spectrosc., 2009, 40, 1290–1295 CrossRef CAS.
- M. F. Hassan, M. M. Rahman, Z. P. Guo, Z. X. Chen and H. K. Liu, Electrochim. Acta, 2010, 55, 5006–5013 CrossRef CAS.
- H. Li, W. Xie, B. Liu, C. Wang, Y. Wang, X. Duan, Q. Li and T. Wang, Sens. Actuators, B, 2017, 242, 404–411 CrossRef CAS.
- S. Y. Lee, D.-H. Kim, S. C. Choi, D.-J. Lee, J. Y. Choi and H.-D. Kim, Microporous Mesoporous Mater., 2014, 194, 46–51 CrossRef CAS.
- J. Gong, K. Yao, J. Liu, Z. Jiang, X. Chen, X. Wen, E. Mijowska, N. Tian and T. Tang, J. Mater. Chem. A, 2013, 1, 5247–5255 RSC.
- N. Li, J. Zhang, Y. Tian, J. Zhao, J. Zhang and W. Zuo, Chem. Eng. J., 2017, 308, 377–385 CrossRef CAS.
- H. J. Kim, J. W. Yoon, K. I. Choi, H. W. Jang, A. Umar and J. H. Lee, Nanoscale, 2013, 5, 7066–7073 RSC.
- S. Shen, J. Jiang, P. Guo, C. X. Kronawitter, S. S. Mao and L. Guo, Nano Energy, 2012, 1, 732–741 CrossRef CAS.
- Y. Wang, B. Liu, S. Xiao, X. Wang, L. Sun, H. Li, W. Xie, Q. Li, Q. Zhang and T. Wang, ACS Appl. Mater. Interfaces, 2016, 8, 9674–9683 CrossRef CAS PubMed.
- M. E. Franke, T. J. Koplin and U. Simon, Small, 2006, 2, 36–50 CrossRef CAS PubMed.
- M. Tiemann, Chemistry, 2007, 13, 8376–8388 CrossRef CAS PubMed.
- Z. Liu, B. Liu, W. Xie, H. Li, R. Zhou, Q. Li and T. Wang, Sens. Actuators, B, 2016, 235, 614–621 CrossRef CAS.
- Y. Wang, B. Liu, S. Xiao, H. Li, L. Wang, D. Cai, D. Wang, Y. Liu, Q. Li and T. Wang, J. Mater. Chem. A, 2015, 3, 1317–1324 RSC.
- A. PiÉPlu, O. Saur, J.-C. Lavalley, O. Legendre and C. NÉDez, Catal. Rev., 1998, 40, 409–450 CrossRef.
- J. A. Rodriguez, M. Pérez, T. Jirsak, L. González, A. Maiti and J. Z. Larese, J. Phys. Chem. B, 2001, 105, 5497–5505 CrossRef CAS.
- C. O. Park and S. A. Akbar, J. Mater. Sci., 2003, 38, 4611–4637 CrossRef CAS.
- R. W. J. Scott, S. M. Yang, N. Coombs, G. A. Ozin and D. E. Williams, Adv. Funct. Mater., 2003, 13, 225–231 CrossRef CAS.
- R. W. J. Scott, S. M. Yang, G. Chabanis, N. Coombs, D. E. Williams and G. A. Ozin, Adv. Mater., 2001, 13, 1468–1472 CrossRef CAS.
| This journal is © The Royal Society of Chemistry 2019 |

