 Open Access Article
One step DNA amplification of mammalian cells in picoliter microwell arrays†
Wenwen Liu ,
Zhao Li,
Yuanjie Liu,
Qingquan Wei,
Yong Liu,
Lufeng Ren,
Chenyu Wang
 and
Yude Yu*
State Key Laboratory on Integrated Optoelectronics, Institute of Semiconductors, Chinese Academy of Sciences, P. O. Box 912, Beijing, 100083, China. E-mail: yudeyu@semi.ac.cn
First published on 21st January 2019
Abstract
We developed a strategy for direct DNA amplification of single cells on a PEG-modified silica chip with 30![[thin space (1/6-em)]](https://www.rsc.org/images/entities/char_2009.gif) 600 picoliter-sized microwells. HPV-positive cells in heterogeneous populations were successfully detected with high accuracy sensitivity as high as single copy.
600 picoliter-sized microwells. HPV-positive cells in heterogeneous populations were successfully detected with high accuracy sensitivity as high as single copy.
Sensitive and specific detection of nucleic acids from rare but biologically important individual cells can bring in-depth understanding of cell differentiation and disease occurrence; for example, stem cells and circulating tumour cells in cancer patients.1–4 As the most powerful and basic technologies to analyse nucleic acids, polymerase chain reaction (PCR) produces millions of copies of DNA molecules starting from a single template DNA. In PCR of cell populations, cell lysis and specific enrichment procedures need to be highly efficient and compatible with downstream analysis, which may lose rare DNA and cannot reveal cell heterogeneity. Methods for isolating and PCR of single cells are essential to obtain more meaningful information.
Several research groups have reported techniques for gene analysis using a small amount of cells, even a single cell.5–9 Flow cytometry may be the most effective way for isolating large numbers of individual cells, but gene analysis of these sorted cells is still conducted in vials, with microliter volumes and low throughput. Analytical tools and methods for high throughput gene analysis based on microfluidic technology have emerged in recent years,10,11 including micro wells and micro droplets. Fusion and division of droplets are needed to add reagent and reduce lysate-induced inhibition effects, but they destroy the integrity of DNA12 and the accuracy of detection. Meanwhile, sample transfers between generation and operation of droplets, DNA amplification, and fluorescent detection also induces high risk of sample loss. Last but not least, complicated fabrication and operation processes, as well as high commercial costs of these microfluidic chips, are not affordable by most biological labs. One-step PCR of cells in micro wells without sample transfer is an effective and low cost method to ensure the integrity of cell DNA. However, due to lysate-mediated inhibition, reducing reaction volume to picoliters for high throughput analysis of cells is still a challenge today.
In this study, we present a strategy for one-step DNA amplification of a single cell on a PEG-modified silica chip with 30![[thin space (1/6-em)]](https://www.rsc.org/images/entities/char_2009.gif) 600 picoliter-sized microwells. We applied this strategy to detect HPV 16 E6 positive cells with existence of negative cells as background, demonstrating its feasibility for medical diagnosis and related applications. Compared with flow cytometry or microfluidic chips, this strategy can robustly detect a single copy of nucleic acids from single cells within 2.5 hours by an integrated operation. It is dramatically simpler and cheaper than previously reported methods, thus more accessible by most biology labs.
600 picoliter-sized microwells. We applied this strategy to detect HPV 16 E6 positive cells with existence of negative cells as background, demonstrating its feasibility for medical diagnosis and related applications. Compared with flow cytometry or microfluidic chips, this strategy can robustly detect a single copy of nucleic acids from single cells within 2.5 hours by an integrated operation. It is dramatically simpler and cheaper than previously reported methods, thus more accessible by most biology labs.
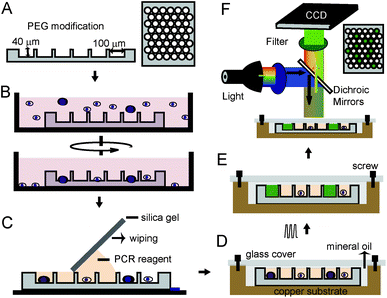
The workflow of our approach, shown as Fig. 1, illustrates the size-optimized silica chip is 2.2 × 2.2 cm2 and has 30![[thin space (1/6-em)]](https://www.rsc.org/images/entities/char_2009.gif) 600 microwells and is 100 μm in diameter, 40 μm in depth, and 314 pL in volume (Fig. 1A).13 To avoid air bubbles and protein adsorption during sample loading, surfaces of the chip were modified by methoxy-PEG-silane (2-[methoxy(polyethyleneoxy)propyl]-trimethoxysilane). Our method for fabricating the heating chamber is as follows: we first dried the silica chip and put it on the bottom of a culture dish. A pre-treated cell suspension with optimized density was added to the culture dish and then subjected to centrifugation (Fig. 1B). After cells were loaded into the microwells, the chip was washed with water and dried again. Then, PCR reagent was added on one side of the chip and a piece of silica gel was used to wipe the PCR reagent to another side (Fig. 1C). Next, the chip was sandwiched in a copper-glass chamber, which was filled with mineral oil and fixed by screws (Fig. 1D and S1†). Finally, this heating chamber was put on top of the heating module of a thermal cycler for PCR assay. TaqMan probes specific to target sequence produce a detectable signal when the positive cell is present and this PCR signal can be detected either during or at the end point of the assay by a fluorescence microscope (Fig. 1E and F).
600 microwells and is 100 μm in diameter, 40 μm in depth, and 314 pL in volume (Fig. 1A).13 To avoid air bubbles and protein adsorption during sample loading, surfaces of the chip were modified by methoxy-PEG-silane (2-[methoxy(polyethyleneoxy)propyl]-trimethoxysilane). Our method for fabricating the heating chamber is as follows: we first dried the silica chip and put it on the bottom of a culture dish. A pre-treated cell suspension with optimized density was added to the culture dish and then subjected to centrifugation (Fig. 1B). After cells were loaded into the microwells, the chip was washed with water and dried again. Then, PCR reagent was added on one side of the chip and a piece of silica gel was used to wipe the PCR reagent to another side (Fig. 1C). Next, the chip was sandwiched in a copper-glass chamber, which was filled with mineral oil and fixed by screws (Fig. 1D and S1†). Finally, this heating chamber was put on top of the heating module of a thermal cycler for PCR assay. TaqMan probes specific to target sequence produce a detectable signal when the positive cell is present and this PCR signal can be detected either during or at the end point of the assay by a fluorescence microscope (Fig. 1E and F).
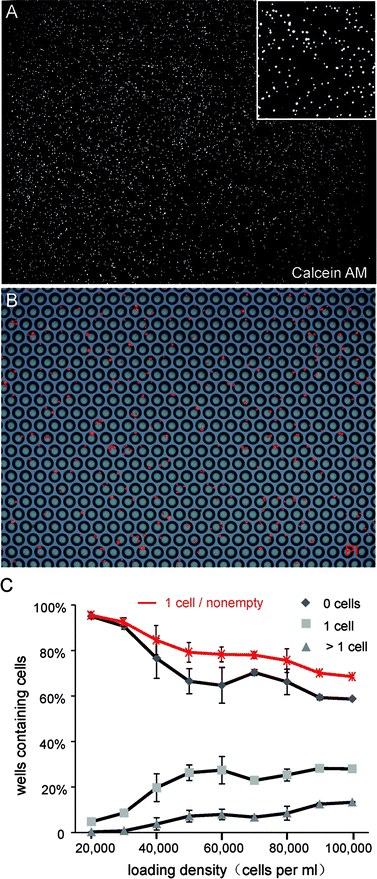
As the simplest and most accessible method, centrifugation was used to load cells into microwells. According to single cell trapping analysis that was previously demonstrated, the number of wells containing single cells climbs and then declines with increasing cell density.14 To obtain the maximum amount of single cells, we optimized density of the cell suspension for loading by increasing cell density gradually in a relatively small range and recording the number of cells in the microwell. The correlation between cell density and cell numbers in microwells is shown as Fig. 2. As expected, both the numbers of wells containing single cells and multi-cells increased with increased loading density, but the percentage of single cells decreased gradually. To balance these two aspects, we chose a loading density between 40![[thin space (1/6-em)]](https://www.rsc.org/images/entities/char_2009.gif) 000–60
000–60![[thin space (1/6-em)]](https://www.rsc.org/images/entities/char_2009.gif) 000 cells per mL. At this constant parameter, we obtained 8000 wells with cells, and more than 80% of these wells contained a single cell.
000 cells per mL. At this constant parameter, we obtained 8000 wells with cells, and more than 80% of these wells contained a single cell.
We used the same chip for cell loading and PCR reagent division to ensure the integrity of the cell's nucleic acids. There are several hindrances to fulfilling this strategy. The first one is to reduce the phosphate-buffered saline (PBS) normally used to suspend live cells during cell loading. Although the microwell is picoliter-sized, PBS salt precipitated when drying the chip after cell loading and was resolved during the PCR reagent division. The pretreatment of a cell sample we used was to eliminate PBS from cell suspension through fixing cells by paraformaldehyde (PFA) and re-suspending them in deionized water. Therefore, both PBS and PFA were eliminated. Our fixation process prevented cells from bursting during buffer replacement and also inactivated enzymes that inhibit a PCR reaction. Our results demonstrated that PBS elimination increased the PCR efficiency dramatically (Fig. S2†). On the other hand, suspending cells in water can keep the surface of a chip clean enough for PCR reagent division. Otherwise, air bubbles will generate when wiping the PCR reagent, become larger, and move during the thermal cycle, bringing strong fluorescent background finally (Fig. S2†).
The lysate-mediated inhibition effect increased dramatically when the reaction volume decreased to picoliter-scale, not only because of the remaining lysis reagent itself, but also due to the high concentration of cell lysate.15–18 According to reported works that BSA could be a mild reagent for direct cell lysis,19,20 another effort we made to fulfill this strategy was the introduction of bovine serum albumin (BSA) to PCR reagent. Compared with traditional PCR in a vial, PCR at picoliter scale has higher surface to volume ratio; thus, we needed a high enough concentration of BSA to lysis cells and prevent interface-adsorption of DNA polymerase. Unfortunately, we also found that background noises became stronger as BSA concentration increased. Considering these two contradictory aspects, we finally optimized the BSA concentration at 25 mg mL−1, which is a very high concentration compared with 1 mg mL−1 in traditional PCR carried out in vials and at which background noises are acceptable for detection.
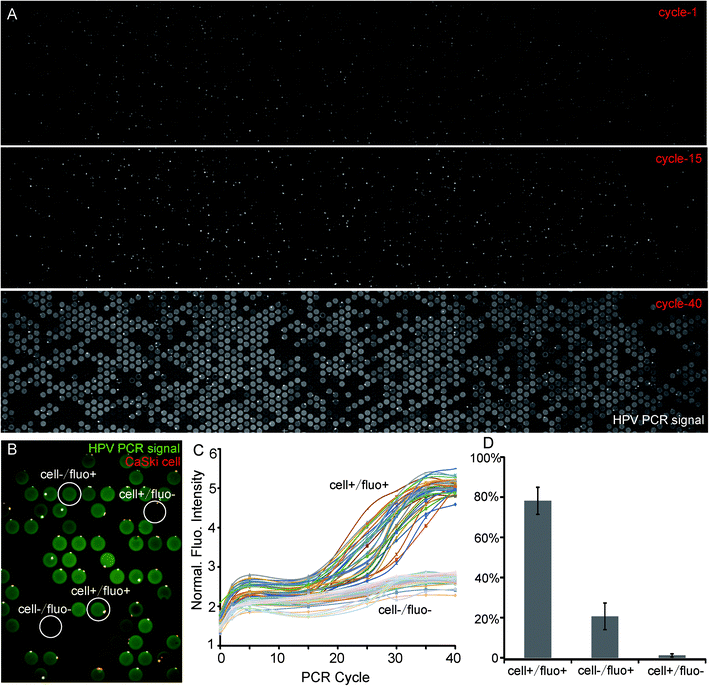
Human papilloma virus (HPV) induced cervical cancer was used as a model system to demonstrate the feasibility of this method. It is reported that HPV 16 E6 gene mediates the oncogenic property of HPV and over 99% of all cervical cancers are high-risk HPV-positive.21,22 The detection of HPV positive cells can be used as a primary diagnosis. We first verified the PCR reagent and PEG-modified chip worked well by cell lysate (Fig. S3A and B†). Next, we detected the HPV DNA in CaSki cells (HPV+, 600 copies) and human Alu elements (Fig. S4†), which are the most abundant transposable elements dispersed throughout the human genome.23,24 For both of these cases, we obtained the same specific PCR signal after 25 cycles (Fig. 3A and S4†). To exclude false signals, CaSki cells shown in Fig. 3A were not fluorescent labelled. Nevertheless, a cell itself generated a fluorescent signal immediately after the initial denaturation of PCR and this non-specific fluorescence changed very little during the thermal cycle. The only reason may be that cells adsorbed some TaqMan probes that were destroyed during denaturation. On the contrary, we took advantage of this property to identify the cell itself from a PCR signal in the following experiments when the cells were not initially stained.
We also stained cells by PI before loading them into microwells to distinguish cells from the PCR signals more clearly. We defined the relationship of cell-PCR fluorescence by a higher magnification shown as Fig. 3B and took images after each 5 cycles. The fluorescence of 35 cell+/fluo+ and 35 cell−/fluo− were analyzed. The curve of cell+/fluo+ shows an “S” shape which indicates a normal amplification and also a significant difference from the cell-/fluo- (empty well, Fig. 3C). On the other hand, it is easy to find that all the cell−/fluo+ (false positive signal) are near cell+/fluo+ (Fig. 3B), which indicated the possibility of leakage from a neighboring positive well. As these false positive signals are always together with positive signals, and statistics suggest that the ratio of cell+/fluo− is 1.1% (Fig. 3D), we can conclude that once a positive cell appears, it could be detected with an accuracy as high as 98.9% (sum of cell+/fluo+ and cell−/fluo+).
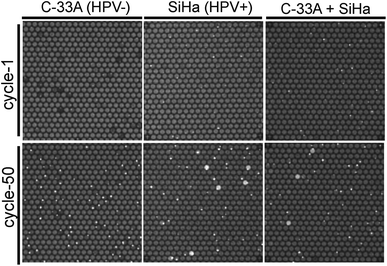
In order to confirm the utility of this assay to identify specific cells in heterogeneous populations, we detected HPV 16 gene in SiHa cells (HPV+) based on TaqMan PCR assays with existence of C-33a cell (HPV−) as background, which were not infected by HPV. Unlike the large number of HPV in CaSki and Alu element in human cells, each SiHa cells contain 1–2 copies of HPV 16 DNA only on average.25–27 Consistent with what we predicted, HPV-negative cells C-33A showed no PCR signals after 50 thermal cycles (Fig. 4). We found that SiHa cells, but not all of them (23% on average), generated positive PCR signals, which is different from what we originally thought (Fig. 4). We also mixed SiHa cells and C-33A cells to decline the positive cell content and the positive signals decreased continually. These findings demonstrated our strategy successfully detected a single copy of target DNA from single cells among heterogeneous populations.
There are several possibilities for the contradiction on HPV 16's copies in a SiHa cell. First, the reported number of 1–2 copies on average may be too low to detect in the picoliter-sized wells shown in our strategy, especially with a high concentration of protein as background. The second is that not every SiHa cell really has HPV 16 DNA because the reported data is an average number. More data are needed to give a deeper explanation through single cell sequencing or digital PCR of single SiHa cells.
Conclusions
In conclusion, we have established a novel strategy for the detection of specific cells in picoliter-sized reaction units with high throughput and efficiency. The cell pretreatment described in this work eliminates or inactivates most inhibitors, allowing the PCR reaction to be performed in picoliter-sized microwells. Using an improved PCR reagent, no specific cell lysis was needed for successful identification of a single DNA copy from single HPV positive cells in a microwell. Compared with previous reported single cell detection on a chip, simplification of the device and operation, combined with a commercial PCR instrument, and the high sensitivity of single copy detection in this work, enables the strategy to be dramatically more accessible by biologists. We also believe that this strategy of loading and direct PCR of single cells can be useful in a broad array of applications, especially single cell sequencing.Conflicts of interest
There are no conflicts to declare.Acknowledgements
This work was supported by grants from the Instrument Developing Project of the Chinese Academy of Sciences (Grant No. YZ201301) and the National Natural Science Foundation of China (Grant No. 61334008, 21804126).Notes and references
- M. Etzrodt, M. Endele and T. Schroeder, Cell Stem Cell, 2014, 15, 546–558 CrossRef CAS PubMed.
- A. Saadatpour, S. J. Lai, G. J. Guo and G. C. Yuan, Trends Genet., 2015, 31, 576–586 CrossRef CAS PubMed.
- F. Zhou, X. L. Li, W. L. Wang, P. Zhu, J. Zhou, W. Y. He, M. Ding, F. Y. Xiong, X. N. Zheng, Z. Li, Y. L. Ni, X. H. Mu, L. Wen, T. Cheng, Y. Lan, W. P. Yuan, F. C. Tang and B. Liu, Nature, 2016, 533, 487–492 CrossRef CAS PubMed.
- N. Navin, J. Kendall, J. Troge, P. Andrews, L. Rodgers, J. McIndoo, K. Cook, A. Stepansky, D. Levy, D. Esposito, L. Muthuswamy, A. Krasnitz, W. R. McCombie, J. Hicks and M. Wigler, Nature, 2011, 472, 90–94 CrossRef CAS PubMed.
- D. J. Eastburn, A. Sciambi and A. R. Abate, Nucleic Acids Res., 2014, 42, e128 CrossRef PubMed.
- D. K. Wood, D. M. Weingeist, S. N. Bhatia and B. P. Engelward, Proc. Natl. Acad. Sci. U. S. A., 2010, 107, 10008–10013 CrossRef CAS PubMed.
- Y. X. Zhao, F. Chen, Q. Li, L. H. Wang and C. H. Fan, Chem. Rev., 2015, 115, 12491–12545 CrossRef CAS PubMed.
- M. Ennen, C. Keime, D. Kobi, G. Mengus, D. Lipsker, C. Thibault-Carpentier and I. Davidson, Oncogene, 2015, 34, 3251–3263 CrossRef CAS PubMed.
- Y. Zhu, Y. X. Zhang, W. W. Liu, Y. Ma, Q. Fang and B. Yao, Sci. Rep., 2015, 5, 09551 CrossRef PubMed.
- I. C. Clark and A. R. Abate, Lab Chip, 2017, 17, 2032–2045 RSC.
- Y. H. Zhang and H. R. Jiang, Anal. Chim. Acta, 2016, 914, 7–16 CrossRef CAS PubMed.
- D. J. Eastburn, A. Sciambi and A. R. Abate, Anal. Chem., 2013, 85, 8016–8021 CrossRef CAS PubMed.
- Z. Li, Y. Liu, Q. Q. Wei, Y. J. Liu, W. W. Liu, X. L. Zhang and Y. D. Yu, PLoS One, 2016, 11, e0153359 CrossRef PubMed.
- I. K. Dimov, R. Lu, E. P. Lee, J. Seita, D. Sahoo, S. M. Park, I. L. Weissman and L. P. Lee, Nat. Commun., 2014, 5, 3451 CrossRef PubMed.
- I. G. Wilson, Appl. Environ. Microbiol., 1997, 63, 3741–3751 CAS.
- W. Abu al-Soud and P. Radstrom, J. Clin. Microbiol., 2001, 39, 485–493 CrossRef PubMed.
- P. Radstrom, R. Knutsson, P. Wolffs, M. Lovenklev and C. Lofstrom, Mol. Biotechnol., 2004, 26, 133–146 CrossRef PubMed.
- A. T. Hall, A. M. Zovanyi, D. R. Christensen, J. W. Koehler and T. D. Minogue, PLoS One, 2013, 8, e73845 CrossRef CAS PubMed.
- A. V. P. Le, D. X. Huang, T. Blick, E. W. Thompson and A. Dobrovic, Sci. Rep., 2015, 5, 12859 CrossRef PubMed.
- D. A. David Svec, M. Pekny, R. Sjöback, M. Kubista and S. Anders, Front Oncol., 2013, 3, 274 Search PubMed.
- L. A. Torre, F. Bray, R. L. Siegel, J. Ferlay, J. Lortet-Tieulent and A. Jemal, Ca-Cancer J. Clin., 2015, 65, 87–108 CrossRef PubMed.
- J. M. M. Walboomers, M. V. Jacobs, M. M. Manos, F. X. Bosch, J. A. Kummer, K. V. Shah, P. J. F. Snijders, J. Peto, C. Meijer and N. Munoz, J. Pathol., 1999, 189, 12–19 CrossRef CAS PubMed.
- K. Funakoshi, M. Bagheri, M. Zhou, R. Suzuki, H. Abe and H. Akashi, Sci. Rep., 2017, 7, 13202 CrossRef PubMed.
- J. A. Walker, G. E. Kilroy, J. Xing, J. Shewale, S. K. Sinha and M. A. Batzer, Anal. Biochem., 2003, 315, 122–128 CrossRef CAS PubMed.
- H. A. Cubie, A. L. Seagar, E. McGoogan, J. Whitehead, A. Brass, M. J. Arends and M. W. Whitley, J. Clin. Pathol.: Clin. Mol. Pathol., 2001, 54, 24–29 CAS.
- K. M. Ostrowska, A. Garcia, A. D. Meade, A. Malkin, I. Okewumi, J. J. O'Leary, C. Martin, H. J. Byrne and F. M. Lyng, Analyst, 2011, 136, 1365–1373 RSC.
- J. J. Oleary, G. Browne, M. I. Johnson, R. J. Landers, M. Crowley, I. Healy, J. T. Street, A. M. Pollock, F. A. Lewis, A. Andrew, C. Cullinane, O. Mohamdee, W. F. Kealy, J. Hogan and C. T. Doyle, J. Clin. Pathol., 1994, 47, 933–938 CrossRef CAS.
Footnote |
| † Electronic supplementary information (ESI) available. See DOI: 10.1039/c8ra06717a |
| This journal is © The Royal Society of Chemistry 2019 |


