Maoeriocalysins A–D, four novel ent-kaurane diterpenoids from Isodon eriocalyx and their structure determination utilizing quantum chemical calculation in conjunction with quantitative interproton distance analysis†
Qian
Yang‡
ab,
Kun
Hu‡
a,
Bing-Chao
Yan
a,
Miao
Liu
a,
Xiao-Nian
Li
a,
Han-Dong
Sun
 a and
Pema-Tenzin
Puno
 *a
*a
aState Key Laboratory of Phytochemistry and Plant Resources in West China, Kunming Institute of Botany, Chinese Academy of Sciences, Kunming 650201, Yunnan, People's Republic of China. E-mail: punopematenzin@mail.kib.ac.cn
bUniversity of Chinese Academy of Sciences, Beijing 100049, People's Republic of China
First published on 6th November 2018
Abstract
Maoeriocalysin A (1), a novel rearranged ent-kaurane diterpenoid with an unprecedented 4,5-seco-3,5-cyclo-7,20-epoxy-ent-kaurane scaffold, together with three rare 9,10-seco-7,20-epoxy-ent-kaurane diterpenoids, maoeriocalysins B–D (2–4), were isolated from the aerial parts of Isodon eriocalyx. Their structures were elucidated by comprehensive spectroscopic analysis, quantum chemical calculation of NMR parameters and electronic circular dichroism, quantitative interproton distance analysis, and single crystal X-ray diffraction experiment. The plausible biosynthetic pathway of 1–4 was also proposed.
Introduction
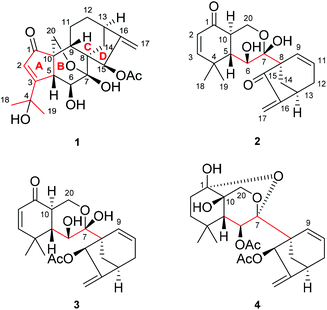
The genus Isodon (Lamiaceae), a group of approximately 150 species,1 has contributed substantially to the natural diterpenoid repertoire for being the source of over 1200 reported various diterpenoids so far. Among them, the numerically dominant ent-kaurane diterpenoids attracted the most attention by virtue of their enormous structural diversity and promising antitumor properties (Fig. S1†).2I. eriocalyx (Dunn.) Hara, a perennial herb or shrub endemic to southwestern China, has long been used as a folk medicine against sore throat, inflammation, influenza, etc.3 Previous investigations on I. eriocalyx have led to the discovery of a few ent-kauranes with fascinating structures and bioactivities.4 For example, eriocalyxin B, a potent antitumor agent as well as the main constituent of this plant, has been subjected to many in-depth studies concerning its mechanisms of action.5 Besides, maoecrystal V,4a an ent-kaurane diterpenoid with an intricate scaffold, has aroused considerable interest among synthetic chemists and seven cases of total synthesis have been completed.6As a continuous endeavour to search for structurally novel and bioactive diterpenoids from Isodon species, further study was undertaken on I. eriocalyx collected from Yuxi, Yunnan Province. As a result, four unusual diterpenoids (1–4) (Fig. 1) were obtained. Among them, maoeriocalysin A (1) was presumed to form through 4,5-cleavage and subsequent 3,5-cyclization on maoecrystal B (MCB, 5) (Fig. 2),7 resulting in an unprecedented 4,5-seco-3,5-cyclo-7,20-epoxy-ent-kaurane scaffold. In fact, only four reported ent-kauranes (6–9, Fig. 2) from the genus Isodon were characterized by structural variations at ring A, which was rather conserved.2 Furthermore, although the 5/6/6/5 ring system in 1 can also be found in tricalysiolide H (10),8 an ent-kaurane isolated from Tricalysia dubia, they were biosynthetically generated via distinct pathways (Fig. 2). Additionally, maoeriocalysins B–D (2–4) possessed a rare 9,10-seco-7,20-epoxy-ent-kaurane scaffold which was discovered from Isodon species for the first time. The only reported structural analogue of 2–4 was velloziolone (11) (without 7,20-epoxy) (Fig. 2) from Vellozia caputardeae.9 Notably, to address the configurational as well as constitutional issues existing in these structurally complicated molecules, quantum chemical calculation of NMR parameters and electronic circular dichroism (ECD) spectra,10 in conjunction with quantitative interproton distance analysis (QIDA), were intensively employed in the present research. Notably, QIDA was a comparative analysis made between interproton distances derived from the pre-calculated conformations and Nuclear Overhauser Effect (NOE) related NMR spectra of molecules being studied. The method was usually used for conformational analysis before, for instance, as in the NAMFIS methodology.11 Fortunately, it was recently introduced as a tool in the structure elucidation of natural products, mainly thanks to the contributions from Craig P. Butts et al.12 Herein, the detailed structure elucidation process and plausible biosynthetic pathway of 1–4 are presented.
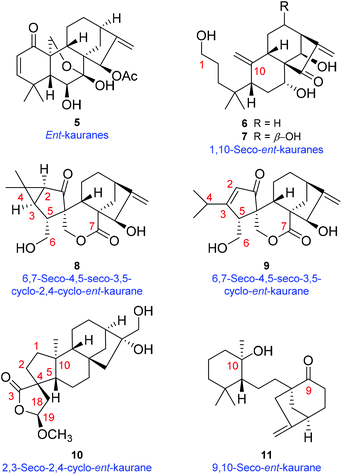 | ||
| Fig. 2 Chemical structures of maoecrystal B (5), luanchunin B (6),13 1,7α,12β,14β-tetrahydroxy-1,10-seco-ent-kaur-10,16-dien-15-one (7),14 neolaxiflorins A (8) and B (9),15 tricalysiolide H (10),8 velloziolone (11),9 and their corresponding structural types. | ||
Results and discussion
Maoeriocalysin A (1), [α]24D −115.5 (c 0.05, MeOH), was obtained as a colorless gum. It had the molecular formula C22H28O7 as deduced by the sodium (+)-HRESIMS ion at m/z 427.1739 [M + Na]+ (calcd 427.1727), indicating nine degrees of unsaturation. The 1H NMR exhibited characteristic signals for three olefinic protons at δH 5.86 (d, 2.3 Hz, H-2), 5.11 (br d, H-17a), 4.85 (br d, H-17b), five methine groups at δH 5.62 (d, 2.6 Hz, H-15), 4.28 (d, 9.2 Hz, H-6), 3.48 (m, H-5), 2.71 (m, H-13), 2.52 (dd, 13.4 Hz, 4.8 Hz, H-9), three methyl groups at δH 2.13 (s, H3-OAc), 1.56 (s, H3-18), 1.55 (s, H3-19) (Table 1). Its 13C and DEPT NMR spectra disclosed 22 carbon resonances, including three methyls, five methylenes (including one oxygenated, one olefinic carbon), six methines (including two oxygenated, one olefinic carbon), and eight quaternary carbons (including two oxygenated, two olefinic carbons, one ester carbonyl) (Table 1). The above data suggested that 1 should be a tetracyclic diterpenoid bearing an extra epoxy ring.| No. | 1 | 2 | 3 | 4 | ||||
|---|---|---|---|---|---|---|---|---|
| δ H, mult. (J, Hz) | δ C | δ H, mult. (J, Hz) | δ C | δ H, mult. (J, Hz) | δ C | δ H, mult. (J, Hz) | δ C | |
| a Recorded at 800 MHz (1H NMR) and 200 MHz (13C NMR) in chloroform-d. b Recorded at 800 MHz (1H NMR) and 200 MHz (13C NMR) in pyridine-d5. | ||||||||
| 1 | 204.8 s | 198.1 s | 198.7 s | 97.0 s | ||||
| 2a | 5.86 d (2.3) | 127.1 d | 5.82 d (10.2) | 125.4 d | 5.88 d (10.1) | 125.0 d | 2.07 m (overlap) | 29.3 t |
| 2b | 1.40 m | |||||||
| 3a | 179.8 s | 6.49 d (10.2) | 161.6 d | 6.41 d (10.1) | 162.0 d | 1.51 m | 33.7 t | |
| 3b | 1.30 m (overlap) | |||||||
| 4 | 72.1 s | 36.1 s | 36.5 s | 32.2 s | ||||
| 5 | 3.48 m | 53.9 d | 2.38 dd (13.2, 10.3) | 46.8 d | 2.61 dd (13.6, 9.9) | 47.8 d | 1.57 d (1.0) | 56.0 d |
| 6 | 4.28 d (9.2) | 73.9 d | 3.73 dd (12.6, 10.3) | 72.7 d | 4.14 t (9.9) | 72.1 d | 5.23 d (1.0) | 69.9 d |
| 7 | 97.6 s | 98.3 s | 99.0 s | 97.9 s | ||||
| 8 | 51.8 s | 57.2 s | 54.0 s | 51.4 s | ||||
| 9 | 2.52 dd (13.4, 4.8) | 38.6 d | 6.03 dd (9.9, 2.3) | 128.0 d | 6.61 d (9.4) | 133.1 d | 5.86 m | 128.9 d |
| 10 | 51.0 s | 2.48 ddd (13.2, 10.9, 5.2) | 43.9 d | 2.69 ddd (13.6, 10.6, 4.8) | 44.5 d | 68.7 s | ||
| 11a | 2.07 m | 16.3 t | 5.84 m | 129.5 d | 5.71 m | 125.9 d | 5.73 m | 127.4 d |
| 11b | 1.73 m | |||||||
| 12a | 2.23 m | 32.6 t | 2.10 m | 35.3 t | 2.42 m (overlap) | 38.6 t | 2.47 m | 38.2 t |
| 12b | 1.48 m | 2.64 m | 2.05 d (3.7) | 2.07 m (overlap) | ||||
| 13 | 2.71 m | 35.0 d | 3.13 br s | 35.9 d | 2.77 br s | 39.2 d | 2.82 t (4.9) | 38.6 d |
| 14a | 2.03 d (12.0) | 25.7 t | 1.92 d (11.0) | 32.3 t | 2.42 m (overlap) | 34.1 t | 1.97 m | 32.3 t |
| 14b | 1.60 dd (12.0, 5.3) | 2.18 dd (11.0, 5.7) | 2.37 dd (12.0, 5.7) | 1.30 m (overlap) | ||||
| 15 | 5.62 d (2.6) | 74.8 d | 201.3 s | 6.69 br s | 81.8 d | 6.27 t (2.5) | 80.7 d | |
| 16 | 156.3 s | 150.0 s | 155.7 s | 153.2 s | ||||
| 17a | 5.11 br d | 109.8 t | 6.09 s | 119.6 t | 5.18 br s | 109.2 t | 5.14 dd (2.5, 1.1) | 109.9 t |
| 17b | 4.85 br d | 5.65 s | 5.13 br s | 4.95 m | ||||
| 18 | 1.56 s | 29.8 q | 1.37 s | 31.2 q | 1.52 s | 31.5 q | 1.22 s | 28.3 q |
| 19 | 1.55 s | 29.8 q | 1.19 s | 20.0 q | 1.26 s | 19.7 q | 1.03 s | 29.8 q |
| 20a | 4.12 dd (9.6, 1.4) | 67.0 t | 4.10 dd (11.9, 5.2) | 59.8 t | 4.34 dd (11.5, 4.8) | 59.7 t | 3.94 d (8.8) | 67.3 t |
| 20b | 3.78 dd (9.6, 1.4) | 4.03 dd (11.9, 10.9) | 4.28 t (11.5) | 3.76 d (8.8) | ||||
| 6-OAc | 168.5 s | |||||||
| 6-OAc | 2.05 s | 21.6 q | ||||||
| 15-OAc | 170.9 s | 171.6 s | 174.0 s | |||||
| 15-OAc | 2.13 s | 21.7 q | 2.10 s | 21.4 q | 2.11 s | 21.9 q | ||
| 1-OH | 3.46 s | |||||||
| 6-OH | 1.31 d (12.6) | 5.74 d (10.6) | ||||||
| 7-OH | 5.91 s | |||||||
Extensive analysis of the 1H–1H COSY and HMBC spectra of 1 (Fig. 3), in combination with NMR data comparison, manifested that it shared the same structural fragment with MCB7 with regard to their rings B, C, and D. However, the HMBC correlations from H-2 to C-1, C-3, C-5, C-10, from H-5 to C-1, C-3, C-9, C-10, and from H-6 to C-3, C-7, C-8 suggested ring A in 1 to be a cyclopent-2-en-1-one motif instead of a normal hexacyclic ring as in MCB. Furthermore, the HMBC correlations from H3-18 (and H3-19) to C-3 and C-4, and from H3-18 to C-19 revealed that a 2-hydroxyisopropyl group was attached to C-3.
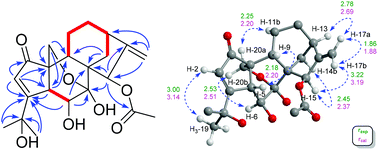
The relative configuration of 1 was deduced by analysis of 1H–1H coupling constants and ROESY correlations. Randomly assigning H-5 as β-oriented, the large 3JH-5/H-6 (9.2 Hz) indicated a large H-5/C-5/C-6/H-6 dihedral angle, demanding H-6 to be α-orientated. The H-20a/H-6α correlation in the ROESY spectrum manifested the α-orientation of C-20, which further demonstrated that the C-7/O/C-20 bridge was located behind ring B and that HO-7 was β-oriented. Moreover, the H-5/H-9 correlation suggested H-9 to be β-oriented. Then, the H-12b/H-9 and H-15/H-14b ROESY correlations revealed that the bridged C/D rings in 1 have the same stereochemistry as MCB. Thus, the relative configuration of 1 was clearly elucidated to be 5R*, 6S*, 7S*, 8S*, 9S*, 10S*, 13R*, and 15R*. Then, quantum chemical calculation16 and QIDA methods succeeded in validating the established structure of 1: (1) good consistency was observed between the theoretical and experimental chemical shifts of 1, as indicated by relevant parameters, including R2 (13C: 0.9989; 1H: 0.9917), MAE (13C: 2.0 ppm; 1H: 0.13 ppm), and CMAE (13C: 1.4 ppm; 1H: 0.11 ppm) (Tables S1, S2 and Fig. S17†); (2) excellent agreement (MAD: 0.06 Å) was found between selected key interproton distances derived from the ROESY spectrum using the PANIC method17 and those extracted from the DFT optimized conformer of 1 (Fig. 4, Table S8†). Finally, TDDFT ECD calculations18 were run on two possible enantiomers of 1, and the obtained curves strongly confirmed the absolute configuration of 1 to be 5R, 6S, 7S, 8S, 9S, 10S, 13R, and 15R (Fig. 5). Consequently, maoeriocalysin A (1) was found to possess an unprecedented 4,5-seco-3,5-cyclo-7,20-epoxy-ent-kaurane scaffold.
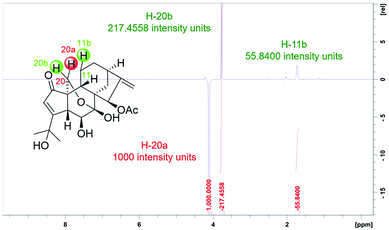 | ||
| Fig. 4 2D ROESY f1 slice at f2 chemical shifts (800 MHz, CDCl3) of H-20a of 1, with red intergrals as the intensity of each proton. For slices of other protons, see Fig. S4–S9.† | ||
Maoeriocalysin B (2), [α]24D +39.9 (c 0.10, MeOH), was isolated as colorless needle crystals. The molecular formula C20H24O5 was determined on the basis of its sodium (+)-HRESIMS ion at m/z 367.1522 [M + Na]+ (calcd 367.1516), suggesting nine degrees of unsaturation. Comprehensive analysis of the 1D NMR data of 2 indicated that it was a diterpenoid with an unusual scaffold. The 1H–1H COSY spectrum of 2 disclosed three 1H–1H spin systems (Fig. 6). Careful interpretations of the HMBC correlations from H-2 to C-4, C-10, from H-3 to C-1, from H-5 to C-1, C-4, from H3-18 to C-3, C-4, from H3-19 to C-5, and from H-20a to C-7 enabled the connection of two spin systems and the formation of fragment A (Fig. 6). Subsequently, HMBC correlations from H-9 to C-8, C-14, C-15, from H-14 to C-15, C-16, and from H-17 to C-13, C-16, together with the remaining spin system, collectively proved the existence of a bridged bicyclo[3.2.1]octane ring system commonly found in ent-kauranes, except that C-9/C-11 formed a double bond in 2 (fragment B) (Fig. 6). Finally, the two fragments were determined to be linked via the C-7/C-8 bond on the basis of HMBC correlations from H-6 to C-7, C-8 and from H-9 to C-7, C-8.
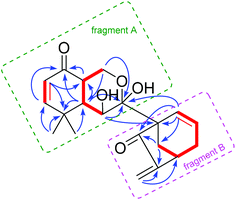 | ||
Fig. 6
1H–1H COSY ( ) correlations, key HMBC (H ) correlations, key HMBC (H  C) correlations of 2. Green and pink frames are depicted to describe fragments A and B, respectively. C) correlations of 2. Green and pink frames are depicted to describe fragments A and B, respectively. | ||
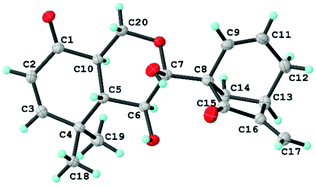
Now that the planar structure of 2 has been elucidated, the 3JH-5β/H-6 (10.3 Hz) and 3JH-5β/H-10 (13.2 Hz), together with the H-6/H-10 ROESY correlation, indicated that both H-6 and H-10 were α-oriented. However, the stereochemistry of other chiral centers remained unclear due to inadequate evidence. Fortunately, a suitable crystal of 2 was obtained for X-ray diffraction analysis with Cu Kα radiation, which validated the planar structure of 2 as well as unambiguously determining its absolute stereochemistry to be 5S, 6S, 7R, 8S, 10R, and 13R [flack parameter: 0.07(5); CCDC: 1860051†] (Fig. 7). As a result, compound 2 was found to possess a rare 9,10-seco-7,20-epoxy ent-kaurane scaffold.
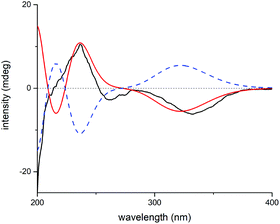
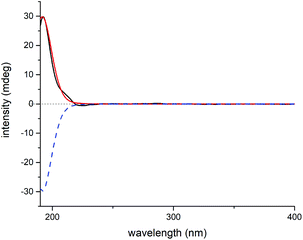
Elaborate analysis of the NMR data of 3 suggested its structure to be highly similar to 2, except that the C-15 carbonyl group (δC 201.3) in 2 was replaced with an acetoxyl substituted methine (δC 81.8) in 3, as informed by the HMBC correlations from H-15 to C-7, C-8, C-17, and AcO-15 (C![[double bond, length as m-dash]](https://www.rsc.org/images/entities/char_e001.gif) O). The configurational determination of most chiral centers in 3 can be completed by NMR data comparison with those of 2 as well as biosynthetic considerations. Besides, H-15 was determined to be α-oriented through H-15/H-14b ROESY correlation. However, the stereochemistry of C-7 can't be solved presently due to the lack of solid evidence. Then, the 1H and 13C NMR data of two possible C-7 diastereoisomers of 3 (3a and 3b, Fig. S19†) were computed and compared to their experimental counterparts, which successfully excluded the possibility of 3b and assigned the whole stereochemistry of 3 as 5S*, 6S*, 7R*, 8S*, 10R*, 13R*, and 15R* (3a), as supported by R2, MAE, CMAE, as well as DP4+ probabilities (Tables S3, S4 and S21†).19 Subsequently, ECD calculation of the two enantiomers of 3a enabled the establishment of the absolute configuration of 3 to be 5S, 6S, 7R, 8S, 10R, 13R, and 15R (Fig. 8).
O). The configurational determination of most chiral centers in 3 can be completed by NMR data comparison with those of 2 as well as biosynthetic considerations. Besides, H-15 was determined to be α-oriented through H-15/H-14b ROESY correlation. However, the stereochemistry of C-7 can't be solved presently due to the lack of solid evidence. Then, the 1H and 13C NMR data of two possible C-7 diastereoisomers of 3 (3a and 3b, Fig. S19†) were computed and compared to their experimental counterparts, which successfully excluded the possibility of 3b and assigned the whole stereochemistry of 3 as 5S*, 6S*, 7R*, 8S*, 10R*, 13R*, and 15R* (3a), as supported by R2, MAE, CMAE, as well as DP4+ probabilities (Tables S3, S4 and S21†).19 Subsequently, ECD calculation of the two enantiomers of 3a enabled the establishment of the absolute configuration of 3 to be 5S, 6S, 7R, 8S, 10R, 13R, and 15R (Fig. 8).
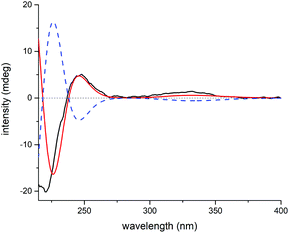 | ||
| Fig. 8 Experimental ECD spectrum of 3 (black); calculated ECD spectrum of (5S, 6S, 7R, 8S, 10R, 13R, 15R)-3a (shift = 23 nm, red) and (5R, 6R, 7S, 8R, 10S, 13S, 15S)-3a (shift = 23 nm, blue dash). | ||
Maoeriocalysin D (4), [α]24D +67.0 (c 0.25, MeOH), was isolated as a white powder. The molecular formula C24H32O8 (implying nine degrees of unsaturation) of 4 was determined from HRESIMS m/z 471.1994 [M + Na]+ (calcd 471.1989). Careful analysis of the NMR spectra of 4 indicated that it possessed an identical scaffold to 2. Two acetoxyl substituents at C-6 and C-15 were confirmed by the HMBC correlations from H-6 to C-7, C-8 and AcO-6 (C![[double bond, length as m-dash]](https://www.rsc.org/images/entities/char_e001.gif) O), from H-15 to C-7, C-8, C-17, and AcO-15 (C
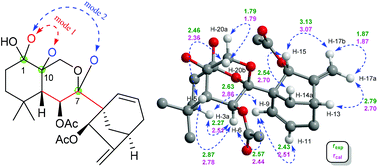
O), from H-15 to C-7, C-8, C-17, and AcO-15 (C![[double bond, length as m-dash]](https://www.rsc.org/images/entities/char_e001.gif) O), respectively. Besides, a remarkable difference between 4 and 2 was due to the emergence of an extra ketal (or hemiketal) 13C signal at δC 97.0 in 4, in place of the carbonyl group (δC 198.2, C-1) in 2. The HMBC correlations from H-2 to C-1, C-10, from HO-1 to C-1, C-2, and from H-5 to C-1, C-3, C-4 and C-10 assisted in assigning the extra ketal (or hemiketal) carbon to be C-1, as well as displaying the reduction of C-2/C-3 and the oxygenation of C-10 in 4, as compared with compound 2. So far, 8 out of 9 degrees of unsaturation have been occupied, suggesting the presence of another ring formed through an ether bond between two of the three oxygenated quaternary carbons (C-1, C-7 and C-10) (Fig. 9), which can't be determined due to the lack of a free hydroxyl 1H signal (HO-7 or HO-10), despite the fact that NMR data were obtained in several solvents (Fig. S71–S73†).
O), respectively. Besides, a remarkable difference between 4 and 2 was due to the emergence of an extra ketal (or hemiketal) 13C signal at δC 97.0 in 4, in place of the carbonyl group (δC 198.2, C-1) in 2. The HMBC correlations from H-2 to C-1, C-10, from HO-1 to C-1, C-2, and from H-5 to C-1, C-3, C-4 and C-10 assisted in assigning the extra ketal (or hemiketal) carbon to be C-1, as well as displaying the reduction of C-2/C-3 and the oxygenation of C-10 in 4, as compared with compound 2. So far, 8 out of 9 degrees of unsaturation have been occupied, suggesting the presence of another ring formed through an ether bond between two of the three oxygenated quaternary carbons (C-1, C-7 and C-10) (Fig. 9), which can't be determined due to the lack of a free hydroxyl 1H signal (HO-7 or HO-10), despite the fact that NMR data were obtained in several solvents (Fig. S71–S73†).
As for the stereochemistry of 4, as opposed to the situation in 1–3, a small 3JH-5β/H-6 (1.0 Hz) was observed in 4. However, the H-6/H-3a/H3-19 ROESY correlations still indicated H-6 in 4 to be α-oriented as in 1–3. Besides, the H-15/H-14a ROESY correlation assigned H-15 to be α-oriented. The above evidence, together with the H-5/H-20b ROESY correlations (Fig. S3†), required five possible constitutional or configurational isomers of 4 to be further considered (4a–4e) (Fig. S25†). Thus, their 1H and 13C NMR data were computed and compared with their experimental counterparts. As revealed by R2, MAE, CMAE, and especially the DP4+ probabilities of each isomer, 4a was definitely the right structure (Tables S5, S6, and S50†). Moreover, QIDA was carried out on the five possible candidates (4a–4e), and the results further supported the correctness of 4a (Table 2). And subsequent TDDFT calculation successfully assigned its absolute configuration as 1S, 5S, 6S, 7R, 8S, 10R, 13R, and 15R (Fig. 10).
| H-a/H-b | Experimental interproton distances (Å) | Calculated interproton distances (Å) | ||||
|---|---|---|---|---|---|---|
| 4a | 4b | 4c | 4d | 4e | ||
| H-15/H-17b | 3.13 | 3.07 | 2.99 | 2.79 | 3.02 | 3.16 |
| H-15/H-14a | 2.54 | 2.70 | 2.69 | 3.79 | 2.66 | 2.42 |
| H-9/H-3a | 2.63 | 2.86 | 8.26 | 7.08 | 7.75 | 7.30 |
| H-9/H-6 | 2.57 | 2.44 | 3.67 | 2.82 | 3.25 | 3.97 |
| H-9/H-11 | 2.43 | 2.51 | 2.44 | 2.45 | 2.45 | 2.44 |
| H-6/H-3a | 2.27 | 2.51 | 4.96 | 4.23 | 4.17 | 3.62 |
| H-6/H-5 | 2.87 | 2.78 | 3.06 | 3.01 | 3.03 | 2.79 |
| H-20b/H-5 | 2.46 | 2.36 | 2.48 | 2.80 | 3.22 | 2.99 |
| H-17a/H-13 | 2.79 | 2.70 | 2.75 | 2.71 | 2.76 | 2.83 |
| H-17a/H-17b | 1.87 | 1.87 | 1.88 | 1.89 | 1.88 | 1.87 |
| H3-19/H-3a | 2.79 | 2.83 | 3.32 | 3.35 | 3.06 | 3.58 |
| H3-19/H-6 | 2.34 | 2.33 | 3.01 | 2.90 | 2.52 | 3.11 |
| MAD | 0.10 | 0.93 | 0.83 | 0.78 | 0.82 | |
| STD | 0.30 | 1.62 | 1.27 | 1.44 | 1.32 | |
Notably, in addition to the C-9/C-10 cleavage and C-7/C-20 epoxy characteristics as seen in 2 and 3, maoeriocalysin D (4) still featured an extra oxygen bridge between C-1 and C-7, which was unprecedented in Isodon diterpenoids and gave rise to the complicated cage-like architecture in 4. Therefore, the aforementioned contradictory relationships between the 3JH-5/H-6 value range and C-5/C-6 relative configurations among 1–4 can be explained and further demonstrated by 3JH-5/H-6 calculation of 4a (experimental: 1.0 Hz; calculated: 1.2 Hz) using conformer 4a-1 (population: 100%; H-5/C-5/C-6/H-6 dihedral angle: 114.8°) (Table S7†).
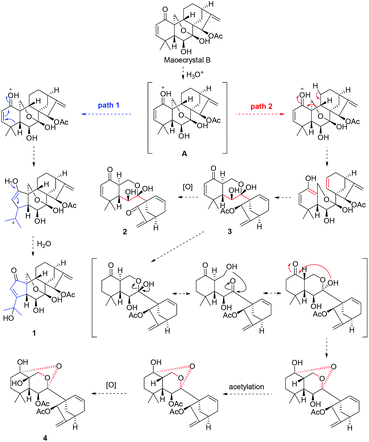
The unique chemical structures of 1–4 aroused our great interest in their possible biosynthetic pathways, which might be traced back to MCB. Firstly, MCB underwent an acid activation to form intermediate A, which was converted to compound 1 through path 1 by electron transfer and ring A arrangement. Meanwhile, compound 3 was generated from intermediate A through path 2 via ring B cleavage, then 3 produced 2 through C-15 deacetylation and oxidation. Finally, C-2 hydrogenation, HO-7 inversion triggered by aldol condensation, C-6 acetylation, and C-1/C-7 condensation reactions taking place on 3 led to the formation of 4 (Scheme 1).
Compounds 1–4 were evaluated for their AChE and BuChE inhibitory activities using the spectrophotometric method,20 as a result, compound 2 showed weak anti-AChE activity (IC50 = 37.6 ± 2.3 μM) (Tables S52 and S53†). 1–4 were also subjected to a few anticoagulant activity assays,21 and 2 showed weak inhibitory activities against ADP and AA induced platelet aggregation in rabbits (inhibitory rate = 39.2 ± 10.7% and 15.9 ± 10.3%, respectively) (Tables S55–S57†). Moreover, 1–4 were evaluated for neurite out-growth-promoting activities in PC-12 cells.22 Unfortunately, none of them were found to be active (Table S54 and Fig. S37†). The deficiency in sample quantity hampered further bioactivity evaluation.
Conclusions
In summary, maoeriocalysin A (1), an unprecedented 4,5-seco-3,5-cyclo-7,20-epoxy-ent-kaurane diterpenoid, together with three rare 9,10-seco-7,20-epoxy-ent-kaurane diterpenoids, maoeriocalysins B–D (2–4), were isolated from I. eriocalyx. To clarify their intricate structures, quantum chemical calculation methods and quantitative interproton distance analysis were intensively exploited in the present research. Their robustness in structure elucidation of diterpenoids, whether in configurational or constitutional aspects, was clearly demonstrated. In particular, despite their great significance in stereochemical studies of natural products, NOE related techniques (for example, 1D or 2D ROESY experiments) are also responsible for the majority of the configurational misassignments.23 However, an “upgrade” from traditional qualitative analysis to quantitative analysis of the NOE data is expected to substantially improve the situation. In conclusion, the present research not only enriched the diversity of the diterpenoid family, but also expanded the toolbox for structure determination of diterpenoids from Isodon species.Experimental section
General experimental procedures
Melting points were obtained on an XRC-1 apparatus and were uncorrected. 1D and 2D NMR spectra were recorded on 800 MHz NMR spectrometers for 1H, and 200 MHz for 13C. Chemical shifts (δ) were given in parts per million (ppm) with reference to the solvent signals and coupling constants were expressed in hertz. Optical rotations were measured in MeOH using a digital polarimeter. UV data were recorded from 190 to 400 nm in MeOH or acetonitrile using a spectrophotometer, and UV spectra are plotted in absorbance units (AU). Experimental ECD spectra were recorded from 190 to 400 nm in MeOH or acetonitrile on a spectrophotometer. HRESIMS was performed on a triple quadrupole mass spectrometer. Column chromatography was performed with silica gel (200–300 mesh), Lichroprep RP-18 gel (40–63 mm), MCI gel (75–150 mm), and Sephadex LH-20 gel (40–70 mm). Preparative HPLC with a dual wavelength detector was performed using an ODS column (7 μm, 20 mm × 25 cm, 15 mL min−1). Semipreparative HPLC with a DAD detector was performed using an RP-18 column (5 μm, 9.4 mm × 25 cm, 3 mL min−1). Fractions were monitored by TLC and spots were visualized by heating silica gel plates sprayed with 10% H2SO4 in EtOH. All solvents were distilled prior to use.Plant material
The leaves and stems of Isodon eriocalyx were collected from the Chengjiang prefecture, Yuxi city, Yunnan province, P. R. of China, in August 2008. Voucher specimens (KIB 2008080601) were deposited at the State Key Laboratory of Phytochemistry and Plant Resources in West China, Kunming Institute of Botany (KIB), Chinese Academy of Sciences (CAS), and were identified by Prof. Xi Wen Li (KIB, CAS).Extraction and isolation
The air-dried and powdered stems and leaves of I. eriocalyx (25.0 kg) were extracted four times with 70% aqueous acetone (4 × 100 L) at room temperature and concentrated under reduced pressure to give a crude extract (1330.0 g), which was then extracted with EtOAc. The EtOAc part (1330.0 g) was chromatographed on a silica gel column with a gradient elution of CHCl3/Me2CO (1![[thin space (1/6-em)]](https://www.rsc.org/images/entities/char_2009.gif) :
:![[thin space (1/6-em)]](https://www.rsc.org/images/entities/char_2009.gif) 0 to 0
0 to 0![[thin space (1/6-em)]](https://www.rsc.org/images/entities/char_2009.gif) :
:![[thin space (1/6-em)]](https://www.rsc.org/images/entities/char_2009.gif) 1) to furnish seven fractions A–G. Fraction B (390.0 g) was decolorized on an MCI gel with 90
1) to furnish seven fractions A–G. Fraction B (390.0 g) was decolorized on an MCI gel with 90![[thin space (1/6-em)]](https://www.rsc.org/images/entities/char_2009.gif) :
:![[thin space (1/6-em)]](https://www.rsc.org/images/entities/char_2009.gif) 10 MeOH/H2O to obtain a yellow gum (280.0 g). Fraction B (280.0 g) was chromatographed with a gradient elution of MeOH/H2O (3
10 MeOH/H2O to obtain a yellow gum (280.0 g). Fraction B (280.0 g) was chromatographed with a gradient elution of MeOH/H2O (3![[thin space (1/6-em)]](https://www.rsc.org/images/entities/char_2009.gif) :
:![[thin space (1/6-em)]](https://www.rsc.org/images/entities/char_2009.gif) 7 to 1
7 to 1![[thin space (1/6-em)]](https://www.rsc.org/images/entities/char_2009.gif) :
:![[thin space (1/6-em)]](https://www.rsc.org/images/entities/char_2009.gif) 0) on RP-18 to obtain fractions B1–B8. Fraction B4 (100.0 g) was chromatographed on a silica gel column MeOH/CHCl3 (50
0) on RP-18 to obtain fractions B1–B8. Fraction B4 (100.0 g) was chromatographed on a silica gel column MeOH/CHCl3 (50![[thin space (1/6-em)]](https://www.rsc.org/images/entities/char_2009.gif) :
:![[thin space (1/6-em)]](https://www.rsc.org/images/entities/char_2009.gif) 1 to 1
1 to 1![[thin space (1/6-em)]](https://www.rsc.org/images/entities/char_2009.gif) :
:![[thin space (1/6-em)]](https://www.rsc.org/images/entities/char_2009.gif) 1) to afford seven fractions. Fraction B4d (21.0 g) was chromatographed on a silica gel column (petroleum ether/Me2CO 10
1) to afford seven fractions. Fraction B4d (21.0 g) was chromatographed on a silica gel column (petroleum ether/Me2CO 10![[thin space (1/6-em)]](https://www.rsc.org/images/entities/char_2009.gif) :
:![[thin space (1/6-em)]](https://www.rsc.org/images/entities/char_2009.gif) 1 to 0
1 to 0![[thin space (1/6-em)]](https://www.rsc.org/images/entities/char_2009.gif) :
:![[thin space (1/6-em)]](https://www.rsc.org/images/entities/char_2009.gif) 1) and was chromatographed on Sephadex LH-20 gel MeOH/CHCl3 (1
1) and was chromatographed on Sephadex LH-20 gel MeOH/CHCl3 (1![[thin space (1/6-em)]](https://www.rsc.org/images/entities/char_2009.gif) :
:![[thin space (1/6-em)]](https://www.rsc.org/images/entities/char_2009.gif) 1) to afford six fractions. Fraction B4dI (2.8 g) was repeatedly separated by preparative HPLC on an Rp-18 column (15 mL min−1, detector UV λmax 210 nm and 230 nm, respectively, MeCN/H2O 3
1) to afford six fractions. Fraction B4dI (2.8 g) was repeatedly separated by preparative HPLC on an Rp-18 column (15 mL min−1, detector UV λmax 210 nm and 230 nm, respectively, MeCN/H2O 3![[thin space (1/6-em)]](https://www.rsc.org/images/entities/char_2009.gif) :
:![[thin space (1/6-em)]](https://www.rsc.org/images/entities/char_2009.gif) 7 to 6
7 to 6![[thin space (1/6-em)]](https://www.rsc.org/images/entities/char_2009.gif) :
:![[thin space (1/6-em)]](https://www.rsc.org/images/entities/char_2009.gif) 4) to obtain ten fractions. Fraction B4dIa (3.8 mg) was subjected to semipreparative HPLC (3 mL min−1, detector UV λmax 210 nm and 230 nm, respectively, MeCN/H2O 4.5
4) to obtain ten fractions. Fraction B4dIa (3.8 mg) was subjected to semipreparative HPLC (3 mL min−1, detector UV λmax 210 nm and 230 nm, respectively, MeCN/H2O 4.5![[thin space (1/6-em)]](https://www.rsc.org/images/entities/char_2009.gif) :
:![[thin space (1/6-em)]](https://www.rsc.org/images/entities/char_2009.gif) 5.5) to yield 1 (0.5 mg), 2 (1.1 mg), 3 (1.7 mg) and 4 (2.5 mg).
5.5) to yield 1 (0.5 mg), 2 (1.1 mg), 3 (1.7 mg) and 4 (2.5 mg).
![[thin space (1/6-em)]](https://www.rsc.org/images/entities/char_2009.gif) ε) 229 (2.91) nm; ECD (MeOH) λmax (Δε) 237 (+0.34) nm; 1H and 13C NMR data, see Table 1. HRESIMS m/z 427.1739 [M + Na]+ (calcd 427.1727).
ε) 229 (2.91) nm; ECD (MeOH) λmax (Δε) 237 (+0.34) nm; 1H and 13C NMR data, see Table 1. HRESIMS m/z 427.1739 [M + Na]+ (calcd 427.1727).
![[thin space (1/6-em)]](https://www.rsc.org/images/entities/char_2009.gif) ε) 227 (2.99) nm; ECD (MeOH) λmax (Δε) 223 (−1.01) nm; 1H and 13C NMR data, see Table 1. HRESIMS m/z 367.1522 [M + Na]+ (calcd 367.1516).
ε) 227 (2.99) nm; ECD (MeOH) λmax (Δε) 223 (−1.01) nm; 1H and 13C NMR data, see Table 1. HRESIMS m/z 367.1522 [M + Na]+ (calcd 367.1516).
![[thin space (1/6-em)]](https://www.rsc.org/images/entities/char_2009.gif) ε) 195 (2.99) 217 (2.72) nm; ECD (MeOH) λmax (Δε) 196 (+1.02) 220 (−0.7) nm; 1H and 13C NMR data, see Table 1. HRESIMS m/z 411.1784 [M + Na]+ (calcd 411.1778).
ε) 195 (2.99) 217 (2.72) nm; ECD (MeOH) λmax (Δε) 196 (+1.02) 220 (−0.7) nm; 1H and 13C NMR data, see Table 1. HRESIMS m/z 411.1784 [M + Na]+ (calcd 411.1778).
![[thin space (1/6-em)]](https://www.rsc.org/images/entities/char_2009.gif) ε) 190 (3.02) nm; ECD (MeOH) λmax (Δε) 192 (+1.02) nm; 1H and 13C NMR data, see Table 1. HRESIMS m/z 471.1994 [M + Na]+ (calcd 471.1989).
ε) 190 (3.02) nm; ECD (MeOH) λmax (Δε) 192 (+1.02) nm; 1H and 13C NMR data, see Table 1. HRESIMS m/z 471.1994 [M + Na]+ (calcd 471.1989).
X-ray crystal structure analysis
Crystals of 2 were obtained in MeOH. Intensity data were collected at 100 K on a Bruker APEX DUO diffractometer equipped with an APEX II CCD using Cu Kα radiation. Cell refinement and data reduction were performed with Bruker SAINT. The structures were solved by direct methods using SHELXS-97,24 and refinements were performed using full-matrix least-squares, with anisotropic displacement parameters for non-hydrogen atoms. The hydrogen atoms were placed in calculated positions and refined using a riding model. Crystallographic data (excluding structure factor tables) for the reported structures have been deposited with the Cambridge Crystallographic Data Center (CCDC) as supplementary publication no. CCDC 1860051 for 2.†![[thin space (1/6-em)]](https://www.rsc.org/images/entities/char_2009.gif) 010 reflections measured, 3157 independent reflections (Rint = 0.0539). The final R1 values were 0.0353 (I > 2σ(I)). The final wR(F2) values were 0.0939 (I > 2σ(I)). The final R1 values were 0.0356 (all data). The final wR(F2) values were 0.0942 (all data). The goodness of fit on F2 was 1.072. Flack parameter = 0.07(5).
010 reflections measured, 3157 independent reflections (Rint = 0.0539). The final R1 values were 0.0353 (I > 2σ(I)). The final wR(F2) values were 0.0939 (I > 2σ(I)). The final R1 values were 0.0356 (all data). The final wR(F2) values were 0.0942 (all data). The goodness of fit on F2 was 1.072. Flack parameter = 0.07(5).
Computational methods
Conformational analysis was initially performed in Spartan'16 (Wavefunction, Irvine, CA, USA, 2016) using the Monte Carlo algorithm and Merck molecular force field (MMFF) with standard parameters and convergence criteria. The conformers within an energy window of 5 kcal mol−1 were optimized with DFT calculations at the M06-2X/def2-SVP level of theory with Grimme's D3 correction25 using the Gaussian 09 program,26 and frequency analysis was run at the same level of theory to ensure that no imaginary frequencies exist and to obtain the Gibbs free energies for the following population analysis. Room-temperature (298.15 K) equilibrium populations were calculated according to the Boltzmann distribution law. Those conformers accounting for over 99% population were subjected to subsequent calculations.As for the calculation of 1H and 13C chemical shifts, nuclear shielding constants were calculated at the MPW1PW91-SCRF/6-31G(d,p) level in corresponding solvents with the IEFPCM solvent model, and the obtained shielding constants were converted to chemical shifts by referencing to TMS at 0 ppm (δcalcd = σTMS − σcalcd), where σTMS was the shielding constant of TMS calculated at the same level of theory. For each possible candidate, the parameters a and b of the linear regression δcal = aδexp + b; the correlation coefficient, R2; the mean absolute error (MAE) defined as  ; the corrected mean absolute error, CMAE, defined as
  , where δcorr = (δcal − b)/a, were calculated. The DP4+ probabilities of each possible candidate were calculated with the EXCEL spreadsheet provided by Sarotti et al.19
Spin–spin coupling constants (SSCCs) of 4a–4e were calculated at the B972/PCJ-1 level of theory in chloroform with the IEFPCM solvent model. “Total nuclear spin–spin coupling J (Hz)” was extracted from the output files as the results. Time-dependent density-functional theory (TDDFT) ECD calculations were run at the CAM-B3LYP/def2-SVP level of theory in MeOH with the IEFPCM solvent model. For each conformer, 30 excited states were calculated. The calculated ECD curves were generated using Multiwfn 3.6 software.27
Quantitative interproton distance analysis
The mean absolute deviation (MAD) was defined as:rcal was the calculated interproton distances (Å) extracted from DFT optimized conformers obtained with the method as stated above; for molecules with multiple conformers, rcal were obtained by weighting interproton distances from individual conformers according to their Boltzmann populations:
| rcal = (∑pi × r−6ISi)−1/6 |
To obtain Boltzmann averaged distances between a single proton (H) and three chemically equivalent methyl protons (Ha, Hb, and Hc), the following equation is used:
Where r is the interproton distance, and η is the ROESY signal intensity derived from the 2D ROESY spectrum. Peak amplitude normalisation for an improved cross-relaxation (PANIC) method was employed by setting the irradiated peak in each slice of the 2D ROESY spectrum to 1000 intensity units as shown in Fig. S4–S14.† The distance between methylene protons H-20a and H-20b (1.79 Å) in 1 and 4, which were insensitive to molecular conformation, was chosen to be the reference distance (rref).
Conflicts of interest
There are no conflicts to declare.Acknowledgements
This work was financially supported by the National Natural Science Foundation of China (Grants 81673329 and 81874298).Notes and references
- C. Y. Wu and H. W. Li, Flora of China, Science Press, Beijing, 1994 Search PubMed.
- (a) E. Fujita and M. Node, Tamm, Springer-Verlag, Vienna, 1984, vol. 46, pp. 77–157 Search PubMed; (b) H. D. Sun, S. X. Huang and Q. B. Han, Nat. Prod. Rep., 2006, 23, 673–698 RSC; (c) M. Liu, W. G. Wang, H. D. Sun and J. X. Pu, Nat. Prod. Rep., 2017, 34, 1090–1140 RSC.
- H. D. Sun, Y. L. Xu and B. Jiang, Diterpenoids from Isodon Species, Science Press, Beijing, China, 2001 Search PubMed.
- (a) S. H. Li, J. Wang, X. M. Niu, Y. H. Shen, H. J. Zhang, H. D. Sun, M. L. Li, Q. E. Tian, Y. Lu, P. Cao and Q. T. Zheng, Org. Lett., 2004, 6, 4327–4330 CrossRef CAS; (b) Q. B. Han, S. Cheung, J. Tai, C. F. Qiao, J. Z. Song, T. F. Tso, H. D. Sun and H. X. Xu, Org. Lett., 2006, 8, 4727–4730 CrossRef CAS; (c) X. N. Li, J. X. Pu, X. Du, L. G. Lou, L. M. Li, S. X. Huang, B. Zhao, M. Zhang, F. He, X. Luo, W. L. Xiao and H. D. Sun, J. Nat. Prod., 2010, 73, 1803–1809 CrossRef CAS PubMed.
- (a) Z. Y. Wang and Y. L. Xu, Acta Bot. Yunnanica, 1982, 4, 407–411 CAS; (b) L. Wang, W. L. Zhao, J. S. Yan, P. Liu, H. P. Sun, G. B. Zhou, Z. Y. Weng, W. L. Wu, X. Q. Weng, X. J. Sun, Z. Chen, H. D. Sun and S. J. Chen, Cell Death Differ., 2006, 14, 306 CrossRef; (c) Y. W. Zhang, X. X. Jiang, Q. S. Chen, W. Y. Shi, L. Wang, H. D. Sun, Z. X. Shen, Z. Chen, S. J. Chen and W. L. Zhao, Exp. Hematol., 2010, 38, 191–201 CrossRef CAS; (d) Y. Lu, B. Chen, J. H. Song, T. Zhen, B. Y. Wang, X. Li, P. Liu, X. Yang, Q. L. Zhang, X. D. Xi, S. D. Chen, J. P. Zuo, Z. Chen and S. J. Chen, Proc. Natl. Acad. Sci. U. S. A., 2013, 110, 2258 CrossRef CAS; (e) A. Rasul, J. M. Liu, Y. Liu, F. M. Millimouno, X. W. Wang, I. Tsuji, T. Yamamura, J. Li and X. M. Li, Bangladesh J. Pharmacol., 2013, 8, 8 Search PubMed; (f) X. K. Yu, L. He, P. Cao and Q. Yu, PLoS One, 2015, 10, 1–18 Search PubMed; (g) X. N. Zhou, G. G. Yue, M. H. Liu, Z. L. Zuo, J. K. Lee, M. Y. Li, S. K. Tsui, K. Fung, H. D. Sun, J. X. Pu and C. B. Lau, Oncotarget, 2016, 7, 82820–82835 Search PubMed; (h) W. C. Yun, M. Lu, J. S. Zhu, W. X. Chen and N. W. Chen, Mol. Med. Rep., 2016, 13, 2235–2240 CrossRef; (i) X. N. Zhou, G. G. L. Yue, A. M. L. Chan, S. K. W. Tsui, K. P. Fung, H. D. Sun, J. X. Pu and C. B. S. Lau, Biochem. Pharmacol., 2017, 142, 58–70 CrossRef CAS; (j) L. Li, S. L. Zhao, G. G. L. Yue, T. P. Wong, J. X. Pu, H. D. Sun, K. P. Fung, P. C. Leung, Q. B. Han, C. B. S. Lau and P. S. Leung, Phytomedicine, 2018, 44, 56–64 CrossRef CAS; (k) X. N. Zhou, C. Y. Cao, A. T. Y. Wan, G. G. L. Yue, F. H. F. Kwok, K. P. Fung, H. D. Sun, C. B. S. Lau, P. T. Z. Puno and S. K. W. Tsui, Mol. Omics, 2018, 14, 156–169 RSC.
- (a) J. X. Gong, G. Lin, W. B. Sun, C. C. Li and Z. Yang, J. Am. Chem. Soc., 2010, 132, 16745–16746 CrossRef CAS; (b) F. Peng and S. J. Danishefsky, J. Am. Chem. Soc., 2012, 134, 18860–18867 CrossRef CAS; (c) P. Lu, Z. H. Gu and A. Zakarian, J. Am. Chem. Soc., 2013, 135, 14552–14555 CrossRef CAS; (d) P. Lu, A. Mailyan, Z. H. Gu, D. M. Guptill, H. B. Wang, H. M. L. Davies and A. Zakarian, J. Am. Chem. Soc., 2014, 136, 17738–17749 CrossRef CAS; (e) C. W. Zheng, L. Dubovyk, K. E. Lazarski and R. J. Thomson, J. Am. Chem. Soc., 2014, 136, 17750–17756 CrossRef CAS; (f) W. B. Zhang, W. B. Shao, F. Z. Li, J. X. Gong and Z. Yang, Chem. – Asian J., 2015, 10, 1874–1880 CrossRef CAS; (g) A. Cernijenko, R. Risgaard and P. S. Baran, J. Am. Chem. Soc., 2016, 138, 9425–9428 CrossRef CAS.
- C. B. Li, J. Zhou and H. D. Sun, Acta Bot. Yunnanica, 1985, 7, 115–116 CAS.
- K. Nishimura, Y. Hitotsuyanagi, K.-I. Sakakura, K. Fujita, S. Tachihara, H. Fukaya, Y. Aoyagi, T. Hasuda, T. Kinoshita and K. Takeya, Tetrahedron, 2007, 63, 4558–4562 CrossRef CAS.
- A. C. Pinto, S. K. Doprado, R. B. Filho, B. F. Raimundo, W. E. Hull, A. Neszmelyi and G. Lukacs, Tetrahedron Lett., 1982, 23, 5267–5270 CrossRef CAS.
- D. J. Tantillo, Nat. Prod. Rep., 2013, 30, 1079–1086 RSC.
- D. O. Cicero, G. Barbato and R. Bazzo, J. Am. Chem. Soc., 1995, 117, 1027–1033 CrossRef CAS.
- (a) C. P. Butts, C. R. Jones, E. C. Towers, J. L. Flynn, L. Appleby and N. J. Barron, Org. Biomol. Chem., 2011, 9, 177–184 RSC; (b) C. P. Butts, C. R. Jones, Z. Song and T. J. Simpson, Chem. Commun., 2012, 48, 9023–9025 RSC; (c) M. G. Chini, C. R. Jones, A. Zampella, M. V. D'Auria, B. Renga, S. Fiorucci, C. P. Butts and G. Bifulco, J. Org. Chem., 2012, 77, 1489–1496 CrossRef CAS; (d) J. Wu, P. Lorenzo, S. Zhong, M. Ali, C. P. Butts, E. L. Myers and V. K. Aggarwal, Nature, 2017, 547, 436–440 CrossRef CAS.
- H.-B. Zhang, X. Du, J.-X. Pu, Y.-Y. Wang, F. He, Y. Zhao, X.-N. Li, X. Luo, W.-L. Xiao, Y. Li and H.-D. Sun, Tetrahedron Lett., 2010, 51, 4225–4228 CrossRef CAS.
- K. Jiao, H.-Y. Li, P. Zhang, H.-F. Pi, H.-L. Ruan and J.-Z. Wu, Chin. Chem. Lett., 2014, 25, 131–133 CrossRef CAS.
- W.-G. Wang, X. Du, X.-N. Li, H.-Y. Wu, X. Liu, S.-Z. Shang, R. Zhan, C.-Q. Liang, L.-M. Kong, Y. Li, J.-X. Pu and H.-D. Sun, Org. Lett., 2012, 14, 302–305 CrossRef CAS.
- (a) M. W. Lodewyk, M. R. Siebert and D. J. Tantillo, Chem. Rev., 2012, 112, 1839–1862 CrossRef CAS; (b) P. H. Willoughby, M. J. Jansma and T. R. Hoye, Nat. Protoc., 2014, 9, 643–660 CrossRef CAS.
- (a) S. Macur, B. T. Farmer and L. R. Brown, J. Magn. Reson., 1986, 70, 493–499 Search PubMed; (b) C. P. Butts, C. R. Jones, Z. S. Song and T. J. Simpson, Chem. Commun., 2012, 48, 9023–9025 RSC.
- (a) G. Pescitelli and T. Bruhn, Chirality, 2016, 28, 466–474 CrossRef CAS; (b) S. H. Monika and A. Jochen, Annu. Rev. Phys. Chem., 2017, 68, 399–420 CrossRef.
- N. Grimblat, M. M. Zanardi and A. M. Sarotti, J. Org. Chem., 2015, 80, 12526–12534 CrossRef CAS.
- G. L. Ellman, K. D. Courtney, V. Andres and R. M. Featherstone, Biochem. Pharmacol., 1961, 7, 88–95 CrossRef CAS.
- G. V. Born, Nature, 1962, 194, 927–929 CrossRef CAS.
- L. A. Greene and A. S. Tischler, Proc. Natl. Acad. Sci. U. S. A., 1976, 73, 2424–2428 CrossRef CAS.
- (a) T. L. Suyama, W. H. Gerwick and K. L. McPhail, Bioorg. Med. Chem., 2011, 19, 6675–6701 CrossRef CAS; (b) B. K. Chhetri, S. Lavoie, A. M. Sweeney-Jones and J. Kubanek, Nat. Prod. Rep., 2018, 35, 514–531 RSC.
- G. M. Sheldrick and T. R. Schneider, in Methods Enzymol, Academic Press, 1997 Search PubMed.
- S. Grimme, J. Antony, S. Ehrlich and H. Krieg, J. Chem. Phys., 2010, 132, 154104 CrossRef.
- M. J. Frisch, G. W. Trucks, H. B. Schlegel, G. E. Scuseria, M. A. Robb, J. R. Cheeseman, G. Scalmani, V. Barone, G. A. Petersson, H. Nakatsuji, X. Li, M. Caricato, A. V. Marenich, J. Bloino, B. G. Janesko, R. Gomperts, B. Mennucci, H. P. Hratchian, J. V. Ortiz, A. F. Izmaylov, J. L. Sonnenberg, L. Williams, F. Ding, F. Lipparini, F. Egidi, J. Goings, B. Peng, A. Petrone, T. Henderson, D. Ranasinghe, V. G. Zakrzewski, J. Gao, N. Rega, G. Zheng, W. Liang, M. Hada, M. Ehara, K. Toyota, R. Fukuda, J. Hasegawa, M. Ishida, T. Nakajima, Y. Honda, O. Kitao, H. Nakai, T. Vreven, K. Throssell, J. A. Montgomery Jr., J. E. Peralta, F. Ogliaro, M. J. Bearpark, J. J. Heyd, E. N. Brothers, K. N. Kudin, V. N. Staroverov, T. A. Keith, R. Kobayashi, J. Normand, K. Raghavachari, A. P. Rendell, J. C. Burant, S. S. Iyengar, J. Tomasi, M. Cossi, J. M. Millam, M. Klene, C. Adamo, R. Cammi, J. W. Ochterski, R. L. Martin, K. Morokuma, O. Farkas, J. B. Foresman and D. J. Fox, Gaussian 09, Revision E.01, Gaussian, Inc., Wallingford CT, 2010 Search PubMed.
- T. Lu and F. Chen, J. Comput. Chem., 2011, 33, 580–592 CrossRef.
Footnotes |
| † Electronic supplementary information (ESI) available: X-ray crystal data analysis of 2; QIDA of 1 and 4; computational results and relevant data of 1, 3–4; results of bioactivity evaluation; HRESIMS, 1D and 2D NMR, ECD, UV, and ORD spectra of 1–4. CCDC 1860051. For ESI and crystallographic data in CIF or other electronic format see DOI: 10.1039/c8qo01007b |
| ‡ These authors contributed equally to the work. |
| This journal is © the Partner Organisations 2019 |

