Heating-induced abnormal increase in Yb3+ excited state lifetime and its potential application in lifetime luminescence nanothermometry†
Zeliang
Ji
ab,
Yao
Cheng
 *a,
Xiangshui
Cui
a,
Hang
Lin
 a,
Ju
Xu
a and
Yuansheng
Wang
 *a
*a
aCAS Key Laboratory of Design and Assembly of Functional Nanostructures, and Fujian Provincial Key Laboratory of Nanomaterials, Fujian Institute of Research on the Structure of Matter, Chinese Academy of Sciences, Fuzhou, Fujian 350002, PR China. E-mail: chengyao@fjirsm.ac.cn; yswang@fjirsm.ac.cn
bCollege of Chemistry and Materials Science, Fujian Normal University, Fuzhou, Fujian 350007, PR China
First published on 13th November 2018
Abstract
The heating-induced unprecedented monotonous increase in Yb3+ excited state (2F5/2) lifetime is found in Nd3+/Yb3+ codoped fluoride nanoparticles, which is proved to originate from the alleviation of energy migration-mediated surface quenching with elevated temperature. This unique phenomenon is evaluated for thermometric performance in terms of lifetime luminescence thermometry, and the maximum absolute/relative temperature sensitivity (Sa/Sr) reaches as high as 2.68 μs K−1/1.59% K−1 in the biological temperature region, indicating that the studied nanomaterial can offer great potential for lifetime luminescence thermometry in biological areas.
1. Introduction
Luminescence nanothermometry has gained considerable attention in the past decades since it allows for non-contact thermal reading with great spatial as well as temporal resolution that can enable intracellular thermal mapping, thus providing outstanding opportunities for biomedical research.1–3 Luminescence thermometry relies on temperature-dependent optical parameters, including intensity, spectral position, band shape and lifetime, for thermal reading. Among these different spectroscopic schemes, lifetime luminescence nanothermometry (LLNT) is of special importance as it holds a number of advantages over the rest.4–8 For instance, one of the key features of luminescence lifetime is its insensitivity to intensity artifacts induced by variation in luminophor concentration and/or excitation intensity, which enables LLNT to circumvent the corresponding measurement error that is intrinsic to intensity-based thermometry. In addition, as it can accomplish signal acquisition within a time interval on the order of luminescence lifetime, LLNT allows for a much faster thermal reading rate with respect to other spectroscopic schemes. This is preferable for intracellular thermal mapping since rapid thermal reading is in favor of dynamic thermal mapping and simultaneously minimizes the excitation-induced local heating that could lead to substantial errors within the biological temperature region. Recently, with the successful application of fluorescence lifetime imaging microscopy (FLIM) in biomedical areas, LLNT has received increasing attention since lifetime thermometry constitutes one of the most important functions of FLIM, i.e., fluorescence lifetime thermal imaging.1,2,9–11So far, different kinds of luminescence materials have been evaluated as potential probe candidates for LLNT, and they include quantum dots, organic dyes, lanthanide-doped nanocrystals and complexes.12–20 Drastic luminescence thermal quenching for both quantum dots and organic dyes leads to highly temperature-sensitive reduction in luminescence lifetime within the biological temperature region, which demonstrates their great ability to function as good indicators for LLNT. However, with a feature lifetime falling in the ns region as is the case for both quantum dots and organic dyes, the requirement for measurement can become more costly. Meanwhile, a few ns is in the same order of lifetime of background autofluorescence, which adds to the difficulty in excluding the background noise from the signals.21,22 To address these problems, research has also been conducted for finding luminescence indicator materials with adequately long lifetimes. To this end, lanthanide ion (Ln3+)-activated luminescence materials are conceived as promising alternatives for LLNT due to their much longer luminescence lifetimes (usually in the μs to ms region) originating from the forbidden intra-4f transitions.23,24
For most temperature-sensitive phosphors, generally speaking, temperature increase is associated with decrease in the luminescence lifetime, which is usually ascribed to thermally induced increase in non-radiative de-excitation of excited states (thermal quenching). Therefore, a strong electron–phonon coupling system is preferred for LLNT as strong electron–phonon interactions facilitate such thermal quenching behavior.25,26 In this regard, Ln3+-activated phosphors seem not to be the best choice because the shielding of 4f electrons by outer 5s25p6 shells leads to a weak electron–phonon coupling feature of lanthanide ions, which endows intra-4f transitions of Ln3+ with the nature of less temperature sensitivity with respect to the scenarios for transition metal ions and semiconductor quantum dots. However, modification in the excited-state dynamics of Ln3+-activated phosphors can be achieved through nanoscale manipulation, which can also lead to significantly different temperature dependence of luminescence lifetime of Ln3+-activated nanophosphors when compared with that observed for their bulk counterparts. One typical example can be found in the recent study by our group concerning the size-dependent abnormal thermo-enhanced luminescence of ytterbium-doped nanoparticles, where the excited state (2F5/2) lifetime of Yb3+ can exhibit significant increase with increasing temperature when the nanoparticle size is controlled within a certain range.27 Such unique luminescence behavior indicates the potential ability of ytterbium-doped nanoparticles to work as indicators for LLNT. In the present study, we report the investigation on the temperature dependence of the excited state (2F5/2) lifetime of Yb3+ in ytterbium-doped fluoride nanoparticles and evaluate the corresponding luminescence lifetime thermometric performance within the biological temperature region. Aiming at thermal reading for biological applications, both the excitation and emission wavelengths prefer to locate within the so-called biological windows to maximize the penetration depth.28 This can be achieved by co-doping Nd3+ and Yb3+ into host nanoparticles, which allows excitation (Nd3+ absorption) in the first biological window and signal acquisition (Yb3+ emission) in the second biological window.
2. Experimental section
2.1 Chemical reagents
Oleic acid (OA, technical grade, 90%), 1-octadecene (ODE, technical grade, 90%), GdCl3·6H2O (99.999%), YbCl3·6H2O (99.998%) and NdCl3·6H2O (99.99%) were purchased from Sigma-Aldrich, and Sodium hydroxide (NaOH), ammonium fluoride (NH4F), methanol, ethanol and cyclohexane were supplied by Sinopharm Chemical Reagent Co., Ltd (Shanghai, China).2.2 Synthesis of β-NaGdF4:Yb3+/Nd3+ LNPs
The synthesis of β-NaGdF4:Yb3+/Nd3+ LNPs was conducted by a procedure modified from literature.27,29 In a typical experiment, certain required amounts of GdCl3·6H2O, YbCl3·6H2O and NdCl3·6H2O (in total 1 mmol) were mixed with OA (8 mL) and ODE (12 mL) in a 100 mL three-neck round-bottom flask. The resulting mixture was heated to 150 °C under N2 flow with constant stirring for about 30 min to form a clear solution and then cooled down to room temperature. Thereafter, methanol solution (10 mL) containing NH4F (4 mmol) and NaOH (2 mmol) was added and the solution was stirred at 65 °C for 30 min. After methanol was evaporated, the solution was heated to 280 °C under N2 flow with stirring for 60 min and then cooled down to room temperature naturally. The obtained LNPs were precipitated by addition of ethanol (15 mL), collected by centrifugation, washed with moderate cyclohexane and ethanol several times, and finally re-dispersed in cyclohexane for further use.2.3 Characterizations
X-ray diffraction (XRD) analyses of the samples were carried out with a powder diffractometer (Rigaku, Miniflex600) using Cu Kα radiation (λ = 1.5418 Å). Temperature-dependent powder XRD patterns were recorded using a Rigaku/Ultima-IV diffractometer (Japan) with a slit of 0.02° at a scanning rate of 0.5° min−1 using Cu Kα radiation (λ = 0.154 nm). Transmission electron microscopy (TEM), high-resolution TEM (HRTEM) and selected area electron diffraction (SAED) were performed with JEOL (JEM-2010) TEM operated at 200 kV. Down shifting luminescence (DSL) spectra were measured using an FLS 920 spectrofluorimeter (Edinburgh) with an external 808 nm diode laser (1 W) as the excitation source. The lifetime measurements were carried out on a customized UV to near-infrared steady-state and phosphorescence lifetime spectrometer (FSP920-C, Edinburgh) equipped with a tunable mid-band OPO pulse laser as the excitation source (410–2400 nm, 10 Hz, pulse width ≤5 ns, Vibrant 355II, OPOTEK). Temperature-dependent lifetime measurements were performed on a temperature controlling stage (THMS 600) with a tunable temperature range from 303 K to 343 K and heating rate of 30 K min−1. All the samples were in solid state for luminescence measurements.3. Results and discussion
Yb3+/Nd3+:NaGdF4 nanoparticles are synthesized by the co-precipitation method, which is described in the Experimental section. X-ray diffraction (XRD) analysis (Fig. 1) reveals the pure hexagonal phase of the as-synthesized samples.30 Transmission electron microscopy (TEM) observation (Fig. 2a) displays the general morphology of the nanoparticles, from which a size of around 18 nm for the nanoparticles can be confirmed. The excellent uniformity in size and shape of the nanoparticles has been demonstrated by the well-defined local 2D self-assembly patterns. Furthermore, high-resolution TEM experiment (Fig. 2b) confirms the single crystalline nature of the single nanoparticle. The emission spectrum for Yb3+/Nd3+:NaGdF4 nanoparticles under excitation of 808 nm, as shown in Fig. 3a, shows the characteristic feature of Yb3+ emissions with a relatively narrow peak at 976 nm and a broad shoulder from 980 to 1020 nm; this can be ascribed to the strong phonon coupling-induced broadening as well as clear crystal-field splitting of ground-state manifold, 2F7/2, and excited-state one, 2F5/2, as shown in Fig. 3b. It is noteworthy that the emission can be extended to the region of the second biological window due to the crystal-field splitting of ground-state and excited state manifolds. Aiming at the potential application in biological areas, we choose the emission at 1012 nm as the detection signal for the following lifetime measurements.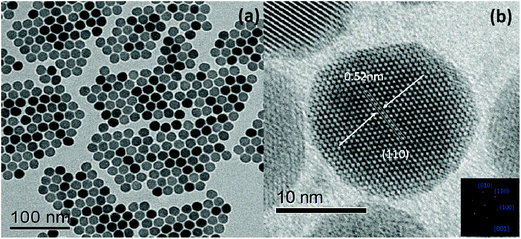 | ||
| Fig. 2 (a) TEM micrograph of NaGdF4:Yb3+/Nd3+ (20/1 mol%) LNPs. (b) HRTEM image of an individual nanocrystal and the corresponding Fourier-transform pattern. | ||
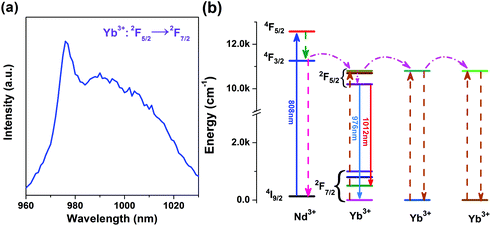 | ||
| Fig. 3 (a) Emission spectrum of the NaGdF4:Yb3+/Nd3+ (20/1 mol%) sample at room temperature. (b) Energy level diagrams of Yb3+ and Nd3+ and the energy transfer in Yb3+–Nd3+ system. | ||
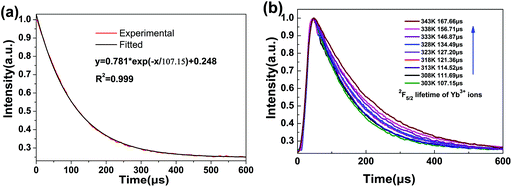
Fig. 4(a) displays the fluorescence decay profile of the 2F5/2 → 2F7/2(Yb3+) emission for NaGdF4:Yb3+/Nd3+ (20/1 mol%) LNPs at 303 K. The decay curve can be well fitted into a single exponential function I(t) = I0![[thin space (1/6-em)]](https://www.rsc.org/images/entities/char_2009.gif) exp(−t/τ), where I0 is the initial emission intensity at t = 0 and τ is the lifetime.31,32 Upon fitting, the obtained value for τ is 107.15 μs. Generally, both radiative and non-radiative relaxations contribute to the decay profile. For intra-4f transitions of Ln3+ ions, a relatively low radiative rate due to parity-forbidden transition leads to long lifetime (usually in the order of ms) of excited states. In contrast, non-radiative relaxations, either multi-phonon assisted or defect-induced relaxations, occur with much faster rates and result in much shorter lifetimes. Therefore, the significant difference in the relaxation rates between radiative and non-radiative relaxations should give a multiexponential decay profile, with each exponential component corresponding to one relaxation pathway. However, when one definite relaxation pathway dominates de-excitation over the others, the multiexponential decay profile can transform into a single-exponential one approximately. Such a scenario usually occurs for the Ln3+-activated luminescent nanocrystals since serious surface quenching can solely determine the decay profile due to the large specific surface area. As such, for the present case, the much shorter lifetime (τ = 107.15 μs) compared with the previously reported value for the bulk counterpart indicates that the single-exponential decay curve should be ascribed to the dominance of non-radiative decay pathways.
exp(−t/τ), where I0 is the initial emission intensity at t = 0 and τ is the lifetime.31,32 Upon fitting, the obtained value for τ is 107.15 μs. Generally, both radiative and non-radiative relaxations contribute to the decay profile. For intra-4f transitions of Ln3+ ions, a relatively low radiative rate due to parity-forbidden transition leads to long lifetime (usually in the order of ms) of excited states. In contrast, non-radiative relaxations, either multi-phonon assisted or defect-induced relaxations, occur with much faster rates and result in much shorter lifetimes. Therefore, the significant difference in the relaxation rates between radiative and non-radiative relaxations should give a multiexponential decay profile, with each exponential component corresponding to one relaxation pathway. However, when one definite relaxation pathway dominates de-excitation over the others, the multiexponential decay profile can transform into a single-exponential one approximately. Such a scenario usually occurs for the Ln3+-activated luminescent nanocrystals since serious surface quenching can solely determine the decay profile due to the large specific surface area. As such, for the present case, the much shorter lifetime (τ = 107.15 μs) compared with the previously reported value for the bulk counterpart indicates that the single-exponential decay curve should be ascribed to the dominance of non-radiative decay pathways.
The evolution of decay profile of 2F5/2 → 2F7/2(Yb3+) emission with elevated temperature is exhibited in Fig. 4(b). While all the decay curves exhibit a single-exponential feature, the decay slows down monotonically with elevated temperature, resulting in the derived lifetime value increasing from 107.15 μs at 303 K to 167.66 μs at 343 K. Such behavior is contrary to our common sense when non-radiative relaxation is responsible for the decay profile since higher temperature usually facilitates non-radiative relaxation (e.g., multiphonon relaxation) and hence speeds up the decay. To shed light on the mechanism beyond this unique phenomenon, luminescence quenching behaviors for Ln3+-activated luminescent nanocrystals should be considered. As is well known, surface quenching refers to the direct non-radiative energy transfer from the activator to surface traps. However, for high-concentration doping of activator with long excited state lifetime, rather than traditional surface quenching, the coupling between the long distance energy migration and surface quenching has been proven to be responsible for the major quenching process.33 For the present case, the relative high-concentration doping of Yb3+ allows a suitable Yb3+–Yb3+ distance that can enable long distance energy migration. In the meantime, LNP is small enough such that significant fraction of Yb3+ ions falls within the effective distance, which allows surface quenching of excitation energy via energy migration, as schematically shown in Fig. 5. Energy migration among Yb3+ ions can be actually regarded as the cascade energy transfer between two Yb3+ ions by means of dipolar–dipolar interactions, the efficiency of which is proportional to r−6 (where r is the average donor–acceptor distance). In this regard, the efficiency of the energy migration process through the cascade energy transfer of n pairs of Yb3+ ions should be proportional to r−6n, which endows the long distance energy migration process a very sensitive nature to the working distance between two neighboring Yb3+ ions. Therefore, the surface quenching based on energy migration can be strongly influenced by even slight variation in the working distance between Yb3+ ions. Actually, lattice thermal expansion offers such a possibility for the variation of working distance. The working distance between two neighboring Yb3+ ions increases with lattice expansion upon heating, which leads to decline in the efficiency for excitation energy transfer from interior Yb3+ to surface traps. In other words, the energy migration-induced surface quenching can be alleviated with elevated temperature, resulting in less steep decay profile and correspondingly longer lifetime. Please note that the lattice thermal expansion for as-synthesized NaGdF4:Yb3+/Nd3+ (20/1 mol%) LNPs has actually been confirmed by temperature-dependent XRD experiments, which show that all the main diffraction peaks gradually shift to lower angles as the temperature increases (ESI 1†).
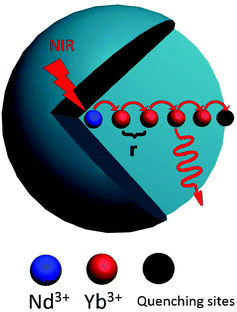 | ||
| Fig. 5 The mechanistic diagram showing the energy migration from interior activator to the surface quenching center. | ||
In addition to energy migration among the Yb3+ ions, the non-resonant energy transfer between Nd3+ and Yb3+ ions theoretically may influence the temperature dependence of the 2F5/2 → 2F7/2(Yb3+) lifetime as well since the probability of phonon-assisted energy transfer is temperature-dependent. The phonon-assisted energy transfer can be of either emission of phonon, which corresponds to Nd3+ → Yb3+ forward energy transfer, or absorption of phonon, which corresponds to Yb3+ → Nd3+ back energy transfer. Both processes can be promoted at an elevated temperature. The former enables the ability to increase the population of 2F5/2(Yb3+), which may lead to an increase in the lifetime upon heating. However, such small increase in lifetime can be easily offset/overcome by the lifetime decrease induced by multiphonon relaxation, which has been confirmed previously. In contrast, Yb3+ → Nd3+ back energy transfer tends to depopulate 2F5/2(Yb3+) and results in a similar decrease in lifetime to that observed for multiphonon relaxation at an elevated temperature. At high Yb3+ doping concentration (≥20%), however, such Yb3+ → Nd3+ back energy transfer can be ignored due to high efficiency of energy migration among the Yb3+ ions. From these considerations, it is inferred that the temperature dependence of energy transfer between Nd3+ and Yb3+ imposes no significant influence on the variation of lifetime for the present case.
Now that the heating-induced significant increase in the lifetime has been demonstrated, we now evaluate the potential ability of the nanocrystals for LLNT. The plot of calculated lifetime value (τ, μs) vs. temperature (T, K) is presented in Fig. 6a, where the dependence of lifetime on temperature can be well fitted by the following equation:
τ = 80.16 + 0.00262![[thin space (1/6-em)]](https://www.rsc.org/images/entities/char_2009.gif) exp(0.03039 × T). exp(0.03039 × T). | (1) |
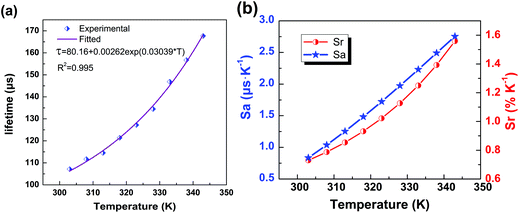 | ||
| Fig. 6 (a) The experimentally measured and exponentially fitted plots of lifetime τ versus temperature T. (b) The calculated absolute sensitivity Sa and relative sensitivity Srversus temperature. | ||
From the fitting results, accordingly, the absolute temperature sensitivity (Sa) and relative temperature sensitivity (Sr) are calculated according to the following equations:34
 | (2) |
As displayed in Fig. 6b, the maximum Sa and Sr values reach as high as 2.68 μs K−1 and 1.59% K−1, respectively. Temperature-recycle measurements, as shown in Fig. 7, demonstrate that the nanocrystals can provide good thermal sensing repeatability, which is of great importance for practical applications.
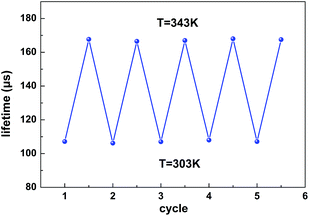 | ||
| Fig. 7 The lifetime temperature-recycle measurements over 5 cycles of heating and cooling between 303 K and 343 K. | ||
As far as luminescence thermometry for biological application is concerned, the Stokes NIR-absorbing-NIR-emitting nanocrystals are preferred taking into consideration deep signal penetrating depth as well as high quantum efficiency (compared with up-conversion/anti-Stokes process). In this regard, the combination of Nd3+ with Yb3+ has become one recent focus for luminescence thermometry, where the luminescence intensity ratio between emissions from Nd3+ and Yb3+ is usually adopted as the indicator.35,36 To the best of our knowledge, there are only few reports concerning the adoption of excited state lifetime for thermometric purpose in terms of Nd3+–Yb3+ combination probably due to insensitivity of corresponding excited state lifetime to temperature within the biological temperature region. The present results offer a potential for Nd3+–Yb3+ combination to work as an LLNT indicator since the overall thermometric performance is among the best, as indicated by comparison with different previously reported LLNT materials in Table 1.
| Materials | λ ex BWa | λ em BWa | Temperature range (K) | τRT | Trend for lifetime with elevated T | Max. Sr (%K−1) | Ref. |
|---|---|---|---|---|---|---|---|
| a BW is short for biological window. | |||||||
| CdSe quantum dots | No | No | 300–323 | 20 ns | Decrease | 0.08 | 12 |
| CdTe quantum dots | No | No | 300–323 | 14 ns | Decrease | 1.7 | 12 |
| Ag2S NPs | Yes | Yes | 293–323 | 180 ns | Decrease | 3–4 | 13 |
| Carbon dots | No | No | 275–353 | 10.5 ns | Decrease | 1.79 | 14 |
| Rhodamine B | Yes | No | 283–363 | 1.5 ns | Decrease | 3 | 15 |
| Poly(DBD-AE-co-NOPAM) | No | No | 296–311 | 3 ns | Increase | 6 | 9 |
| Au nanocluster | No | No | 283–318 | 850 ns | Decrease | 1.3 | 2 |
| Ce-YAG nanocrystals | No | No | 280–350 | 25 ns | Decrease | 1 | 16 |
| Er3+,Tm3+, Yb3+:La2O3 | No | No | 298–333 | 10 μs | Decrease | 0.67 | 17 |
| Eu3+:La2O2S | No | No | 283–323 | 4 μs | Decrease | 1.37 | 18 |
| Er3+,Yb3+:NaY2F5O NPs | No | No | 298–333 | 160 μs | Decrease | 1.5 | 19 |
| Er3+,Yb3+:NaYF4 NPs | No | No | 298–333 | 300 μs | Decrease | 0.54 | 19 |
| Eu-Complex | No | No | 273–343 | 400 μs | Decrease | 2 | 20 |
| Tb-Complex | No | No | 273–343 | 850 μs | Decrease | 1.2 | 20 |
| Nd3+:Yb3+:NaGdF4 NPs | Yes | Yes | 303–343 | 107 μs | Increase | 1.59 | This Work |
4. Conclusion
Owing to alleviation of energy migration-mediated surface quenching with elevated temperature, the excited state (2F5/2) lifetime of Yb3+ in Nd3+/Yb3+:NaGdF4 nanocrystals monotonously increases during heating in the temperature range from 303 K to 343 K. It is experimentally demonstrated that this unique phenomenon can be utilized for lifetime luminescence thermometry, especially in the biological areas.Conflicts of interest
There are no conflicts to declare.Acknowledgements
This work is supported by the National Natural Science Foundation of China (11774346, 11674318, 51472242, 51872288).References
- K. Okabe, N. Inada, C. Gota, Y. Harada, T. Funatsu and S. Uchiyama, Nat. Commun., 2012, 3, 705 CrossRef PubMed.
- L. Shang, F. Stockmar, N. Azadfar and G. U. Nienhaus, Angew. Chem., Int. Ed., 2013, 52, 11154–11157 CrossRef CAS PubMed.
- X. D. Wang, O. S. Wolfbeis and R. J. Meier, Chem. Soc. Rev., 2013, 42, 7834–7869 RSC.
- D. Jaque and F. Vetrone, Nanoscale, 2012, 4, 4301–4326 RSC.
- E. J. McLaurin, L. R. Bradshaw and D. R. Gamelin, Chem. Mater., 2013, 25, 1283–1292 CrossRef CAS.
- Y. Cheng, Y. Gao, H. Lin, F. Huang and Y. S. Wang, J. Mater. Chem. C, 2018, 6, 7462–7478 RSC.
- D. Q. Chen, Z. Y. Wan, Y. Zhou and Z. G. Ji, J. Eur. Ceram. Soc., 2015, 35, 4211–4216 CrossRef CAS.
- Y. Gao, F. Huang, H. Lin, J. C. Zhou, J. Xu and Y. S. Wang, Adv. Funct. Mater., 2016, 26, 3139–3145 CrossRef CAS.
- P. R. Selvin, Nat. Struct. Mol. Biol., 2000, 7, 730 CrossRef CAS PubMed.
- D. Elson, J. Requejo-Isidro, I. Munro, F. Reavell, J. Seigel, K. Suhling, P. Tadrous, R. Benninger, P. Lanigan, J. McGinty, C. Talbot, B. Treanor, S. Webb, A. Sandison, A. Wallace, D. Davis, J. Lever, M. Neil, D. Phillips, G. Stamp and P. French, Photochem. Photobiol. Sci., 2004, 3, 795 RSC.
- E. M. Graham, K. Iwai, S. Uchiyama, A. Prasanna de Silva, S. W. Magennis and A. C. Jones, Lab Chip, 2010, 10, 1267–1273 RSC.
- P. Haro-González, L. Martínez-Maestro, I. Martín, J. García-Solé and D. Jaque, Small, 2012, 8, 2652–2658 CrossRef PubMed.
- H. D. Santos, D. Ruiz, G. Lifante, C. Jacinto, B. H. Juarez and D. Jaque, Nanoscale, 2017, 9, 2505–2513 RSC.
- S. Kalytchuk, K. Poláková, Y. Wang, J. P. Froning, K. Cepe, A. L. Rogach and R. Zbořil, ACS Nano, 2017, 11, 1432–1442 CrossRef CAS PubMed.
- R. K. Benninger, Y. Koc, O. Hofmann, J. Requejo-Isidro, M. A. Neil, P. M. French and A. J. DeMello, Anal. Chem., 2006, 78, 2272–2278 CrossRef CAS PubMed.
- S. W. Allison, G. T. Gillies, A. J. Rondinone and M. R. Cates, Nanotechnology, 2003, 14, 859–863 CrossRef CAS.
- A. Siaï, P. Haro-Gonzalez, K. Horchani-Naifer and M. Ferid, Sens. Actuators, B, 2016, 234, 541–548 CrossRef.
- S. V. Yap, R. M. Ranson, W. M. Cranton and D. Koutsogeorgis, Appl. Opt., 2008, 47, 4895–4899 CrossRef CAS PubMed.
- O. A. Savchuk, P. Haro-Gonzalez, J. J. Carvajal, D. Jaque, J. Massons, M. Aguilo and F. Diaz, Nanoscale, 2014, 6, 9727–9733 RSC.
- J. Yu, L. Sun, H. Peng and M. I. J. Stich, J. Mater. Chem., 2010, 20, 6975–6981 RSC.
- V. Y. Soloviev, J. McGinty, K. B. Tahir, M. A. A. Neil, A. Sardini, J. V. Hajnal, S. R. Arridge and P. M. W. French, Opt. Lett., 2007, 32, 2034–2036 CrossRef CAS PubMed.
- P. B. Jones, A. Rozkalne, M. Meyer-Luehmann, T. L. Spires-Jones, A. Makarova, A. T. Kumar, O. Berezovska, B. B. Bacskai and B. T. Hyman, J. Biomed. Opt., 2008, 13, 014008 CrossRef PubMed.
- J. K. Swabeck, S. Fischer, N. D. Bronstein and A. P. Alivisatos, J. Am. Chem. Soc., 2018, 140, 9120–9126 CrossRef CAS PubMed.
- S. Y. Han, R. R. Deng, X. J. Xie and X. G. Liu, Angew. Chem., Int. Ed., 2014, 53, 11702–11715 CrossRef CAS PubMed.
- L. H. Fischer, G. S. Harms and O. S. Wolfbeis, Angew. Chem., Int. Ed., 2011, 50, 4546–4551 CrossRef CAS PubMed.
- X. J. Zhu, W. Feng, J. Chang, Y. W. Tan, J. C. Li, M. Chen, Y. Sun and F. Y. Li, Nat. Commun., 2016, 7, 10437–10447 CrossRef CAS PubMed.
- X. S. Cui, Y. Cheng, H. Lin, F. Huang, Q. P. Wu and Y. S. Wang, Nanoscale, 2017, 9, 13794–13799 RSC.
- Y. F. Wang, G. Y. Liu, L. D. Sun, J. W. Xiao, J. C. Zhou and C. H. Yan, ACS Nano, 2013, 7, 7200–7206 CrossRef CAS PubMed.
- F. Wang, R. R. Deng and X. G. Liu, Nat. Protoc., 2014, 9, 1634–1644 CrossRef CAS PubMed.
- F. Wang, R. R. Deng, J. Wang, Q. X. Wang, Y. Han, H. M. Zhu, X. Y. Chen and X. G. Liu, Nat. Mater., 2011, 10, 968–973 CrossRef CAS PubMed.
- N. Liu, W. P. Qin, G. S. Qin, T. Jiang and D. Zhao, Chem. Commun., 2011, 47, 7671–7673 RSC.
- P. W. Du and R. Eisenberg, Chem. Sci., 2010, 1, 502 RSC.
- N. J. Johnson, S. He, S. Diao, E. M. Chan, H. Dai and A. Almutairi, J. Am. Chem. Soc., 2017, 139, 3275–3282 CrossRef CAS PubMed.
- C. D. S. Brites, P. P. Lima, N. J. O. Silva, A. Millan, V. S. Amaral, F. Palacio and L. D. Carlos, Nanoscale, 2012, 4, 4799–4829 RSC.
- L. Marciniak, A. Bednarkiewicz, M. Stefanski, R. Tomala, D. Hreniak and W. Strek, Phys. Chem. Chem. Phys., 2015, 17, 24315–24321 RSC.
- P. Cortelletti, A. Skripka, C. Facciotti, M. Pedroni, G. Caputo, N. Pinna, M. Quintanilla, A. Benayas, F. Vetrone and A. Speghini, Nanoscale, 2018, 10, 2568–2576 RSC.
Footnote |
| † Electronic supplementary information (ESI) available. See DOI: 10.1039/c8qi01052h |
| This journal is © the Partner Organisations 2019 |


