 Open Access Article
Reaction and characterisation of a two-stage thermoset using molecular dynamics†
Felix K.
Schwab
 a and
Colin
Denniston
 bc
bc
aInstitute of Applied Materials (IAM-CMS), Karlsruhe Institute of Technology (KIT), Kaiserstrasse 12, 76131 Karlsruhe, Germany. E-mail: felix.schwab@kit.edu
bDepartment of Applied Mathematics, University of Western Ontario (UWO), 1151 Richmond Street, London, ON N6A 3 K7, Canada
cDepartment of Physics & Astronomy, University of Western Ontario (UWO), 1151 Richmond Street, London, ON N6A 3 K7, Canada
First published on 22nd July 2019
Abstract
The two-stage curing reaction of unsaturated polyester polyurethane hybrid resins is modelled using all-atom molecular dynamics simulations. The reactions – a urethane reaction and a radical polymerisation – are modelled based on atom distances and probabilities calculated by an Arrhenius law, without the need for intermediate minimisation steps. As representatives of this thermoset class two resin systems are considered. First, a simple virtual resin with just enough structure to be capable of the described reactions is used to verify the reaction process. Second, a system is studied which is designed to be similar to a commercially available hybrid resin used in conjunction with fibre reinforcements. Both systems are simulated and the results are used to evaluate the chemical reaction process and then to identify the resulting material's macroscopic properties and behaviour. These properties are determined at different cross-linking stages of the curing process providing a unique insight into the development of these parameters during the chemical reaction.
1 Introduction
Unsaturated polyester polyurethane hybrid (UPPH) resins, a relatively new thermoset class, combine the strengths of unsaturated polyester (UP) and polyurethane (PU) technologies.1 The chain-forming urethane polyaddition gives the cured resin flexibility and toughness, while the follow-up UP-based radical polymerisation leads to a three-dimensional cross-linked network resulting in stiffness and temperature resistance. A key motivation for the development of these advanced resin systems is their suitability for application in the progressively expanding use of fibre-reinforced polymers (FRP) in high performance applications within the aerospace, automotive and energy sector. From a macroscopic view point, reinforcing fibres with diameters in the micrometer range are common,2,3e.g. glass or carbon fibres, but there is also extensive research on improving the structural performance of a polymer by introducing reinforcements on a nano-scale,4–8e.g. nano-fibres. In conjunction with short cycle times, control and prediction of the curing reaction becomes fundamental to enhance the production process and to guarantee product quality. The relevance of understanding the curing process arises from its overall influence on the final material properties and behaviour.9 Hence, identification of material properties during this process is a necessary task. Performing an experimental characterisation during an active curing process poses a difficult challenge. This is why simulative determination of developing material properties becomes desirable.Molecular dynamics (MD) simulations are a computational method that follows motion on an atomic level and is free from many experimental constraints that make material characterisation difficult. From its origins by Alder and Wainwright10–12 MD has developed into a widely used simulation technique in physics, chemistry, and biology. With ever growing computational power, engineering fields are also becoming more and more involved with MD, mainly to support experiments and to better understand material behaviour.
Early work on simulating thermosets in MD was done by Barton et al.13,14 and Hamerton et al.,15 who investigated cross-linked or network-building polymers. In these works the three-dimensional network structures were generated artificially and the main focus lay on the prediction of mechanical and thermal behaviour. An improvement is found in the work of Doherty et al.,16 who presented MD simulations including the execution of a cross-linking process. Bond creation was allowed when reactive parts of the monomers or polymers moved within a certain distance of each other, which is still a common criterion in these kind of simulations. However, they did not analyse the resulting cross-linked polymer in that work. Among others, Yarovsky and Evans,17 Heine et al.18 and Wu and Xu19 combined the simulative cross-linking and the follow-up calculation of material properties of the resulting polymer networks. Further work in the direction of measuring thermal and mechanical properties of a cured thermoset was published by Li et al.20,21 A recent development in bond creation criteria is the utilisation of an Arrhenius type equation. Okabe et al.22,23 introduced this probabilistic feature to account for activation energies in the cross-linking process and used it in addition to the distance criterion. Research on the effect of varying water content on curing rate and the glass transition temperature was done by Sharp et al.24 Work on thermo-mechanical properties includes Gao et al.,25 who studied the impact of two differently cured epoxy resins on material characteristics, and Saiev et al.,26 who investigated the behaviour of polybenzoxazine thermosets.
In this paper, recently developed bond creation algorithms are applied to the two-stage curing reaction of UPPH resins. In particular, the distance criterion as well as an Arrhenius type equation is used to form new bonds, which is done on-the-fly without intermediate minimisation steps during a regular MD simulation run. The reaction algorithms furthermore were modified to capture the individual reaction steps, namely a urethane reaction and a radical polymerisation. The new algorithms are applied to the hybrid resin systems, whose partially and fully cured states are then analysed. The main goal is to characterise the thermoset through derivation of macroscopic material properties. Firstly, a simplified and virtual example of the hybrid resin class is examined before a more specific example similar to a commercially available resin is studied.
The paper is organised as follows: in section 2 the resin system we investigate is described, which is followed by the applied models and algorithms in section 3. Before discussing the results of the simulations in section 5, the setup of specific systems is given in section 4. In section 6 the findings are summarised and conclusions drawn.
2 Resin system
UPPH resins are mixtures of resins blended with the goal of combining advantages and overcoming disadvantages of their single components and technologies: PU gives the cured resin flexibility and toughness while UP provides stiffness and thermal resistance. For a further discussion the reader is referred to Verleg and Hummer.1Generally, UPPH resins consist of isocyanate, unsaturated polyester and peroxide molecules, which enable the resin to perform two reactions: a urethane polyaddition reaction and a radical polymerisation. The isocyanate molecules often come in the form of (poly-)methylene diphenyl diisocyanates ((P-)MDI, see Fig. 1a), which are typical for polyurethane formation. UP is usually cut with styrene (see Fig. 1b), both containing carbon double bonds for a radical cross-linking reaction. To enable the resin to form polyurethane chains, the UP molecules also have hydroxyl groups. Additionally, a small amount of the hybrid resin is peroxide molecules (see Fig. 1c), which are needed solely to initiate the radical polymerisation. In general, (P-)MDI and UP can appear not only with different lengths but also differing numbers of functional groups. In the following the reactions of the two-stage resin system are described.
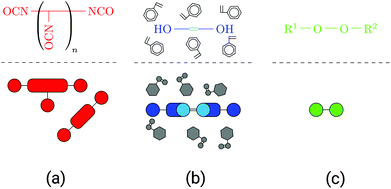 | ||
| Fig. 1 Overview of molecule types in the resin, schematic representations: (a) isocyanate in the form of (P-)MDI, (b) UP dissolved in styrene and (c) peroxide molecule. | ||
2.1 Polyurethane reaction
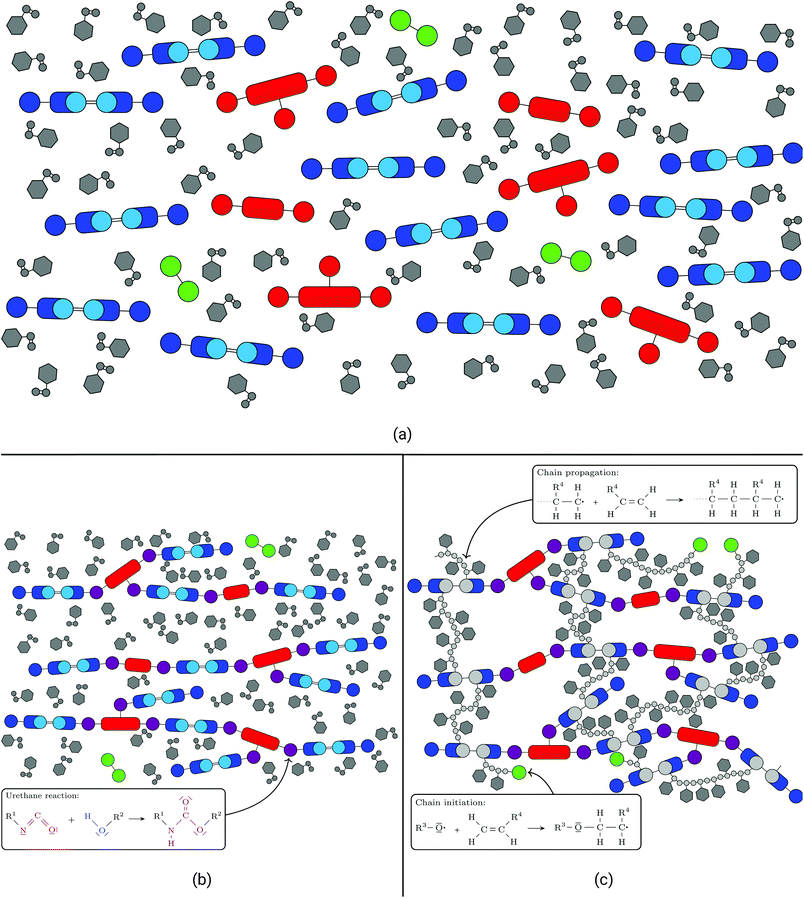
Once all components are mixed together (see Fig. 2a) the polyurethane reaction is initiated at room temperature. On a molecular scale the isocyanate groups of the (P-)MDI react with the hydroxyl groups of the UP.This leads to the formation of long polyurethane chains (see Fig. 2b) stretching across wide areas of the resin. On a macro-scale this results in the thickening of the resin which changes from a fluid to a gum-like consistency. When used with fibres to form a fibre-reinforced polymer (FRP), these have to be placed in the resin during this step. In this semi-finished state the thickened sheets may be stored several weeks before further processing.
2.2 Radical polymerisation
Upon heating the (thickened) resin above 60 °C, the peroxide O–O bonds start to cleave. This leaves the oxygen atoms electrophilic and starts a radical polymerisation process, in which they move to nucleophile centres, namely the unsaturated carbon double bonds of the (now) polyurethane chains and the styrene. After breaking a carbon double bond and establishing a new bond between the oxygen and one of the carbon atoms, the left over carbon atom becomes electrophile itself and continues the radical reaction (see Fig. 2c). The chain propagates until it is terminated by the radical tip of another chain, which means that the tips of two cross-link branches form a bond, thereby stopping and finalising the reaction in these branches. De facto, the reaction also comes to a halt when there are no carbon double bonds left within reach. At the end of the process, the polyurethane chains are three-dimensionally cross-linked by styrene chains leading to a rigid polymer network.On a macro-scale this process goes along with moulding: if the previously mentioned semi-finished sheets are used, these are placed in a pre-heated mould where they cure under pressure to produce the final shape. In this step the material develops its final material properties and behaviour.
2.3 Virtual resin system
To test our reaction process modelling and to provide a minimal example for the reader, a simple virtual resin system is introduced. This system is not based on a specific resin but only serves as an illustrative example for the chemical reactions involved. Its simplicity provides a less computationally intensive system for simulation. Its molecules have the same functional groups and unsaturated carbon double bonds as the general hybrid resin class. For the molecules’ structure rather simple backbones are assigned, even styrene is simplified to ethylene. The molecules involved and their structure are specified in Table S1.† The number of functional groups is kept consistent with the commercial resin described in section 4 to guarantee a certain comparability, but for convenience the functionality of the (P-)MDI is reduced to 2 (cf.Table 2). Therefore the reactions stay the same. The general composition of the virtual resin system used for simulation is specified in Table 1, which is derived from the weight fractions listed in Table 3.| DARON® AQR 1009 | ||
| OH value | mgKOH g−1 | 100 |
| Functionality | — | 2 |
| LUPRANATE® M 20 R | ||
| NCO equivalent weight | g per eq. NCO | 135.0 |
| Functionality | — | 2.7 |
| Commercial variant | phr | Component | wt% |
|---|---|---|---|
| LUPRANATE® M 20 R | 25 | MDI | 45 |
| P-MDI | 55 | ||
| DARON® AQR 1009 | 100 | Unsaturated polyester polyol | 65 |
| Styrene | 35 | ||
| TRIGONOX® C | 1 | Organic peroxide | 100 |
The composition is given as unit composition, i.e. number of molecules as the smallest whole numbers possible regarding the compound composition, and each constituent is monodisperse. This composition is the basis for the simulation setup of the virtual resin system.
2.4 System based on a commercial hybrid resin
A representative of the type of two-stage hybrid resin we would like to model is DARON® AQR 1009, which is commercially available from ALIANCYS AG. This resin system consists of three components: A (P-)MDI in the form of LUPRANATE® M 20 R, available from BASF SE, DARON® AQR 1009, a UP dissolved in styrene available from ALIANCYS AG and which is also the name giving component to the resin system, and TRIGONOX® C, an organic peroxide for initiating radical polymerisation available from AKZO NOBEL N.V.For all three components there is no chemical data sheet disclosed or information publicly available. Hence the authors do not know the exact chemical structure of the molecules involved so are forced to come up with chemical structures consistent with the available information. This choice is not unique. A few properties and structural information which are provided by ALIANCYS AG are listed in Table 2.
Schematics of the molecular structure used in the simulations are given in Fig. 1. While this is based on an educated guess of the structure of DARON® AQR 1009, we emphasise that while the schematic is consistent with what we do know there are ambiguities in the available data that necessitated filling in unknown details. As a result, there may be some material properties that we measure in our system that may differ somewhat from the actual commercial resin. Based on the available information, we surmise that each UP molecule always has two hydroxyl groups. For (P-)MDI the non-integer functionality underlines that there has to be a range of molecules with a different amount of isocyanate groups, and the NCO equivalent weight indicates that each isocyanate group is connected to a part of the molecule's backbone which takes up an atomic weight of 135.0. There is no information on the organic peroxide, but as it only serves as an initiator for the radical polymerisation the structure is of less importance. From this information a compound consistent with this is calculated as presented in Table 3, which is used as the basis for the simulation setup for this resin system.
The derived composition is given in Table 1. The unit composition in the third column is the same as for the virtual resin, while the molecules of the main resin constituents are not monodisperse. Further details on this are found in ESI section I and Table S2.†
3. Model and algorithms
The models described in this section are implemented in the open source MD code LAMMPS27,28 (acronym for Large-scale Atomic/Molecular Massively Parallel Simulator). Reaction algorithms presented in section 3.2 are built upon LAMMPS fixes bond/create and bond/break. These fixes were then modified making use of the work of Timothy Sirk (e.g. Jang et al.29). We then made some additional changes to accommodate all the reactions as described below.3.1 Molecule description
The behaviour of all atoms in the system is governed by the COMPASS force-field.30–32 It is composed of intra- and intermolecular potentials and depends on relative atom positions rij and their combinations as bond length bij, angle φijk, dihedral or torsion angle ϑijkl and out-of-plane angle χijkl, where the indices indicate the involved atoms. The total potential function may be written as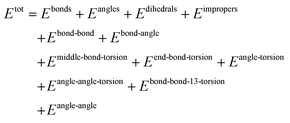 | (1) |
The intra-molecular or valence potentials have cross-coupling terms provided and include all terms except for EvdW and ECoulomb. These are the inter-molecular or non-bonded interaction terms, which may also act on distant atoms of the same molecule. The van der Waals interactions are modelled by a Lennard-Jones (L-J) 9–6 potential while the coulombic potential controls the electrostatic behaviour. The expanded form of eqn (1) and further information on the COMPASS force-field are given in ESI section II.† Additional details and the parameters involved for the force-field can be found in the work of Sun et al.30–32 A small number of potentials were not parametrised in the referenced literature. In these cases they have potentials assigned from as closely matching atoms as possible (potentially atoms of the same group in the periodic table). Mixed terms (e.g. terms mixing bond and angle potentials) are typically small and are set to zero if parameters are not available.
3.2 Reaction algorithms
Bonds can only be created if appropriate reaction partners are in fairly close proximity. Exploiting this, a distance criterion helps in preselecting reactive groups that move closer than a specified cut-off distance, e.g. as described in Doherty et al.16 In general, this cut-off distance is chosen as the maximum distance at which bond formation is presumably still possible from an energetic point of view. With this simple, but quite rigid, criterion considerable computational effort can be saved by applying advanced reaction algorithms only to these preselected reactive groups within a promising distance. Generally, we extend this criterion by an Arrhenius type fraction based on arguments similiar to Okabe et al.22,23 and modify the process of bond formation. We elaborate below on this approach for each distinguishable chemical process of peroxide bond dissociation and polyurethane as well as radical bond formation.Firstly, the bond dissociation procedure is described. Pseudo-code is given in Algorithm S1.† Whenever the system temperature Θ rises above a threshold temperature Θmin, all bonds are checked to see if their type is allowed to break. Each of these eligible bonds draw a random number between zero and one (probability P) and compare it to a bond-specific calculated threshold fraction. The calculation of this fraction is based on the Arrhenius equation
 | (2) |
In a next step, the bond formation procedure is explained on the basis of the polyurethane reaction. A summary is available in the form of Algorithm S2.† Each atom is checked to see whether it is part of a creatable bond. If this is true, its neighbourhood is scanned for atoms with atom types that can complete the bond. After a suitable bond partner is found, two criteria have to be fulfilled to establish the bond. As a first criterion the aforementioned distance check is used to neglect partners too far apart. The second criterion draws a random number between zero and one and compares it against a fraction delivered by a Arrhenius type equation (same as used in the bond dissociation process). In contrast to breaking a bond, here we want the probability value to be lower than the Arrhenius value to ensure the bond is only established when the atoms are close to the new bond's equilibrium distance. With this, unnatural bond stretches when forming the bond are avoided. Another aspect of this procedure is the handling of further atoms to be exchanged during the bond creation. In the case of the polyurethane reaction, cf. Fig. 2b, this deals with the hydrogen atom of the hydroxyl group, which is donated to the nitrogen atom of the isocyanate group. In general, the distance between these two atoms may be far from equilibrium upon forming the bond between the oxygen and carbon atom. To take care of this, we establish a transient bond between the hydrogen and the nitrogen. This means the bond is already in formation, but not fully established yet. In this state the two atoms are excluded from standard potentials but move closer by a Coulomb's potential and an eased bond potential. With this a smooth and continuous transition of the hydrogen atom is ensured and unnaturally high forces are avoided. The transient bond is checked in the same Arrhenius type way as described above and is fully established as soon as the probability criterion is met by releasing it from the transient state. As before, after each change of the bonds, the molecular topology is updated with respective angles, dihedrals and impropers.
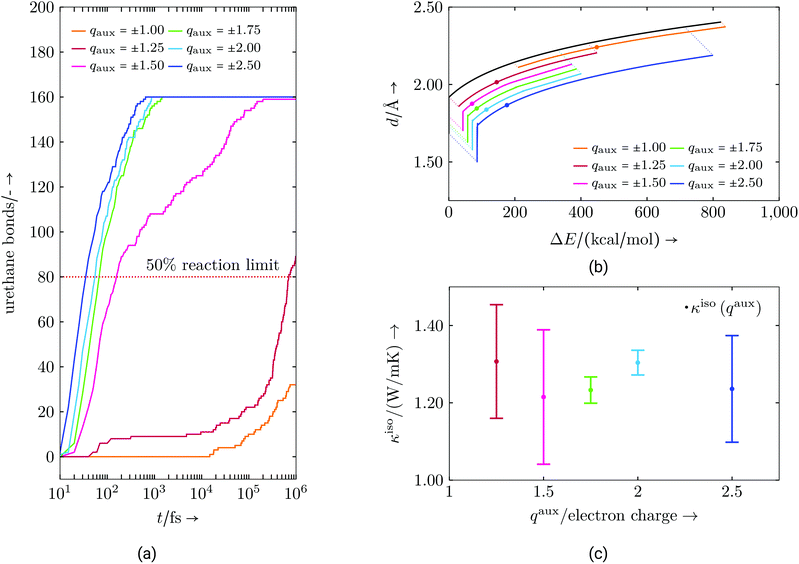
Lastly, additional measures for the radical reaction are discussed. Here, the basic approach is the same as for the polyurethane formation. When proceeding naturally, the chemical reactions can continue for several seconds before completion throughout a macroscopic sample. This is beyond the time scale of an MD simulation. Our reactions are sped up by the essentially perfect mixing (impossible to achieve in an experiment) of our starting state thus meaning a reaction partner is always fairly close. In addition, to mimic electrophile and nucleophile centres, in force calculations atom types belonging to this group receive an additional force component as described in Algorithm S3.† For this purpose a coulombic force is calculated exclusively acting between electrophile and nucleophile centres. Hence, these centres are preferably found by each partner thus taking care to produce a proper radical propagation. While physically motivated, this added force is of an artificial nature (it is not fit from anything other than to result in the correct bonding). We use the parameters of this force (mainly the size of this auxiliary charge, qaux) to adjust the speed of the reactions (Fig. 3). By accelerating the reaction, the process should take place in a reasonable temporal frame without having an overall influence on how bonds are formed. This does not mean that bonds always form between the same molecules, but that the resulting molecular structure is similar at a comparable reaction state, i.e. the authors expect properties to be a function of curing degree and that the time scale to get to this curing degree should not significantly impact the final material properties of the network, as long as the reaction is “slow enough”. Without further studies we cannot say that this statement is universally true, but that it is a reasonable assumption in this context, which is also necessary to carry out the reaction simulations within the MD time scale.
Fig. 3a illustrates how increasing the auxiliary charges raises the conversion speed. Auxiliary charges of ±1.25 or greater are needed to achieve 50% conversion in a reasonable time scale. Increasing the charge beyond ±1.75 results in only slightly faster conversion rates. Fig. 3b shows the energies and distances at which new bonds are formed. While the shape of the curve is determined by the bond energy versus distance relationship (black curve), the range of values (bandwidth) at which bonds actually form is shown by the shifted lines, with the median indicated by a point. These curves lead to the conclusion that higher auxiliary charges narrow the bandwidth of energies and distances in which new bonds are formed. This is a result of the higher attractive forces of the reactants, which moves them closer very quickly during a few numerical time steps. For the reaction algorithm this means that bond formation for two atoms might be unlikely at one time step, but at just the next it might be very probable. This can also be seen in the depicted median point, which moves towards ΔE = 0. At higher auxiliary charge this effect starts to reverse, probably due to an elevated local temperature due to high velocities or other chaotic effects. Hence, a trade-off between distance and energy bandwidth, respectively, and a reasonable reaction speed has to be found. This suggests using an auxiliary charge in the lower end of the ±1.50 to ±2.00 range, where the bandwidth does not change much. Additionally, bond formations opportunities, which might be natural on a longer time scale, e.g. due to slow re-configuration of molecules bringing energetically more favourable bond partners closer, might be lost with elevated reaction speeds. This could lead to different material properties when higher auxiliary charges are chosen. We examine this possibility for the thermal conductivity κiso in Fig. 3c. While the mean value of κiso does not change much, the values do become more anisotropic (reflected by the larger error bars) for large and small values of the auxiliary charge. In the case of the virtual resin system, auxiliary charges of ±2.00 or less seem to be acceptable. However, charges lower than ±1.50 may result in more anisotropic results (e.g. in the thermal conductivity tensor) probably because fewer bond partners may be able to move close enough to form a bond. This might cause bond formation only for easily accessible configurations, narrowing the overall range of possible bond configurations. Hence, in the following, auxiliary charges are chosen to be in the identified range of small anisotropy, but also with respect to general molecule size and numerical stability. In contrast to the above discussed urethane reaction, the radical polymerisation, which typically involves small and compact molecules may be achieved with smaller auxiliary charges.
4. Simulations
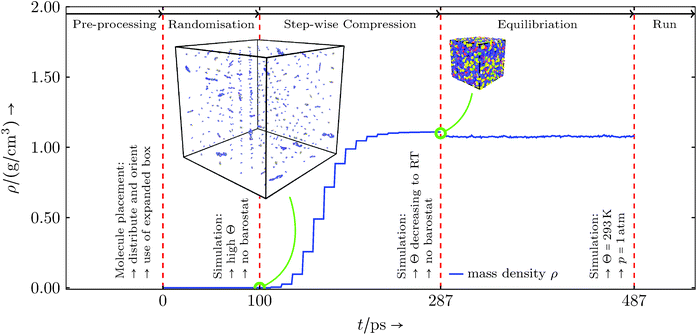
As mentioned in the previous section the MD software LAMMPS is used for all simulations. The basic setup uses an NPT ensemble, hence constant number of atoms, constant pressure and constant temperature, which is realised by fix nve in conjunction with a Langevin thermostat (fix langevin) and a Berendsen barostat (fix berendsen/press). The creation of the basic all-atom molecules is done in AVOGADRO.36,37In all simulations periodic boundaries and LAMMPS real units were used. To setup the simulations we used the information provided in sections 3 and 4. We built each component with AVOGADRO and filled the simulation domains with the given compound in Table 3 using the all-atom molecule structures. The initial volume was larger than the operational volume to allow molecules to be placed randomly in position and orientation. Before simulating the reactions, the system was equilibrated to the operational state via the following steps (illustrated in Fig. 4):
• randomisation at high absolute temperature and a large constant volume,
• step-wise volume shrinkage towards the expected mass density at room temperature, cycling sub-steps compressing, minimisation and equilibration,
• final equilibration at room temperature and standard pressure, letting the domain adjust to its desired mass density.
In the case of the commercial resin system the simulation domains have a mass density of approximately 1.089 g cm−3 at 293 K after undergoing the above procedure (cf.Table 9). The DARON® AQR 1009 product data sheet38 only gives the mass density for the fully cured resin, as the uncured components start reacting upon mixture (cf. section 2). By using a typical value for volume shrinkage for a UPPH resin,1 an initial mass density of about 1.082 g cm−3 is found at 296 K. The closeness of the two mass densities leads to the conclusion, that the molecules’ structure as well as the force-field and its parameters are a reasonable choice for a resin analogous to the DARON® AQR 1009 resin. The virtual resin system, due to its illustrative and simplified nature, is not appropriate for such comparisons.
The reaction simulations are carried out in a two-step procedure based on the curing steps used during an industrial production process summarised in Table 4. Firstly, the polyurethane reaction is simulated: the temperature is set to 313 K and the bond formation between hydroxyl and isocyanate groups is allowed. This reaction is accelerated by auxiliary charges of ±1.5 as described at the end of the previous section. The simulations are stopped when a conversion to urethane connections of approximately 50% is reached, which was always achieved within 0.5 ns. Secondly, the radical polymerisation is enabled where the temperature is elevated to 418 K, causing the peroxide to cleave. Simultaneously, the pressure is set to 10 MPa (≈![[thin space (1/6-em)]](https://www.rsc.org/images/entities/char_2009.gif) 98.69 atm). The temperature and pressure in this step are based on typical process parameters of industrial compression moulding.39 Here, auxiliary charges for radical centres are set to qaux = ±1.0 to mimic free electrons that occur in radical bond formation. After another 0.5 ns the reactivity of the second simulation step diminishes and the simulation is stopped. The reaction simulations are performed for a set of different systems. The virtual resin system is used for simulations of about 7500 atoms and in one configuration, which is twice the composition given in Table 1. The complex resin system is used in two different sizes, which have about 14
98.69 atm). The temperature and pressure in this step are based on typical process parameters of industrial compression moulding.39 Here, auxiliary charges for radical centres are set to qaux = ±1.0 to mimic free electrons that occur in radical bond formation. After another 0.5 ns the reactivity of the second simulation step diminishes and the simulation is stopped. The reaction simulations are performed for a set of different systems. The virtual resin system is used for simulations of about 7500 atoms and in one configuration, which is twice the composition given in Table 1. The complex resin system is used in two different sizes, which have about 14![[thin space (1/6-em)]](https://www.rsc.org/images/entities/char_2009.gif) 000 and 110
000 and 110![[thin space (1/6-em)]](https://www.rsc.org/images/entities/char_2009.gif) 000 atoms. Here, the small systems use again directly the composition given in Table 1, while the large system is the eightfold unit cell. The smaller system comes in three different configurations (started from independent random initial conditions), whereas the large one is used in one configuration.
000 atoms. Here, the small systems use again directly the composition given in Table 1, while the large system is the eightfold unit cell. The smaller system comes in three different configurations (started from independent random initial conditions), whereas the large one is used in one configuration.
| Run | Time in ns | Δt in fs | Ensemble | Temperature in K | Pressure in atm |
|---|---|---|---|---|---|
| Urethane | 0.5 | 0.1 | NPT | 313.0 | 1.00 |
| Radical | 0.5 | 0.1 | NPT | 418.0 | 98.69 |
5. Results
For visualisation the software package OVITO40,41 is used. In general, all quantities are calculated on the basis of fluctuation dissipation relations (see e.g. Frenkel and Smit42) or non-equilibrium molecular dynamics (see e.g. Rapaport43) for various degrees of cure to catch their development during the chemical reaction. Furthermore changes during cooling to room temperature are measured and presented, if meaningful. The virtual resin system, which serves as a prototypical example, is only evaluated for the purely thermal properties, i.e. specific heat capacity and thermal conductivity.The degrees of cure ζ, which are of interest and each referenced to maximum conversion, preferably are for the urethane reaction ζu = {0%, 50%} and for the radical reaction ζr = {0%, 20%, 40%, 60%, 80%, 100%}, or as close as the simulation results are available. It is assumed that 50% of theoretically possible urethane connections is a upper limit in an experimental setup. Therefore a total number of seven data points are examined along the curing reaction. In the following a short notation of the form UxRy is used, where x and y indicate the conversion in percent for the urethane and the radical reaction, respectively. For example ζu = 50% and ζr = 0% is noted by writing U50R0. Temperature dependence is essentially evaluated either around room temperature (293 K) or around the mould temperature (418 K). To characterise the vicinity of these temperatures, the data points for temperature are set in the range Θ ∈ [273 K, 313 K] and for mould relevant curing degrees additionally in the range Θ ∈ [398 K, 438 K].
5.1 Curing reaction
The curing reaction is separated into urethane polyaddition and radical polymerisation for each of the resins, both carried out under isothermal-isobaric conditions through the applied NPT ensemble (see Table 4). For both, bond formation and dissociation progress were tracked to gain information about reaction behaviour and remaining volatile organic compound (VOC, Table 7).44 From equilibrated states at the beginning and the end of the reaction steps chemical volume shrinkage χ at different temperatures (Table 8) and released reaction enthalpy Δh (Table 10) was calculated.Evaluation: Both resin systems execute their chemical reactions in a comprehensible way: the auxiliary charges speed up the reactions to make them happen on an MD time scale (compared to several minutes in experiments). For the radical reaction (see Fig. 5) the models follow the reaction schematic by rapidly dissociating peroxide bonds due to the elevated temperature, which causes radical chain initiations and propagation, which steadily connects the polyurethane backbones. If free radicals meet, chains are terminated.
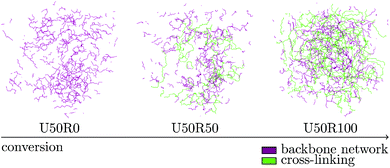 | ||
| Fig. 5 Radical cross-linking reaction of the virtual resin system over time. Atomic details are suppressed in the figure and only relevant bonds are shown. | ||
As listed in Table 5 and illustrated in Fig. 6, the virtual resin shows a high reactivity and is able to reach 100% conversion for both, the urethane and the radical reaction.
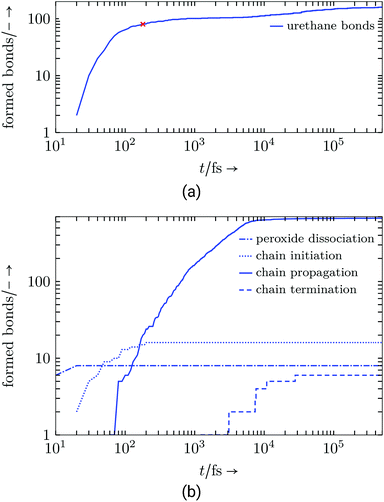 | ||
| Fig. 6 Virtual resin system: (a) Formed urethane connections, red cross marks 50% conversion, (b) radical reaction step. | ||
| Reaction steps in virtual resin | Formed bonds (max) | |
|---|---|---|
| Urethane | 80 | (160) |
| Peroxide dissociation | 8 | (8) |
| Chain initiation | 16 | (16) |
| Chain propagation | 668 | (668) |
| Chain termination | 6 | (16) |
This is mainly due to the virtual resin system being composed of shorter molecules than the commercial resin.
These shorter molecules are able to move faster and so the reactive atom groups on the molecule find a reaction partner fairly quickly. For the same reasons, the commercial resin system, Fig. 7, with its larger and long-chained molecules behaves relatively slowly and 100% conversion is not reached. As listed in Table 6, for both system sizes all peroxide bonds dissociate and the respective number of radical chain initiation are conducted.
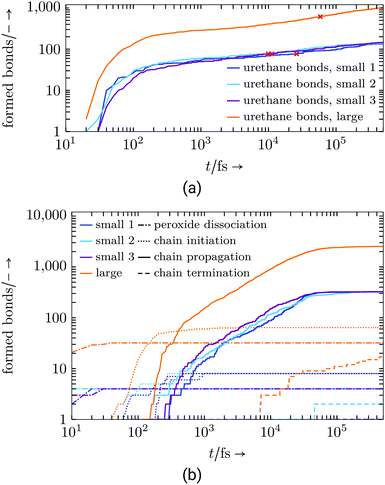 | ||
| Fig. 7 Commercial resin system: (a) Formed urethane connections, red cross marks 50% conversion, (b) radical reaction step. | ||
| Reaction steps in commercial resin | Formed bonds (max) | |||
|---|---|---|---|---|
| small system | large system | |||
| Urethane | 77+0−0 | (154) | 616 | (1232) |
| Peroxide dissociation | 4+0−0 | (4) | 32 | (32) |
| Chain initiation | 8+0−0 | (8) | 64 | (64) |
| Chain propagation | 323+2−1 | (334) | 2526 | (2672) |
| Chain termination | 1+1−0 | (8) | 17 | (64) |
The cross-linking styrene molecules, which drive the chain propagation, need an increasingly amount of time to propagate the cross-links, which significantly slows down the reaction at the end of the simulation. Only a few chains terminate due to a merge of two cross-linking branches. The slowed down chain propagation indicates that the remaining amount of cross-linkers listed in Table 7 would not remarkably decrease in longer simulation runs.
| Virtual resin (ethylene) | Commercial resin (small, styrene) | Commercial resin (large, styrene) | |
|---|---|---|---|
| Remaining cross-linkers | 0.00% | 4.01 ± 0.57% | 4.39% |
These remaining unlinked molecules are identified as VOC, which may diffuse out of the polymer network over time and cause its characteristic odour. Depending on the molecule type, large amounts of VOC may harbour health risks. The volume shrinkage exhibited by our commercial-analog resin system is similar to that seen in other hybrid thermosets.1 Furthermore, for the small and large realisations the volume shrinkage is almost the same (see Table 8).
| Volume shrinkage in % | Virtual resin | Commercial resin | |
|---|---|---|---|
| (small) | (large) | ||
| χ tot (293 K) | −57.01 | −5.33+0.24−0.20 | −5.42 |
| χ r (293 K) | −77.35 | −4.70+0.34−0.30 | −4.55 |
| χ r (418 K) | ≈−30![[thin space (1/6-em)]](https://www.rsc.org/images/entities/char_2009.gif) 000 000 |
−10.59+0.66−0.44 | −10.53 |
For the virtual resin the volume shrinkage is significantly higher and may result from the small and short polymer chains used, which, when bonded, do not allow for much free volume in between. Together with initially low mass density (see Table 9) this underlines the purely exemplary nature of the virtual resin system, which does not follow standard thermoset behaviour. The gas-like behaviour at low degrees of cure and high temperature further stresses that this artificially designed resin system is disconnected from industrial application or physical and chemical reasonable thermosets in general.
| Mass density in g cm−3 | Virtual resin | Commercial resin | |
|---|---|---|---|
| (small) | (large) | ||
| ρ uncured (293 K) | 0.614 | 1.089+0.00056−0.00062 | 1.089 |
| ρ urethane(293 K) | 0.547 | 1.096+0.00169−0.00172 | 1.098 |
| ρ urethane(418 K) | 0.003 | 1.003+0.00108−0.00143 | 1.002 |
| ρ full (293 K) | 0.971 | 1.147+0.00150−0.00198 | 1.148 |
| ρ full (418 K) | 0.921 | 1.110+0.00182−0.00542 | 1.108 |
A similar picture is observed for the change in enthalpy of the radical reaction step (see Table 10). Again, the calculated values for the small and large commercial resin systems are nearly identical. For the virtual resin system, similar to the volume shrinkage, the enthalpy change found is analogously higher.
| Virtual resin | Commercial resin (small) | Commercial resin (large) | |
|---|---|---|---|
| Δh in kJ kg−1 | −568.27 | −80.47 ± 1.43 | −80.90 |
5.2 Specific heat capacity
The calculation of the specific heat capacity at constant volume, cV, is performed in an NVT ensemble. In thermodynamics the heat capacity at constant volume is defined as | (3) |
 | (4) |
Evaluation: Simulations of partially cured configurations (where reactions are paused during the measurement) were carried out in an NVT ensemble for 1 up to 5 ns. In Fig. 8 and 9 the results are shown and listed in Tables S3 and S4,† respectively. The basic, underlying calculation of the mass-specific heat capacity uses cumulative averages for total energy and temperature expressions, and is applied to every data point in temperature and degree of cure.
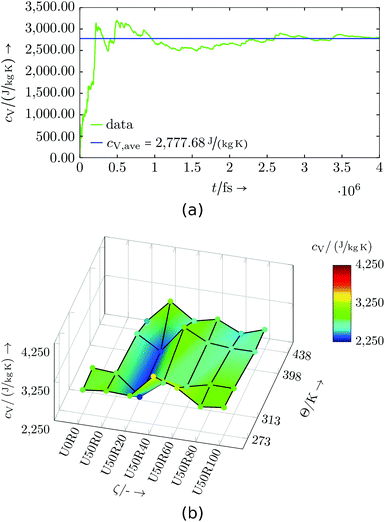 | ||
| Fig. 8 Virtual resin system: (a) Exemplary specific heat capacity evaluation for U50R60 at 313 K, (b) specific heat capacity dependent on temperature Θ and degree of cure ζ. | ||
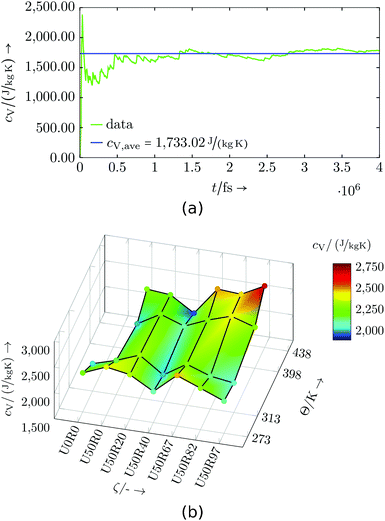 | ||
| Fig. 9 Commercial resin system: (a) Exemplary specific heat capacity evaluation for U50R46 at 398 K, (b) specific heat capacity dependent on temperature Θ and degree of cure ζ. | ||
The virtual resin system shows a non-monotonous development with degree of cure and temperature. If the three presumed outliers at U50R20, U50R40, U50R60 and Θ = 273 K are excluded from the interpretation, and the region with low degree of cure and high temperature is neglected due to the irregular behaviour of the mass density (cf.Table 9), a qualitative pattern may be identified. A distinct ditch is visible along a degree of cure of U50R20, and for lower and higher values of degree of cure, cV generally rises moderately. No generally occurring pattern for a change in temperature is visible, except for higher degrees of cure, where cV drops with increasing temperature. This generally non-monotonous behaviour is observed with real thermosets, e.g. for temperature changes,45,46 and is not a result of this being a virtual resin. The use of more system domains or larger system domains may help to further smooth and clarify the results, including the detection of possible outliers. As this is only a virtual resin system, this was not prioritised in this study.
For the commercial resin system all three small domains are used for the calculation of cV. As the three systems may not have exactly the same degree of cure ζ, the evaluation is done for the closest values available and the cV shown is from a weighted average. The commercial resin system also shows a prominent valley, which is found along temperature for a degree of cure of about U50R40. Lower and higher degrees of cure give a crest in cV, and especially for high temperature and high degrees of cure a peak is identified. Comparing this behaviour and the general range of the specific heat capacity at constant volume to other thermosets (see, e.g. literature values in ref. 47 and 48), an agreement in magnitude and in general behaviour with temperature is found. Especially the non-monotony with temperature is not uncommon.45,46 Similar to the virtual resin system, a larger set of system domains may help in further smoothing out the results, but the overall trends are already clear.
5.3 Thermal conductivity
Thermal conductivity is described by Fourier's law as the proportionality tensor between heat flux Ji and temperature gradient | (5) |
With the Green–Kubo formalism49–51 thermal conductivity can be expressed by the ensemble average of the auto-correlation of the heat flux.
 | (6) |
Evaluation: As above for the specific heat capacity, simulations were carried out on partially cured configurations in an NVT ensemble for 1 up to 5 ns. The thermal conductivity is calculated in intervals of 8000 time steps by the Green–Kubo equation (6), which turned out to be sufficient for the auto-correlation of the heat flux to decay before the end of the time interval. Hence, the formalism converges towards constant values of κij, which are evaluated for the last 1 ns of the overall simulation time. For the simulation, to suppress undesired convective heat fluxes, the centre-of-mass motion is subtracted.52
The results of the virtual resin system are depicted in Fig. 10 and listed in Table S5.† The general trend shows a decreasing thermal conductivity κiso for higher degrees of cure and for lower temperatures. Higher temperatures at lower degrees of cure show a deviation from this behaviour, which might be associated to the still low number of cross-links and a low mass density (cf.Table 9), hence less possibilities for heat transport. Analogously to the specific heat capacity evaluation, a larger set of simulations could help in clarifying the trends and behaviour, but this is not of great interest for the virtual resin.
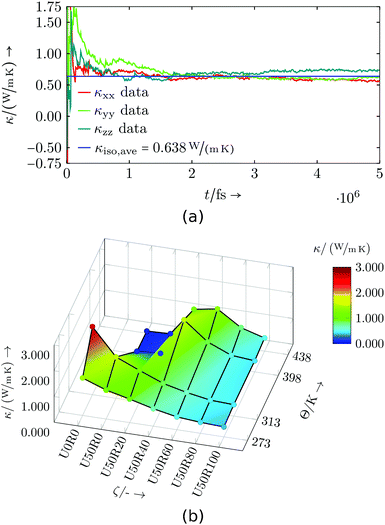 | ||
| Fig. 10 Virtual resin system: (a) Exemplary thermal conductivity evaluation for U50R60 at 313 K, (b) thermal conductivity dependent on temperature Θ and degree of cure ζ. | ||
The results of the commercial resin system are shown in Fig. 11 and Table S6.† As previously for the specific heat capacity, the calculated thermal conductivities of all three small domains (see, e.g.Fig. 11a) are used for a weighted average for every data point in degree of cure and temperature. The isotropic thermal conductivity κiso grows with higher degrees of cure and higher temperatures. The behaviour with changing temperature as well as the magnitude of κiso is again similar to thermosets found in literature.47,48
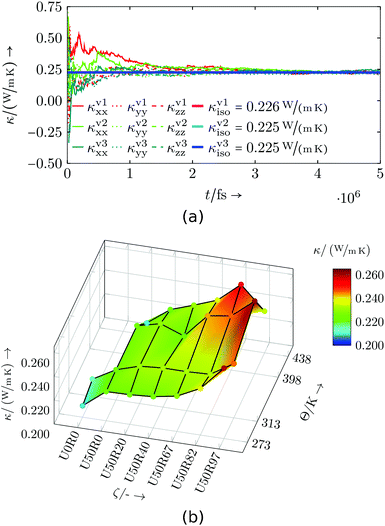 | ||
| Fig. 11 Commercial resin system: (a) Exemplary thermal conductivity evaluation for U50R0 at 398 K, (b) thermal conductivity dependent on temperature Θ and degree of cure ζ. | ||
The increase in thermal conductivity with degree of cure may be explained by the increased cross-linking density, which results in better transmission of thermal energy. Therefore, the overall pattern in Fig. 11b is fairly clear if one neglects the statistical fluctuations.
5.4 Thermal expansion and glass transition temperature
Thermodynamics define the (isotropic and) volumetric thermal expansion coefficient as (see e.g. Landau and Lifshits53) | (7) |
The glass transition temperature Θg is determined by recording the volume over a range of absolute temperatures. When the polymer switches from a rubbery to a glassy state, the change in slope of the volume curve indicates Θg. In the following, only the commercial resin system is evaluated.
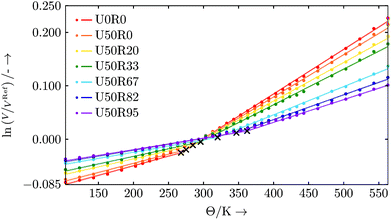
Evaluation: For every degree of cure a series of simulations based on the large commercial resin setup is run. Each simulation is conducted in an NPT ensemble with pressure p = 1 atm and temperatures ranging from 103 K to 563 K in 20 K steps. Between 203 K to 433 K every 10 K a simulation is performed. Every simulation is run for 500 ps, and the simulation domain's volume is averaged over the last 100 ps. For evaluation, we use the natural logarithm of the volume expressed in relation to the volume at a temperature of ΘRef = 293 K.
The slopes of the curves plotted in Fig. 12 represent the volumetric thermal expansion coefficients, and the points where the slope changes are identified as the glass transition temperatures Θg.54 Due to the finite size of our system, rather than a well-defined kink the data sets show a smooth transition region for the change of slope from the glassy to rubbery state.
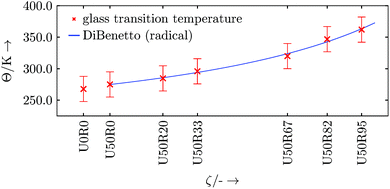
This crossover region is excluded from the data for the piecewise linear fits55 (for the simple reason that the data is not linear in this region). We do this in a two-step procedure. In a first step we calculate the local second derivatives of the full data sets. The transition region is located where the second derivative peaks (i.e. where the curve is non-linear). Based on this we exclude data points in the range of ±20 K around this preliminary Θg. This range is chosen with respect to the largest occurring spacing between two data points of a data set. The data sets with excluded transition region now serve as input for the piecewise linear fits with one break point, where the break point is associated with the corrected Θg and the slopes are the volumetric thermal expansion coefficients. The resulting fits of this evaluation procedure are shown in Fig. 12. The respective linear thermal expansion coefficients are calculated from their volumetric counterparts and are listed in Table 11. The thermal expansion coefficients are found to be similar in magnitude to typical thermosets found in the literature.2,47,48 The increase in glass transition temperature Θg with progressing curing reaction appears to be in a range of standard thermosets.56,57 However, the DARON® AQR 1009 product data sheet38 indicates a final glass transition temperature of Θg ≈ 403 K (130 °C). This deviation may be related to finite size effects or that the simulated cross-linking is not close enough to the real chemical process, especially in density of the formed cross-links57 (we start with a perfectly mixed system which is an ideal limit for an experiment). In addition, the width of the transition region in our finite-sized system broadens at the higher degrees of cure which may also mean that we have underestimated the uncertainties in Θg at high cure.
| ζ | Θ g in K | α vol in 10−5 K−1 | α lin in 10−5 K−1 | ||
|---|---|---|---|---|---|
| Θ < Θg | Θ ≥ Θg | Θ < Θg | Θ ≥ Θg | ||
| U0R0 | 267.8 | 36.0 | 83.4 | 12.0 | 27.8 |
| U50R0 | 275.0 | 34.1 | 79.1 | 11.4 | 26.4 |
| U50R20 | 284.7 | 30.0 | 71.9 | 10.0 | 24.0 |
| U50R33 | 295.9 | 28.3 | 66.8 | 9.4 | 22.3 |
| U50R67 | 320.0 | 23.2 | 52.8 | 7.7 | 17.6 |
| U50R82 | 346.8 | 22.3 | 46.4 | 7.4 | 15.5 |
| U50R95 | 362.1 | 21.6 | 42.6 | 7.2 | 14.2 |
To review the development of Θg in the radical reaction step, DiBenedetto's approach may be used.58 Following the development of Θg, the data points are sufficiently matched, and the general shape is comparable to other thermosets (see Fig. 13).56,59 As above, for smoother results either a larger set of realisations of the same resin setup or a larger resin setup is needed.
5.5 Bulk modulus
In its solid form the thermoset's overall mechanical behaviour is assumed to be visco-elastic, where the viscous part is only associated to pure shear deformation. Shear deformations of interest in real systems occur over a much longer time scale than is accessible in MD so for simplicity only the bulk modulus K of the commercial resin is characterised in the following. The characterisation happens with non-equilibrium molecular dynamics simulations (NEMD), which determine K by a volume tension-compression test varying all box lengths by 1% in compression and tension (≈3.03% in volume). The thermodynamic background of this is the definition of the bulk modulus K (see e.g. Landau and Lifshits60), | (8) |
Evaluation: The bulk modulus simulations were carried out in an NVT ensemble for 6 ns. For each set of {ζ, Θ} one cycle of the volume tension-compression test was recorded (e.g., Fig. 14a). The cycle starts with compression and is controlled by fix deform. The evaluation for one data point is shown in Fig. 14a, where the volume and pressure change are referenced to their initial values.
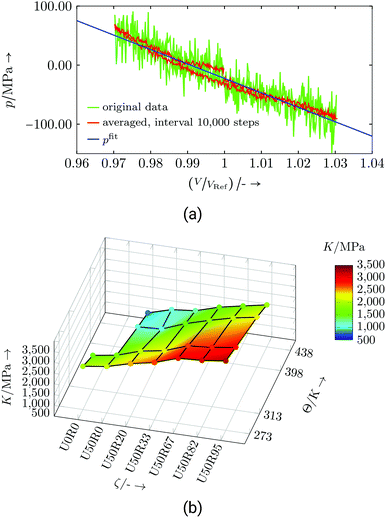 | ||
| Fig. 14 Commercial resin system: (a) Exemplary bulk modulus evaluation for U50R33 at 273 K, (b) bulk modulus dependent on temperature Θ and degree of cure ζ. | ||
The linear regression, whose slope gives the bulk modulus, is done on the basis of the averaged data, and the first quarter of the cycle was neglected to exclude undesired start-up effects. The resulting bulk moduli over the examined parameter range are depicted in Fig. 14b and listed in Table S7.† The magnitude of the bulk modulus is in common ranges of thermosets.47,48 Both, changes in temperature and degree of cure, show a nearly linear dependence and follows the reasoning that less interconnection or higher temperature reduces the stiffness. Some of the bulk modulus values were calculated from MD simulations using fix nve/limit as a time integrator (marked with the numeral 1 in Table S7†). For the numerical background the reader is referred to ESI section V.†
6. Conclusion
We detailed algorithms describing bond formation and dissociation procedures, and use them on-the-fly in reaction simulations on the class of thermoset hybrid resins. For application, two hybrid resins of the same class are introduced: a virtual resin and one derived from a commercially available resin. The reaction runs are analysed themselves, but also different stages of the simulated chemical reaction are used to calculate the temperature-dependent material property development.The radical reaction step of the two-stage reaction simulation has similarities in behaviour and shape compared to experimental findings in literature. Also derived quantities, such as the volume shrinkage have the same magnitude as resins of the same thermoset class. The calculated material properties of the commercial-type resin, thermal as well as mechanical, are in a reasonable range of typical thermosets and their behaviour with degree of cure and temperature follows physical premises. Nevertheless, a larger variety of initial or larger system domains may further smooth out outliers or finite-size effects in the pattern of results.
Experimentally determined material properties of this resin type are necessary to quantify calculated material properties more clearly.
Conflicts of interest
There are no conflicts to declare.Acknowledgements
We thank the DFG (German Research Foundation) for funding our investigations in the framework of the International Research Training Group 2078. We acknowledge in general ALIANCYS AG and in particular Ron Verleg for helpful discussions on the resin system DARON® AQR 1009. For helpful discussions and suggestions on thermosets we want to thank Prof. Wilhelm's group at the ITCP (KIT), especially Lorenz Faust. We also would like to thank Timothy Sirk, who helped us by sharing parts of his work on bond formation algorithms and stimulating input on this topic. This research was enabled in part by support provided by Compute Ontario (http://www.computeontario.ca), WestGrid (http://www.westgrid.ca), Compute Canada (http://www.computecanada.ca) and the supercomputer ForHLR funded by the Ministry of Science, Research and the Arts Baden-Württemberg and by the Federal Ministry of Education and Research of Germany.References
- R. Verleg and E. Hummer, COMPOSITES 2006 Convention and Trade Show, American Composites Manufacturers Association, 2006, pp. 1–16.
- E. Hornbogen, G. Eggeler and E. Werner, Werkstoffe: Aufbau und Eigenschaften von Keramik-, Metall-, Polymer- und Verbundwerkstoffen, Springer-Verlag, Berlin, Heidelberg, 10th edn, 2012, p. 596 Search PubMed.
- A. R. Bunsell, Handbook of Properties of Textile and Technical Fibres, Woodhead Publishing, Duxford, UK, 2018 Search PubMed.
- Q. Cheng, B. Wang, C. Zhang and Z. Liang, Small, 2010, 6, 763–767 CrossRef CAS PubMed.
- P. Wang, X. Zhang, G. Lim, H. Neo, A. A. Malcolm, Y. Xiang, G. Lu and J. Yang, J. Mater. Sci., 2015, 50, 5978–5992 CrossRef CAS.
- L. Daelemans, S. van der Heijden, I. De Baere, H. Rahier, W. Van Paepegem and K. De Clerck, ACS Appl. Mater. Interfaces, 2016, 8, 11806–11818 CrossRef CAS PubMed.
- H. Yang, L. Ye, J. Gong, M. Li, Z. Jiang, X. Wen, H. Chen, N. Tian and T. Tang, Mater. Chem. Front., 2017, 1, 716–726 RSC.
- L. Daelemans, W. Van Paepegem, D. R. D′hooge and K. De Clerck, Adv. Funct. Mater., 2019, 29, 1807434 CrossRef.
- T. A. Osswald and G. Menges, Materials Science of Polymers for Engineers, 2012, p. 595 Search PubMed.
- B. J. Alder and T. E. Wainwright, J. Chem. Phys., 1957, 27, 1208–1209 CrossRef CAS.
- B. J. Alder and T. E. Wainwright, J. Chem. Phys., 1959, 31, 459–466 CrossRef CAS.
- B. J. Alder and T. E. Wainwright, J. Chem. Phys., 1960, 33, 1439–1451 CrossRef CAS.
- J. M. Barton, G. J. Buist, A. S. Deazle, I. Hamerton, B. Howlin and J. R. Jones, Polymer, 1994, 35, 4326–4333 CrossRef CAS.
- J. M. Barton, A. S. Deazle, I. Hamerton, B. J. Howlin and J. R. Jones, Polymer, 1997, 38, 4305–4310 CrossRef CAS.
- I. Hamerton, C. R. Heald and B. J. Howlin, J. Mater. Chem., 1996, 6, 311–314 RSC.
- D. C. Doherty, Comput. Theor. Polym. Sci., 1998, 8, 169–178 CrossRef CAS.
- I. Yarovsky and E. Evans, Polymer, 2002, 43, 963–969 CrossRef CAS.
- D. R. Heine, G. S. Grest, C. D. Lorenz, M. Tsige and M. J. Stevens, Macromolecules, 2004, 37, 3857–3864 CrossRef CAS.
- C. Wu and W. Xu, Polymer, 2006, 47, 6004–6009 CrossRef CAS.
- C. Li and A. Strachan, Polymer, 2011, 52, 2920–2928 CrossRef CAS.
- C. Li, E. Coons and A. Strachan, Acta Mech., 2014, 225, 1187–1196 CrossRef.
- T. Okabe, T. Takehara, K. Inose, N. Hirano, M. Nishikawa and T. Uehara, Polymer, 2013, 54, 4660–4668 CrossRef CAS.
- T. Okabe, Y. Oya, K. Tanabe, G. Kikugawa and K. Yoshioka, Eur. Polym. J., 2016, 80, 78–88 CrossRef CAS.
- N. Sharp, C. Li, A. Strachan, D. Adams and R. B. Pipes, J. Polym. Sci., Part B: Polym. Phys., 2017, 55, 1150–1159 CrossRef CAS.
- L. Gao, Q. Zhang, H. Li, S. Yu, W. Zhong, G. Sui and X. Yang, Polym. Chem., 2017, 8, 2016–2027 RSC.
- S. Saiev, L. Bonnaud, P. Dubois, D. Beljonne and R. Lazzaroni, Polym. Chem., 2017, 8, 5988–5999 RSC.
- Large Atomic/Molecular Massively Parallel Simulator (LAMMPS), Version 31Mar17, Sandia National Laboratories, http://lammps.sandia.gov/ Search PubMed.
- S. Plimpton, J. Comput. Phys., 1997, 117, 1–42 CrossRef.
- C. Jang, T. W. Sirk, J. W. Andzelm and C. F. Abrams, Macromol. Theory Simul., 2015, 24, 260–270 CrossRef CAS.
- H. Sun and D. Rigby, Spectrochim. Acta, Part A, 1997, 53, 1301–1323 CrossRef.
- H. Sun, J. Phys. Chem. B, 1998, 102, 7338–7364 CrossRef CAS.
- H. Sun, P. Ren and J. R. Fried, Comput. Theor. Polym. Sci., 1998, 8, 229–246 CrossRef CAS.
- C. T. Campbell, The strength of chemical bonds at solid surfaces on, Butterworths, London, 1954 Search PubMed.
- S. W. Benson, J. Chem. Educ., 1965, 42, 502 CrossRef CAS.
- B. deB Darwent, Bond dissociation energies in simple molecules, U.S. National Bureau of Standards, Washington D.C., 1970 Search PubMed.
- Avogadro Chemistry, Avogadro: an open-source molecular builder and visualization tool, Version 1.20, http://avogadro.cc/ Search PubMed.
- M. D. Hanwell, D. E. Curtis, D. C. Lonie, T. Vandermeersch, E. Zurek and G. R. Hutchison, J. Cheminf., 2012, 4, 17 CAS.
- Aliancys AG , Product Data Sheet Daron AQR 1009.
- S. G. Advani and E. M. Sozer, Process Modeling in Composites Manufacturing, CRC Press, Boca Raton, FL, 1st edn, 2002, p. 630 Search PubMed.
- A. Stukowski, Open Visualization Tool (OVITO), Version 2.9.0, https://ovito.org/ Search PubMed.
- A. Stukowski, Modell. Simul. Mater. Sci. Eng., 2010, 18, 15012 CrossRef.
- D. Frenkel and B. Smit, Understanding Molecular Simulation: From Algorithms to Applications, Academic Press, San Diego, 2002, p. 664 Search PubMed.
- D. C. Rapaport, The Art of Molecular Dynamics Simulation, Cambridge University Press, Cambridge, 2nd edn, 2004 Search PubMed.
- G. Wypych, Handbook of Odors in Plastic Materials, ChemTec Publishing, Toronto, ON, 2nd edn, 2017, p. 260 Search PubMed.
- R. W. Warfield, M. C. Petree and P. Donovan, The specific heat of thermosetting polymers, Naval ordnance lab technical report, 1959.
- R. W. Warfield, M. C. Petree and P. Donovan, J. Appl. Chem., 1960, 10, 429–432 CrossRef CAS.
- Physical Properties of Polymers Handbook, ed. J. E. Mark, Springer-Verlag, New York, 2nd edn, 2007, p. 1076 Search PubMed.
- Granta Design, CES EduPack, version 2018, http://www.grantadesign.com/education/edupack/ Search PubMed.
- M. S. Green, J. Chem. Phys., 1954, 22, 398–413 CrossRef CAS.
- R. Kubo, J. Phys. Soc. Jpn., 1957, 12, 570–586 CrossRef.
- R. Kubo, M. Yokota and S. Nakajima, J. Phys. Soc. Jpn., 1957, 12, 1203–1211 CrossRef.
- P. C. Howell, J. Chem. Phys., 2012, 137, 224111 CrossRef CAS PubMed.
- L. D. Landau and E. M. Lifshits, Fluid mechanics, Pergamon Press, Oxford, UK, 1959 Search PubMed.
- J. Kulawik, Z. Szeglowski, T. Czapla and J. P. Kulawik, Colloid Polym. Sci., 1989, 267, 970–975 CrossRef CAS.
- C. F. Jekel and G. Venter, pwlf: A Python Library for Fitting 1D Continuous Piecewise Linear Functions, 2019 Search PubMed.
- J. P. Pascault and R. J. J. Williams, J. Polym. Sci., Part B: Polym. Phys., 1990, 28, 85–95 CrossRef CAS.
- A. Rudin and P. Choi, The Elements of Polymer Science & Engineering, Academic Press, San Diego, 3rd edn, 2013, p. 584 Search PubMed.
- A. T. DiBenedetto, J. Polym. Sci., Part B: Polym. Phys., 1987, 25, 1949–1969 CrossRef CAS.
- A. Schiraldi, P. Baldini and E. Pezzati, J. Therm. Anal., 1985, 30, 1343–1348 CrossRef CAS.
- L. D. Landau and E. M. Lifshits, Theory of Elasticity, Pergamon Press, Oxford, UK, 1959 Search PubMed.
Footnote |
| † Electronic supplementary information (ESI) available: Details on resin systems, force-field, reaction algorithms, material properties and time integration. See DOI: 10.1039/C9PY00521H |
| This journal is © The Royal Society of Chemistry 2019 |

