 Open Access Article
The emulsion polymerization induced self-assembly of a thermoresponsive polymer poly(N-vinylcaprolactam)†
Joonas
Siirilä
 a,
Satu
Häkkinen
 b and
Heikki
Tenhu
 *a
*a
aUniversity of Helsinki, Helsinki, Finland. E-mail: heikki.tenhu@helsinki.fi
bUniversity of Warwick, Coventry, Northern Ireland, UK
First published on 26th December 2018
Abstract
A thermoresponsive polymer, poly(N-vinylcaprolactam) (PNVCL), was synthesized in an emulsion above its thermal transition temperature to produce particles via polymerization induced self-assembly (PISA). Two amphiphilic poly(ethylene glycol) (PEG) based xanthates were compared as macro-chain transfer agents (mCTAs) for RAFT/MADIX polymerization; thus the products were PEG-PNVCL block copolymers. Only the mCTA with a higher PEG degree of polymerization (DP) was able to stabilize the particles during the polymerization. The morphologies of the particles ranged from spherical with an inner lumen (vesicle) to spherical with a denser core and looser shell upon increasing the DP of PNVCL. This article provides proof of the polymerization induced self-assembly (PISA) of NVCL in an emulsion, producing higher morphologies (vesicles, i.e. spherical particles with an inner lumen) than the most commonly found spherical core–shell particles. Molecular weight analysis via size exclusion chromatography (SEC) revealed that the polymers had an Mn value close to the theoretical one. However, some PEG chains were not incorporated into the polymer but were observed as separated populations. This problem was resolved by reaction parameter optimization. Increasing the initiator concentration led to a decrease in polymer dispersity (Đ) from 1.5 to 1.2 and to all PEG being incorporated into the formed polymer. The optimized reaction parameters were used to synthesize high molecular weight PNVCL, with an Mw value of 1.27 × 10⁶ g ml−1 (Mn: 810![[thin space (1/6-em)]](https://www.rsc.org/images/entities/char_2009.gif) 000 g mol−1), which had a PEG (5000 g mol−1) end-group. The size of the high molecular weight polymer particles was in the micrometer range and thus too big for proper analysis with light scattering. The polymerization produced particles were stable at the polymerization temperature (50 °C) but disassembled upon cooling to room temperature (22 °C) due to the polymer becoming soluble. To prevent the dissolution of the polymer, the particles were stabilized through hydrogen bonding through adding salicylic acid.
000 g mol−1), which had a PEG (5000 g mol−1) end-group. The size of the high molecular weight polymer particles was in the micrometer range and thus too big for proper analysis with light scattering. The polymerization produced particles were stable at the polymerization temperature (50 °C) but disassembled upon cooling to room temperature (22 °C) due to the polymer becoming soluble. To prevent the dissolution of the polymer, the particles were stabilized through hydrogen bonding through adding salicylic acid.
Introduction
PNVCL is a biocompatible polymer,1 which exhibits LCST (lower critical solution temperature) type thermoresponsive behavior in aqueous solutions, i.e. the polymer turns insoluble upon heating. The phase transition temperature is close to body temperature and is dependent on the molecular mass and concentration of the polymer.2 Thus for applications based on the amphiphilic, thermoswitchable nature of PNVCL, control over the molecular mass and a narrow molecular mass distribution are essential for optimal performance.Studied application fields for PNVCL include its use in drug delivery,3–11 nanoreactors for catalysis,12,13 enzyme entrapping,14 dye-affinity chromatography,15 wastewater treatment,16 flocculation17 and thermoswitchable pressure sensitive adhesives.18,19 A more comprehensive description of possible applications can be found in a recent review by Cortez-Lemus and Licea-Claverie.20
The first successful controlled polymerizations of N-vinylcaprolactam, NVCL, i.e. RAFT polymerization in bulk, were reported in 2008.21 Following that publication, NVCL has been RAFT/MADIX polymerized by several groups, in bulk,22,23 in various different organic solvents,24–30 and also in water/ethanol mixtures.31 NVCL has also been synthesized via ATRP32,33 and cobalt-mediated polymerization.34,35 All of the reported polymerizations of NVCL that have led to narrow dispersity (Đ < 1.5) have, as far as we know, been conducted under conditions where PNVCL is soluble. The molecular masses have ranged from a few thousand up to 153![[thin space (1/6-em)]](https://www.rsc.org/images/entities/char_2009.gif) 000 g mol−1. The highest molecular mass product obtained was synthesized via RAFT/MADIX polymerization in solution, and the molecular mass value corresponds to a typical upper limit for the applied method.36
000 g mol−1. The highest molecular mass product obtained was synthesized via RAFT/MADIX polymerization in solution, and the molecular mass value corresponds to a typical upper limit for the applied method.36
To obtain higher molecular masses, special conditions need to be applied to suppress side reactions.36 A good choice for water insoluble monomers is to conduct RAFT polymerization in an emulsion. In emulsion polymerization, the segregation of the polymerization loci leads to the suppression of bimolecular termination reactions, and thus allows the controlled synthesis of higher molecular mass products. Surfactant-free RAFT/MADIX emulsion polymerization has been recently reviewed by Zhou et al.37 This method has been used, for example, to produce high molecular mass polystyrene38 and poly(glycerol monomethacrylate).39 Here, the surfactant-free RAFT/MADIX emulsion polymerization of NVCL is studied for the synthesis of high molecular mass PNVCL. Another appealing aspect of surfactant-free RAFT emulsion polymerization, and the main motivation for this work, is the formation of particles during synthesis. PNVCL based particles, which are essentially colloidal hydrogels, have been intensely studied for different biomedical applications, especially for cancer drug delivery.4–8,11,40,41 The PNVCL particles are typically synthesized via free-radical emulsion/precipitation polymerization at temperatures were PNVCL is not soluble.4–8,11,40–47 The downsides of the method include the presence of free polymer (not bound to the particles), uneven crosslinking in the particles, and the difficulty of removing surfactants from the product. We see surfactant-free emulsion polymerization as an alternative synthesis method to produce PNVCL particles. The benefits include a higher solid content, the absence of surfactants that would be left as impurities in the product, and the different expected structures of the particles because the particles are formed via polymerization induced self-assembly (PISA). PISA reactions in aqueous heterogeneous media have been recently reviewed in four papers.48–51 In short, in PISA reactions, the chain extension of a solvophilic/amphiphilic chain with a solvophobic monomer leads to the self-assembly of the growing chains into well-defined particle morphologies. Ideally, the particle morphologies can be tuned through the block ratio, developing from spheres to worms to vesicles as a function of the degree of polymerization (DP) of the solvophobic block. This type of morphology transformation has commonly been observed in dispersion polymerizations where the monomer is soluble under the reaction conditions and the polymer is not. Typically in aqueous emulsion polymerization, only solid core–shell spheres are obtained.48,49 This was true also for the, as far as we know, only reported surfactant free RAFT emulsion polymerization of NVCL.52 In that work, NVCL was copolymerized with vinyl acetate to produce particles.
In the current report, we describe the controlled surfactant-free RAFT/MADIX emulsion polymerization of NVCL. Poly(ethylene glycol) (PEG) based xanthate is used as the chain transfer agent in the reaction. The aim was to utilize the strengths of the polymerization method, i.e. to synthesize high molecular mass PNVCL with control over the molecular mass and to synthesize PNVCL particles with distinct morphologies as a function of the PNVCL DP. In addition, we show that particles composed solely of PEG and PNVCL can be “frozen” via H-bonding, through adding salicylic acid (SA). Without SA, the assembled particles disassemble upon cooling due to PNVCL becoming soluble. This SA “freezing” is a method we have used previously as well.9,53
Experimental
Materials
All chemicals were used as received from suppliers unless otherwise stated. Poly(ethylene glycol) methyl ether (mPEG113-OH; average Mn: 5000 g mol−1), poly(ethylene glycol) methyl ether (mPEG42-OH; average Mn: ∼1900 g mol−1), 2-bromopropionyl bromide (97%), sodium hydroxide (NaOH; ≥98%), potassium ethyl xanthogenate (96%), and Trizma base, i.e. 2-amino-2-(hydroxymethyl)-1,3-propanediol (Tris; ≥99.9%), were purchased from Sigma-Aldrich. N-Vinylcaprolactam (NVCL; 98%) was purchased from Aldrich and recrystallized twice from toluene prior to use. 2,2′-Azobis[2-(2-imidazolin-2-yl)propane]dihydrochloride (VA-044) was purchased from Wako Chemicals and recrystallized from methanol. Dichloromethane (CH2Cl2; 99.99%) was purchased from Fischer Scientific and dried over regenerated 4 Å molecular sieves before use. Diethyl ether (100.0%) and hydrochloric acid (HCl; 37%) were purchased from VWR Chemicals. Triethylamine (TEA; ≥99%) was purchased from Merck. Sodium hydrogen carbonate (NaHCO3; 99.9%) was purchased from Fischer Scientific. Magnesium sulfate (MgSO4; anhydrous; >99.5%) was purchased from Alfa Aesar. Salicylic acid (SA; 99.9%) was purchased from BDH Chemicals Ltd (Poole, England). Dimethylsulfoxide-d6 (DMSO-d6; 99.8% D) and deuterium oxide (D2O; 99.96% D) were obtained from Euriso-Top. Dialysis was conducted using Cellu Sep T1 regenerated cellulose tubular membranes from Orange Scientific with a nominal molecular weight cut-off of 3500 Da. Purified H2O (resistivity > 5 MΩ cm) was used throughout the study.Synthesis of the PEG-based xanthate macro-chain transfer agents
The synthesis of two PEG-based xanthate macro-chain transfer agents (mCTA) with different PEG DP values (42 or 113) was conducted following the literature,54 with slight modifications. The products are referred to as PEG42-X and PEG113-X, respectively. The synthesis scheme is presented in Fig. 1. A detailed synthesis description and product analysis via1H-NMR are presented in the ESI.†The surfactant-free emulsion polymerization of NVCL: stabilization of the polymer particles
NVCL, VA-044, PEGn-X, and buffer (0.1 M Tris; pH = 7.4) were weighed in a reaction flask. The mass of the buffer was always 10 g and the amounts of the other reagents were adjusted accordingly. The mixture was bubbled with nitrogen or argon for 1 hour at ambient temperature. The reaction mixture was then moved to a preheated oil bath: T = 50 °C. The reaction mixture was stirred with a magnetic stirrer at 400 rpm for the duration of the reaction time. Conversion samples were taken after suitable time intervals. After the conversion reached over 95% or the reaction seemed to have stopped, according to two sequential conversion measurements, the reaction flask was opened to air.Saturated SA aqueous solution was prepared by dissolving excess SA in water for 24 hours at ambient temperature under magnetic stirring. Undissolved SA was filtered off.
Polymer particles to be analysed via light scattering were stabilized with SA by taking a drop from the reaction mixture with a heated pipette and diluting it at 50 °C with saturated aqueous SA solution. The polymer concentration was then approximately 0.25 mg ml−1. A corresponding sample without SA was prepared by dilution with pure water. The concentrations are calculated based on weight and may deviate from the actual concentrations.
After the preparation of samples for light scattering studies, the rest of the polymerization mixture was allowed to cool to room temperature and was purified via dialysis and dried via freeze drying. The purified products were analysed with 1H-NMR and SEC.
Characterization
1H-NMR spectra were recorded using a 500 MHz Bruker Avance III spectrometer at 23 °C.Size exclusion chromatography (SEC) measurements were performed with Waters ACQUITY APC apparatus connected to an ACQUITY refractive index detector. The flow rate was 0.6 ml min−1. The columns used were ACQUITY APC columns of 200 Å, 450 Å and 900 Å. Measurements were performed at 30 °C. The eluent was THF. Low dispersity PMMA samples were used as a reference.
All light scattering measurements were performed using a setup involving a Brookhaven Instruments BI-200SM goniometer, a BIC-TurboCorr digital pseudo-cross-correlator, a BI-CrossCorr detector and a blue 488 nm laser (Coherent Sapphire laser 488-100 CDRH) using 10 mW of power. The sample cell was connected to a Lauda RC 6 CP thermostat.
LS measurements were performed at 50 or 22 °C. Samples were equilibrated for 30 min inside the instrument at the measuring temperature prior to measurement. Measurements were performed at 130°, 110°, 90°, 70°, 50° and 30° scattering angles.
Pseudo-cross-correlation functions of the scattered light intensity were collected at different angles using the self-beating scheme. Correlation functions were analysed using an inverse Laplace transformation (CONTIN) in the Brookhaven Instruments dynamic light scattering software. Apparent mean hydrodynamic radii from intensity weighted distributions obtained at different angles were plotted against the squared scattering vector (q2) and the hydrodynamic radius extrapolated to zero q2 was used as the actual hydrodynamic radius. The inverse relaxation time of the correlation function (Γ) versus q2 was plotted to confirm that the movement recorded was actually translational diffusion. It was seen that the Γ versus q2 dependence was linear and the fitted line went through 0.
The radius of gyration was obtained from the averaged scattering intensity simultaneously with DLS at different angles. The value was extracted from the dependence of the scattering form function on the scattering vector. From the different models tried, the Guinier model was the best for all samples studied.
SA stabilized samples were analysed with cryogenic electron microscopy (cryo-TEM). Samples were prepared with a Leica EMGP vitrification device from 3 μL aliquots on freshly glow-discharged Quantifoil R2/2 grids. The samples were observed using an FEI Talos Arctica microscope operated at 200 kV. The images were recorded at a magnification of 57![[thin space (1/6-em)]](https://www.rsc.org/images/entities/char_2009.gif) 000× with an FEI Falcon 3 camera operating in linear mode.
000× with an FEI Falcon 3 camera operating in linear mode.
Results and discussion
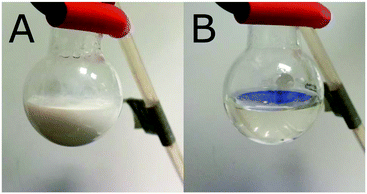
Polymerizations were performed in aqueous buffer (0.1 M TRIS) at 50 °C and a pH of 7.4. The buffer was used to prevent hydrolysis of the monomer during polymerization, which has been observed during aqueous polymerizations of NVCL.55 All polymerizations were performed under conditions where NVCL is not soluble. The solubility of NVCL was measured to be 15 g L−1 in pure water at 22 °C and 35 g L−1 or 36 g L−1 in TRIS at 22 and 50 °C, respectively (experiment details presented in ESI†). The ingredients in the polymerization mixture were the buffer, initiator, monomer and a PEG-based xanthate chain transfer agent. The reaction variables, including PEG chain length, targeted PNVCL length, total concentration and initiator concentration, were systematically varied. After dialysis and drying, products were analysed in THF with size exclusion chromatography (PMMA was used as a reference) to show the dependence of the molecular mass on design and to prove that there was control of the polymerization. The particles themselves formed during the synthesis were analysed after synthesis with light scattering at 50 °C. The particles disintegrated upon cooling to ambient temperatures (Fig. 2). To study the particles via electron microscopy and store the particles assembled also at ambient temperatures, the particles were “frozen” via hydrogen bonding with salicylic acid, using a previously reported method.9,53Finding a suitable DP of PEG mCTAs
A series of surfactant-free MADIX emulsion polymerizations were performed using either PEG113-X or PEG42-X as the chain transfer agent in the polymerization to study the effects of the PEG DP on the synthesis. Details are presented in Table 1.| mCTA | C(NVCl)0 (g ml−1) | [M0]![[thin space (1/6-em)]](https://www.rsc.org/images/entities/char_2009.gif) : :![[thin space (1/6-em)]](https://www.rsc.org/images/entities/char_2009.gif) [CTA] [CTA]![[thin space (1/6-em)]](https://www.rsc.org/images/entities/char_2009.gif) : :![[thin space (1/6-em)]](https://www.rsc.org/images/entities/char_2009.gif) [I] [I] |
Stabilitya | Conv. (%) |
|---|---|---|---|---|
| a U = unstable; S = stable. C(NVCL)0 is the mass concentration of NVCL in the feed; [M]/[CTA]/[I] is the ratio of molar concentrations in the feed. Conv. is the conversion, determined via1H-NMR. | ||||
| PEG42-X | 0.04 | 500/1/0.3 | U | 78 |
| 0.08 | 500/1/1 | U | 86 | |
| 0.1 | 500/1/0.3 | U | 85 | |
| 0.1 | 200/1/0.3 | U | 83 | |
| PEG113-X | 0.04 | 500/1/0.3 | S | 9 |
| 0.08 | 500/1/0.3 | S | 84 | |
| 0.1 | 500/1/0.3 | S | 97 | |
| 0.1 | 200/1/0.3 | S | 97 | |
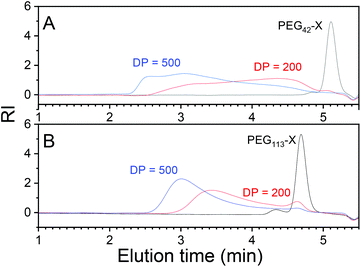
Only the polymerizations performed with PEG113-X were free of coagula. In polymerizations with PEG42-X at a 0.1 g ml−1 NVCL starting concentration, the formation of a coagulum/gel during synthesis was so extensive that the magnetic bar stopped spinning during the polymerization. Obviously, mPEG42-X was not effective enough as a stabilizer for the polymerization. The formation of coagula was also reflected in the molecular masses of the products obtained from SEC chromatograms (Fig. 3). Polymerization with mPEG42-X gave broad multimodal molecular masses compared to products with mPEG113-X.
A similar but less dramatic effect was observed earlier by Rieger at al. when studying the impact of the PEG DP of a PEG-based trithiocarbonate macro-chain transfer agent on the emulsion copolymerization of methyl methacrylate (MMA) and N-butylacrylate.56 The CTA containing the smallest example of PEG (DP ≈ 27) was too small to properly stabilize the particles, which resulted in multimodal molecular mass distribution and the formation of a small amount of aggregates. Here, the required DP of PEG is larger, probably due to better compatibility between PEG and PNVCL compared to PEG with MMA and BA. Hence, PEG is more likely to be trapped in the coalescing copolymers of PNVCL than in MMA-co-BA and, thus, longer PEG is needed to keep the particles separated. Laukkanen et al. have shown that when a PNVCL-co-PEG42-undecylmethacrylate polymer self-assembles to spherical particles in water upon heating, PEG is partly trapped inside the particles.57 Due to the colloidal instability observed with PEG42-X, PEG113-X was used in the rest of the polymerizations.
The effects of reaction parameters on molar mass and control
Three series of polymerizations were performed with PEG113-X as the mCTA, systematically changing the reaction parameters, i.e. the CTA and initiator concentrations, total concentration, and initiator concentration, one at a time. The highest monomer concentration in Table 1, 0.1 g ml−1, was used as a starting point, as this concentration produced the highest conversion.The effects of the varied parameters on the molecular mass were evaluated after dialysis and drying via SEC in THF. Conclusions regarding the control of polymerization were based on SEC data. In RAFT/MADIX polymerization, the molecular mass is determined via the ratio of monomer to chain transfer agent following eqn (1), where Mn is the number average molecular mass of the polymer, [M]0 is the monomer concentration at t = 0, [CTA] is the concentration of chain transfer agent, Mmonomer is the molar mass of the monomer and Mn(CTA) is the number average molecular mass of the mCTA.
 | (1) |
The effects of mCTA (and initiator) concentration
The aim was to synthesize polymers with different PNVCL DPs. This was done by varying the mCTA to monomer ratio. The initiator concentration was adjusted accordingly to keep the ratio of mCTA to initiator constant. This approach is typical for RAFT polymerization.36,48 In the absence of bimolecular termination reactions, the amount of produced radicals should correspond to the amount of polymer chains at the end of polymerization. Thus, the ratio of initiator to mCTA determines how many of the formed polymers have an initiator derived end group and how many have an mCTA leaving group as an end group. As the leaving group of the used mCTA contains the PEG chain, the initiator to mCTA ratio determines how much of the product consists of PEG-PNVCL copolymer compared to PNVCL homopolymer. The reaction details and SEC results are presented in Table 2.| C 0(NVCL) = 0.1 g ml−1, i.e. [M]0 = 0.718 mol | |||||
|---|---|---|---|---|---|
[M0]![[thin space (1/6-em)]](https://www.rsc.org/images/entities/char_2009.gif) : :![[thin space (1/6-em)]](https://www.rsc.org/images/entities/char_2009.gif) [CTA] [CTA]![[thin space (1/6-em)]](https://www.rsc.org/images/entities/char_2009.gif) : :![[thin space (1/6-em)]](https://www.rsc.org/images/entities/char_2009.gif) [I] [I] |
Conv. (%) | DPn | Mntheory (g mol−1) | MnSEC (g mol−1) | Đ (Mw/Mn) |
| SEC results correspond to the main peak. Conv. = conversion; DPn = [M]0/[CTA] × Conv.; Mntheory is calculated with eqn (1). MnSEC is the value obtained via SEC in THF using PMMA standards. | |||||
| 200/1/0.3 | 97 | 194 | 32![[thin space (1/6-em)]](https://www.rsc.org/images/entities/char_2009.gif) 000 000 |
47![[thin space (1/6-em)]](https://www.rsc.org/images/entities/char_2009.gif) 600 600 |
1.3 |
| 350/1/0.3 | 97 | 340 | 52![[thin space (1/6-em)]](https://www.rsc.org/images/entities/char_2009.gif) 000 000 |
61![[thin space (1/6-em)]](https://www.rsc.org/images/entities/char_2009.gif) 400 400 |
1.4 |
| 500/1/0.3 | 97 | 485 | 73![[thin space (1/6-em)]](https://www.rsc.org/images/entities/char_2009.gif) 000 000 |
72![[thin space (1/6-em)]](https://www.rsc.org/images/entities/char_2009.gif) 300 300 |
1.5 |
| 1000/1/0.3 | 98 | 980 | 141![[thin space (1/6-em)]](https://www.rsc.org/images/entities/char_2009.gif) 000 000 |
122![[thin space (1/6-em)]](https://www.rsc.org/images/entities/char_2009.gif) 000 000 |
1.3 |
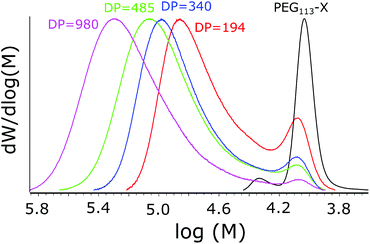
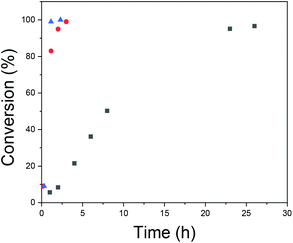
All the polymerizations proceeded to high conversions (over 95%). The molecular masses increased upon decreasing the mCTA concentration, evidencing success in synthesizing polymers with different PNVCL DPs. The Mn values obtained were relatively close to the theoretical ones calculated with eqn (1), and the dispersities (Đ = Mw/Mn) were all below or equal to 1.5. However, an additional peak or shoulder was observed in the molecular weight distribution (MWD) profiles presented in Fig. 4. The shoulder is only slightly shifted in comparison to mCTA and obviously corresponds to PEG113-X with only a short oligomer attached. A similar shoulder was observed by Etchenausia et al. during the surfactant-free emulsion copolymerization of NVCL and VAc52 and by Binauld et al. during the emulsion polymerization of VAc.58 The presence of the shoulder makes the calculated DP values slightly differ from the actual DP of PNVCL. The kinetic profiles of the polymerizations, as studied via NMR, are presented in ESI Fig. S4.†
The effects of the total concentration
The effects of the total concentration on the molecular weight distribution were studied, as the concentration is known to influence the self-assembly process.48 A series of polymers was synthesized where the concentration of reagents was varied while the ratio between them was kept constant. Polymerization details and SEC results are presented in Table 3. From the MWD distributions, shown in Fig. 5, it can be seen how increasing the total concentration led to a narrower MWD, with the relative size of the shoulder corresponding to small Mn compounds decreased.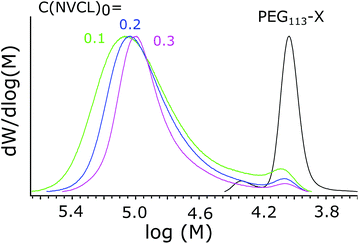 | ||
| Fig. 5 MWDs of polymers synthesized with different total concentrations. The starting concentration of NVCL is marked next to each line in g ml−1. PEG113-X is shown as a reference. | ||
| [M0]/[mCTA]/[I] = 500/1/0.3 | ||||
|---|---|---|---|---|
| C(NVCL)0 (g ml−1) | Conv. (%) | Mntheory (g mol−1) | MnSEC (g mol−1) | Đ (Mn/Mw) |
| SEC results correspond to the main peak. Conv. = conversion; DPn = [M]0/[I] × Conv.; Mntheory is calculated with eqn (1). MnSEC is the value obtained via SEC in THF using PMMA standards. | ||||
| 0.1 | 97 | 72![[thin space (1/6-em)]](https://www.rsc.org/images/entities/char_2009.gif) 500 500 |
72![[thin space (1/6-em)]](https://www.rsc.org/images/entities/char_2009.gif) 300 300 |
1.5 |
| 0.2 | 98 | 73![[thin space (1/6-em)]](https://www.rsc.org/images/entities/char_2009.gif) 200 200 |
71![[thin space (1/6-em)]](https://www.rsc.org/images/entities/char_2009.gif) 400 400 |
1.4 |
| 0.3 | 98 | 73![[thin space (1/6-em)]](https://www.rsc.org/images/entities/char_2009.gif) 200 200 |
72![[thin space (1/6-em)]](https://www.rsc.org/images/entities/char_2009.gif) 100 100 |
1.3 |
The kinetics of the polymerizations were studied with NMR, and the results are presented in Fig. 6. The kinetic profiles are typical for emulsion polymerization.59 First there is a period with an increasing rate of polymerization (interval I), secondly there is a period with a constant reaction rate, (interval II) and finally there is a period of decreasing reaction rate (interval III). Interval I is referred to as the particle nucleation period and is the period where the polymerization locus moves from the aqueous phase with a low monomer concentration to monomer-swollen particles/micelles, which have a higher monomer concentration. From Fig. 6 it can be seen how increasing the total concentration leads to faster polymerization and, especially, to a shorter nucleation period. The rate of nucleation has also been connected to the polymer molecular weight distribution in prior literature relating to RAFT emulsion polymerizations, i.e. an increased nucleation rate has been shown to result in a narrower molecular weight distribution of the formed polymer.51 The reason for this is that particles nucleated at different times will have different compositions of reagents and this introduces heterogeneity to the polymerization loci. In RAFT/MADIX polymerizations, the homogeneity of the polymerization loci is important.60–62 The propagating chains have similar sizes due to rapid and reversible chain transfer between the chains and due to the suppression of side reactions. If the particles where the propagation takes place are different in terms of the composition of reagents and there is not sufficient exchange of material, the result will be polymers with different lengths.
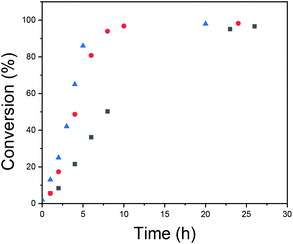 | ||
Fig. 6 Conversion versus time for different polymerization total concentrations: [NVCL]0 =  0.1 g ml−1; 0.1 g ml−1;  0.2 g ml−1; and 0.2 g ml−1; and  0.3 g ml−1. 0.3 g ml−1. | ||
A conclusion is that increasing the total concentration led to faster polymerization with a shorter nucleation period. This facilitated more mCTA being incorporated into the particles, and to more homogeneous environments for chain growth. These effects were reflected in the SEC results, as Đ became smaller.
The effects of initiator concentration
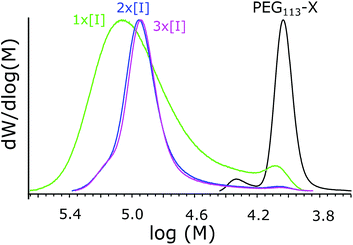
As discussed above, usually in RAFT polymerizations the ratio of initiator to chain transfer agent is kept as low as possible; this still obtains the radical flux needed for polymerization but it maximizes the amount of chemically identical polymers.36,48 However, Yan et al. have described a broadened MWD when decreasing the initiator concentration in the seeded RAFT emulsion polymerization of styrene.60 The effect was explained via differences between active and inactive particles due to an insufficient flux of radicals that produce heterogeneous conditions for chain growth in different particles. Increasing the initiator concentration is also expected to increase the rate of reaction and shorten the nucleation period, which has already been connected to better Mn control in an above section. For these reasons, the effects of initiator concentration were studied.The reaction details and SEC data are presented in Table 4. From the MWDs presented in Fig. 7, it can be seen how increasing the initiator concentration reduces the width of the distribution and how the fraction containing smaller polymers disappears. Kinetic data is presented in Fig. 8. From the data, it can be seen how increasing the initiator concentration led to faster polymerization, as was expected. The effect of increasing the initiator concentration on the MWDs and the kinetics was stronger compared to that of increasing the total concentration. Thus, we see increasing the initiator concentration as being the preferred way to improve control over polymerization. However, it has to be noted that a narrow MWD does not guarantee chemically homogenous polymers and the ratio between the homopolymers and copolymers produced needs to be studied.
| C 0(NVCL) = 0.1 g ml−1i.e. [M]0 = 0.718 mol/l | ||||
|---|---|---|---|---|
[M0]![[thin space (1/6-em)]](https://www.rsc.org/images/entities/char_2009.gif) : :![[thin space (1/6-em)]](https://www.rsc.org/images/entities/char_2009.gif) [CTA] [CTA]![[thin space (1/6-em)]](https://www.rsc.org/images/entities/char_2009.gif) : :![[thin space (1/6-em)]](https://www.rsc.org/images/entities/char_2009.gif) [I] [I] |
Conv. (%) | Mntheory (g mol−1) | MnSEC (g mol−1) | Đ (Mn/Mw) |
| SEC results correspond to the main peak. Conv. = conversion; DPn = [M]0/[I] × Conv.; Mntheory is calculated with eqn (1). MnSEC is the value obtained via SEC in THF using PMMA standards. | ||||
| 500/1/0.3 | 97 | 72![[thin space (1/6-em)]](https://www.rsc.org/images/entities/char_2009.gif) 500 500 |
72![[thin space (1/6-em)]](https://www.rsc.org/images/entities/char_2009.gif) 300 300 |
1.5 |
| 500/1/0.6 | 99 | 73![[thin space (1/6-em)]](https://www.rsc.org/images/entities/char_2009.gif) 900 900 |
74![[thin space (1/6-em)]](https://www.rsc.org/images/entities/char_2009.gif) 700 700 |
1.2 |
| 500/1/0.9 | 100 | 74![[thin space (1/6-em)]](https://www.rsc.org/images/entities/char_2009.gif) 600 600 |
75![[thin space (1/6-em)]](https://www.rsc.org/images/entities/char_2009.gif) 700 700 |
1.2 |
The synthesis of high molecular mass PNVCL
Surfactant-free RAFT emulsion polymerization is known to be well-suited to the synthesis of high molecular mass polymers.36–39 Observations from previous polymerizations were used to design the synthesis of a high molecular weight polymer. The selected monomer/PEG113-X/initiator ratio was 6000/1/0.9 and the initial NVCL concentration was 0.1 g ml−1. A stable, coagulum-free dispersion was obtained in 20 h with 98% monomer conversion.According to SEC data, the Mn value of the polymer was 350![[thin space (1/6-em)]](https://www.rsc.org/images/entities/char_2009.gif) 000 g mol−1 and Đ was 1.5 (the chromatogram is presented in the ESI, Fig. S6†). This is, however, believed to be an underestimate caused by a few factors. The first of these is the difference between the MMA standard and the studied copolymers. Finding SEC standards for a series of copolymers (PNVCL-PEG) where the size of the other block increases from a few tens of thousands to close to million is obviously a challenge and might be impossible. The second issue is that the well-known problem of polymer adsorption to the stationary phase gets more severe upon increasing the molar mass. Hence, the results for the high molecular weight polymer from SEC can be used only to describe the relatively narrow molecular weight distribution. For the actual molecular weight analysis, we rely on static light scattering, which gives an absolute Mw value. The Mw according to light scattering analysis is 1.27 million g mol−1 and the analysis details are presented in the ESI.† The Mn value of 847
000 g mol−1 and Đ was 1.5 (the chromatogram is presented in the ESI, Fig. S6†). This is, however, believed to be an underestimate caused by a few factors. The first of these is the difference between the MMA standard and the studied copolymers. Finding SEC standards for a series of copolymers (PNVCL-PEG) where the size of the other block increases from a few tens of thousands to close to million is obviously a challenge and might be impossible. The second issue is that the well-known problem of polymer adsorption to the stationary phase gets more severe upon increasing the molar mass. Hence, the results for the high molecular weight polymer from SEC can be used only to describe the relatively narrow molecular weight distribution. For the actual molecular weight analysis, we rely on static light scattering, which gives an absolute Mw value. The Mw according to light scattering analysis is 1.27 million g mol−1 and the analysis details are presented in the ESI.† The Mn value of 847![[thin space (1/6-em)]](https://www.rsc.org/images/entities/char_2009.gif) 000 g mol−1 is obtained by calculating Mn from the light scattering Mw value and using the Đ value of 1.5 from SEC. The theoretical Mn value is 823
000 g mol−1 is obtained by calculating Mn from the light scattering Mw value and using the Đ value of 1.5 from SEC. The theoretical Mn value is 823![[thin space (1/6-em)]](https://www.rsc.org/images/entities/char_2009.gif) 000 g mol−1. From 1H-NMR end-group analysis, we obtain an Mn value of 810
000 g mol−1. From 1H-NMR end-group analysis, we obtain an Mn value of 810![[thin space (1/6-em)]](https://www.rsc.org/images/entities/char_2009.gif) 000 g mol−1 (the 1H-NMR spectra and calculations are presented in the ESI†).
000 g mol−1 (the 1H-NMR spectra and calculations are presented in the ESI†).
Based on experimental evidence, we conclude the polymer to have an Mn value of 810![[thin space (1/6-em)]](https://www.rsc.org/images/entities/char_2009.gif) 000 g mol−1 and a Mw value of 1270
000 g mol−1 and a Mw value of 1270![[thin space (1/6-em)]](https://www.rsc.org/images/entities/char_2009.gif) 000 g mol−1 (Đ = 1.56). According to our knowledge, this is the highest molecular mass value achieved for PNVCL synthesized in a controlled manner, i.e. having such a low Đ value. The achievement is impressive considering the high monomer conversion (98%) and over 90% yield after purification.
000 g mol−1 (Đ = 1.56). According to our knowledge, this is the highest molecular mass value achieved for PNVCL synthesized in a controlled manner, i.e. having such a low Đ value. The achievement is impressive considering the high monomer conversion (98%) and over 90% yield after purification.
Particle sizes and shapes
As the main motivation behind this work, particle shape and morphology were studied. In the PISA concept, the morphology of the self-assembled particles is dictated by the block ratio. Because of this, we focus on the polymers described in Table 2. First, particles formed through self-assembly during polymerization were investigated via light scattering at 50 °C. The samples taken from the reaction mixtures were not allowed to cool before measurement. Light scattering data is given in Table 5.Hydrodynamic radius (Rh) values are presented in Table 5 in the form of hydrodynamic diameter (Dh= 2 × Rh) to be consistent with the literature on PNVCL-based microgel particles.4–8,11,41–43,47 The hydrodynamic radii of the particles stayed relatively constant upon decreasing the mCTA concentration, with the polymer with the highest PNVCL DP differing from the others by being clearly larger. Rh was expected to increase upon decreasing the mCTA concentration, as the mCTA acts as a dispersion stabilizer and decreasing the stabilizer content usually results in increased particle size.
Radius of gyration (Rg) values were obtained from the angular dependence of the normalized averaged scattering intensity measured at several angles. The ratio of the two radii, Rg/Rh, is known to reflect the shape and mass distribution of scattering objects.63–67 0.775 is the theoretical value for a compact sphere, where mass is distributed homogenously through the particle.66 Hydrogel particles with a dense core and looser, freely dangling chains in the shell show typical Rg/Rh values of around 0.6.64,67 For vesicles and polymersomes where all the mass is located on the surface of the particle, the Rg/Rh value should theoretically be 1.63Rg/Rh = 0.944 has been reported for lecithin vesicles.65 An Rg/Rh value of 0.86 corresponds to a vesicle where the wall thickness equals the diameter of the inner lumen.68 Values of above 1 are no longer strictly spherical objects. 1.5 is a typical Rg/Rh value for a random coil.66
R g/Rh values for the synthesized particles are given in Table 5. The value decreases as the DP of PNVCL increases. This indicates that in particles of PNVCL with a higher DP, the mass is located closer to the core.
Laukkanen et al. stabilized thermal self-assemblies of PNVCL-co-PEG-alkylmethacrylate polymers with phenols to preserve their integrity at ambient temperatures.9,53 The stabilization was based on hydrogen bonding and the stabilized particles were referred to as “frozen”, as they were no longer thermoresponsive. Here, salicylic acid was used to stabilize the assembled particles at 50 °C and pH 2.6. The particles were stable after cooling and were studied via LS. The Rh and Rg values at 22 °C are presented in Table 5. The “frozen” particles are slightly larger at 22 °C than at 50 °C. Upon cooling, the mass distribution changes slightly, highlighting the differences between particles with different PNVCL DPs.
The “frozen” particles, whose data is presented in Table 5, were imaged with cryogenic transmission electron microscopy. Images are presented in Fig. 9. The same particle size trend with decreasing [mCTA] was observed with cryo-TEM and LS. The particles with the lowest PNVCL DP had a lighter “eye” in the center of the particles. This agrees with the LS data, which shows larger Rg/Rh values for these particles. As the DP of PNVCL is increased from 194 to 485, the particles turn more homogenous, with only slight changes in size according to both LS and cryo-TEM. The particles with a PNVCL DP of 980 differ by being larger and having a denser core.
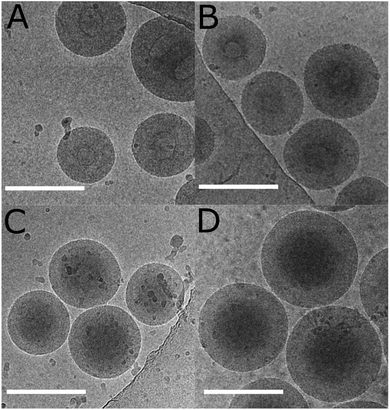 | ||
| Fig. 9 Cryo-TEM images of the SA “frozen” dispersions whose data is presented in Table 5: (A) DP = 194; (B) DP = 340; (C) DP = 485; and (D) DP = 980. The scale bar is 200 nm. | ||
These observations correspond to the morphological transformation of vesicles where the membrane grows solely inwards as a function of the solvophobic block length, leading the lumen/inner encapsulated fluid phase to become smaller and finally non-existent. This behaviour has been previously observed by Armes et al. for the dispersion PISA polymerization of poly(2-hydroxypropyl methacrylate) using a poly(glycerol monomethacrylate) mCTA, and was suggested to be universal.69 For the polymerization series in Table 5, the lumen gets smaller as the PNVCL DP is increased from 194 to 485. The polymer with a DP of 485 does not actually have a lumen. Further increasing the PNVCL DP to 980 resulted in larger particles, as there was no lumen where the membrane could grow: the particle had grown outwards.
Our current results show that self-assembly takes place during polymerization and results in particles with distinctly different morphologies. To create worms or vesicles containing larger lumens, we suggest aiming to lower the PNVCL DP.
The cryo-TEM images also shed light on the surprisingly high Rg/Rh ratio for the “frozen” particles with the shortest PNVCL length (DP = 194). In the images, some big multicore particles were observed (Fig. 10), which presumably were formed when the “frozen” particle solution was cooled from 50 °C to 22 °C and PNVCL became more solvophilic. The increased solvophilicity facilitated the fusion of the particles. It seems that for lower PNVCL lengths (DP ≤ 194), the interactions with SA are not enough to allow particles to keep their shape upon cooling.
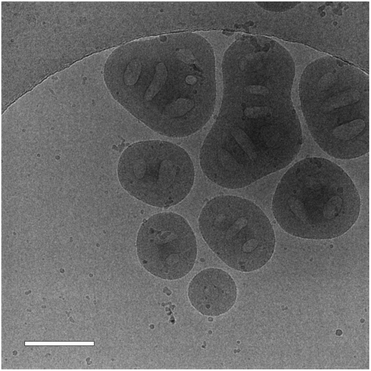 | ||
| Fig. 10 A cryo-TEM image of a SA “frozen” dispersion with a PNVCL DP of 194. The scale bar is 200 nm. | ||
Particle size and shape analysis was performed with LS also for other polymerization series, i.e. for polymerizations with varying initiator concentrations and polymerizations with different total concentrations. The effects of these parameters on particle shape were marginal. The results are presented in ESI Tables S1 and S2.†
Detailed LS analysis was not performed on the large Mn PNVCL due to its large size and seemingly broad particle size distribution (bimodal particle size). cryo-TEM images of the largest polymer are presented in the ESI† and show the presence of 1.3 μm spherical particles. In addition, a small amount (3/12) of smaller, approximately 400 nm particles was observed.
The dilution of SA “frozen” particles
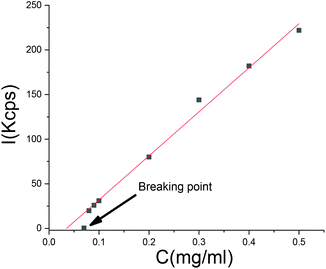
A dilution experiment was carried out with one of the SA “frozen” particles. Upon dilution with pure water, the scattering intensity decreased in a linear fashion with concentration, but the size of the particles remained unchanged until a critical point where the linear dependency of the scattering intensity on concentration was lost. At this point, which we refer to as the breaking point, the intensity diminished to a value close to the scattering of pure water (Fig. 11). Before the breaking point, the particle size was independent of dilution. At the breaking point, the scattering intensity decreased to a level too low for particle size analysis. We conclude that there exists an equilibrium between SA in the aqueous phase and in the particles, respectively. At a certain dilution, the particles do not contain enough salicylic acid anymore and the polymer dissolves.Conclusions
Successful RAFT/MADIX emulsion polymerizations of NVCL were performed in aqueous buffer at 50 °C using a PEG based macro-chain transfer agent. Molecular masses increased according to design. PEG-PNVCL block copolymers were obtained with Mn values close to the targeted Mn values, from 32![[thin space (1/6-em)]](https://www.rsc.org/images/entities/char_2009.gif) 000 to 810
000 to 810![[thin space (1/6-em)]](https://www.rsc.org/images/entities/char_2009.gif) 000 g mol−1, with moderate dispersities (Đ ≤ 1.6) and high conversions (over 95%). The crude products of the polymerizations were dispersions formed via PISA. This is the first time pure NVCL has been shown to undergo a PISA reaction. The particle shape was dictated by the DP of PNVCL. Particles with a PNVCL DP of 194 or 380 were vesicle type, with an inner lumen. Particles with a higher PNVCL DP (485 or 980) had denser cores and looser shells. The self-assembled spherical particles disintegrate upon cooling, due to the polymer becoming soluble. The particles remain self-assembled upon cooling if stabilized via hydrogen bonding with salicylic acid. From studies on the effects of initiator concentration and total concentration, it can be concluded that Đ and the reaction time can be decreased by increasing either of these parameters. Increasing the initiator concentration had the strongest effect. The reaction time could be reduced from 20 h to 2 h and Đ could be decreased from 1.5 to 1.2 upon tripling the initiator concentration when synthesizing PNVCL with a targeted DP of 500.
000 g mol−1, with moderate dispersities (Đ ≤ 1.6) and high conversions (over 95%). The crude products of the polymerizations were dispersions formed via PISA. This is the first time pure NVCL has been shown to undergo a PISA reaction. The particle shape was dictated by the DP of PNVCL. Particles with a PNVCL DP of 194 or 380 were vesicle type, with an inner lumen. Particles with a higher PNVCL DP (485 or 980) had denser cores and looser shells. The self-assembled spherical particles disintegrate upon cooling, due to the polymer becoming soluble. The particles remain self-assembled upon cooling if stabilized via hydrogen bonding with salicylic acid. From studies on the effects of initiator concentration and total concentration, it can be concluded that Đ and the reaction time can be decreased by increasing either of these parameters. Increasing the initiator concentration had the strongest effect. The reaction time could be reduced from 20 h to 2 h and Đ could be decreased from 1.5 to 1.2 upon tripling the initiator concentration when synthesizing PNVCL with a targeted DP of 500.
Conflicts of interest
There are no conflicts to declare.Acknowledgements
The cryoEM unit and HiLIFE, University of Helsinki are acknowledged for the cryo-EM data collection. Vladimir Aseyev is acknowledged for valuable discussion concerning the light scattering results. The Academy of Finland is acknowledged for financial support (project number 307475).References
- H. Vihola, A. Laukkanen, L. Valtola, H. Tenhu and J. Hirvonen, Biomaterials, 2005, 16, 3055–3064 CrossRef PubMed.
- F. Meeussen, E. Nies, H. Berghmans, S. Verbrugghe, E. Goethals and F. Du Prez, Polymer, 2000, 41, 8597–8602 CrossRef CAS.
- P. Mani, J. J. Grailer, D. A. Steeber and G. Shaoqin, Macromol. Biosci., 2009, 9, 744–753 CrossRef PubMed.
- K. Madhusudana Rao, B. Mallikarjuna, K. S. V. Krishna Rao, S. Siraj, K. Chowdoji Rao and M. C. S. Subha, Colloids Surf., B, 2013, 102, 891–897 CrossRef CAS PubMed.
- Y. Wang, J. Nie, B. Chang, Y. Sun and W. Yang, Biomacromolecules, 2013, 14, 3034–3046 CrossRef CAS PubMed.
- K. Sudhakar, K. Madhusudana Rao, M. C. S. Subha, K. Chowdoji Rao and E. Rotimi Sadiku, Polym. Sci., Ser. B, 2015, 57, 638–644 CrossRef CAS.
- N. Sanoj Rejinold, M. Muthunarayanan, V. V. Divyarani, P. R. Sreerekha, K. P. Chennazhi, S. V. Nair, H. Tamura and R. Jayakumar, J. Colloid Interface Sci., 2011, 360, 39–51 CrossRef CAS PubMed.
- M. A. González-Ayón, J. A. Sañudo-Barajas, L. A. Picos-Corrales and A. Licea-Claverie, J. Polym. Sci., Part A: Polym. Chem., 2015, 53, 2662–2672 CrossRef.
- V. Henna, L. Antti, T. Heikki and H. Jouni, J. Pharm. Sci., 2008, 97, 4783–4793 CrossRef PubMed.
- H. Vihola, A. Laukkanen, J. Hirvonen and H. Tenhu, Eur. J. Pharm. Sci., 2002, 16, 69–74 CrossRef CAS PubMed.
- S. Lou, S. Gao, W. Wang, M. Zhang, Q. Zhang, C. Wang, C. Li and D. Kong, J. Appl. Polym. Sci., 2014, 131, 41146 CrossRef.
- H. Jia, D. Schmitz, A. Ott, A. Pich and Y. Lu, J. Mater. Chem. A, 2015, 3, 6187–6195 RSC.
- X. Li, T. Cai and E. Kang, Macromolecules, 2016, 49, 5649–5659 CrossRef CAS.
- I. Y. Galaev and B. Mattiasson, Biotechnol. Tech., 1992, 6, 353–358 CrossRef CAS.
- I. Y. Galaev, C. Warrol and B. Mattiasson, J. Chromatogr. A, 1994, 684, 37–43 CrossRef CAS.
- E. Churilina, P. Sukhanov, Y. Korenman and G. Shatalov, Russ. J. Appl. Chem., 2010, 83, 1054–1058 CrossRef CAS.
- G. V. Shatalov, V. N. Verezhnikov, E. V. Churilina, V. A. Kuznetsov and T. N. Poyarkova, Russ. J. Appl. Chem., 2003, 76, 1839–1843 CrossRef CAS.
- K. A. Bovaldinova, M. M. Feldstein, N. E. Sherstneva, A. P. Moscalets and A. R. Khokhlov, Polymer, 2017, 10–20 CrossRef CAS.
- M. M. Feldstein, K. A. Bovaldinova, E. V. Bermesheva, A. P. Moscalets, E. E. Dormidontova, V. Y. Grinberg and A. R. Khokhlov, Macromolecules, 2014, 47, 5759–5767 CrossRef CAS.
- N. A. Cortez-Lemus and A. Licea-Claverie, Prog. Polym. Sci., 2016, 53, 1–51 CrossRef CAS.
- D. Wan, Q. Zhou, H. Pu and G. Yang, J. Polym. Sci., Part A: Polym. Chem., 2008, 46, 3756–3765 CrossRef CAS.
- L. Etchenausia, A. M. Rodrigues, S. Harrisson, E. Deniau Lejeune and M. Save, Macromolecules, 2016, 49, 6799–6809 CrossRef CAS.
- L. Shao, M. Hu, L. Chen, L. Xu and Y. Bi, React. Funct. Polym., 2012, 72, 407–413 CrossRef CAS.
- V. Kozlovskaya, F. Liu, B. Xue, F. Ahmad, A. Alford, M. Saeed and E. Kharlampieva, Biomacromolecules, 2017, 18, 2552–2563 CrossRef CAS PubMed.
- J. Liu, C. Detrembleur, M. De Pauw-Gillet, S. Mornet, E. Duguet and C. Jerome, Polym. Chem., 2014, 5, 799–813 RSC.
- F. Jia, S. Wang, X. Zhang, C. Xiao, Y. Tao and X. Wang, Polym. Chem., 2016, 7, 7101–7107 RSC.
- N. A. Cortez-Lemus and A. Licea-Claverie, Polymers, 2018, 10, 20 CrossRef.
- X. Zhao, O. Coutelier, H. H. Nguyen, C. Delmas, M. Destarac and J. Marty, Polym. Chem., 2015, 6, 5233–5243 RSC.
- M. Karesoja, E. Karjalainen, S. Hietala and H. Tenhu, J. Phys. Chem. B, 2014, 118, 10776–10784 CrossRef CAS PubMed.
- M. Beija, J. Marty and M. Destarac, Chem. Commun., 2011, 47, 2826–2828 RSC.
- I. Van Nieuwenhove, S. Maji, M. Dash, S. Van Vlierberghe, R. Hoogenboom and P. Dubruel, Polym. Chem., 2017, 8, 2433–2437 RSC.
- S. Pooja, S. Ambika and K. Rajesh, J. Polym. Sci., Part A: Polym. Chem., 2012, 50, 1503–1514 CrossRef.
- X. Jiang, Y. Li, G. Lu and X. Huang, Polym. Chem., 2013, 4, 1402–1411 RSC.
- M. Hurtgen, J. Liu, A. Debuigne, C. Jerome and C. Detrembleur, J. Polym. Sci., Part A: Polym. Chem., 2012, 50, 400–408 CrossRef CAS.
- A. Kermagoret, C. Fustin, M. Bourguignon, C. Detrembleur, C. Jérôme and A. Debuigne, Polym. Chem., 2013, 4, 2575 RSC.
- S. Perrier, Macromolecules, 2017, 50, 7433–7447 CrossRef CAS.
- J. Zhou, H. Yao and J. Ma, Polym. Chem., 2018, 9, 2532–2561 RSC.
- X. Zhang, D. Liu, X. Lv, M. Sun, X. Sun and W. Wan, Macromol. Rapid Commun., 2016, 37, 1735–1741 CrossRef CAS PubMed.
- C. P. Jesson, V. J. Cunningham, M. J. Smallridge and S. P. Armes, Macromolecules, 2018, 51, 3221–3232 CrossRef CAS PubMed.
- S. Bian, J. Zheng, X. Tang, D. Yi, Y. Wang and W. Yang, Chem. Mater., 2015, 27, 1262–1268 CrossRef CAS.
- N. S. Rejinold, R. G. Thomas, M. Muthiah, K. P. Chennazhi, I. Park, Y. Y. Jeong, K. Manzoor and R. Jayakumar, RSC Adv., 2014, 4, 39408–39427 RSC.
- M. A. Gonzalez-Ayon, N. A. Cortez-Lemus, A. Zizumbo-Lopez and A. Licea-Claverie, Soft Mater., 2014, 12, 315–325 CrossRef CAS.
- A. Imaz and J. Forcada, J. Polym. Sci., Part A: Polym. Chem., 2008, 46, 2766–2775 CrossRef CAS.
- A. Laukkanen, S. K. Wiedmer, S. Varjo, M. Riekkola and H. Tenhu, Colloid Polym. Sci., 2002, 280, 65–70 CrossRef CAS.
- A. Laukkanen, S. Hietala, S. L. Maunu and H. Tenhu, Macromolecules, 2000, 33, 8703–8708 CrossRef CAS.
- F. Schneider, A. Balaceanu, A. Feoktystov, V. Pipich, Y. Wu, J. Allgaier, W. Pyckhout-Hintzen, A. Pich and G. J. Schneider, Langmuir, 2014, 30, 15317–15326 CrossRef CAS PubMed.
- A. Imaz and J. Forcada, J. Polym. Sci., Part A: Polym. Chem., 2008, 46, 2510–2524 CrossRef CAS.
- S. L. Canning, G. N. Smith and S. P. Armes, Macromolecules, 2016, 49, 1985–2001 CrossRef CAS PubMed.
- S. Chen, P. Shi and W. Zhang, Chin. J. Polym. Sci., 2017, 35, 455–479 CrossRef CAS.
- B. Charleux, G. Delaittre, J. Rieger and F. D'Agosto, Macromolecules, 2012, 45, 6753–6765 CrossRef CAS.
- M. J. Monteiro and M. F. Cunningham, Macromolecules, 2012, 45, 4939–4957 CrossRef CAS.
- L. Etchenausia, A. Khoukh, E. Deniau Lejeune and M. Save, Polym. Chem., 2017, 8, 2244–2256 RSC.
- A. Laukkanen, L. Valtola, F. M. Winnik and H. Tenhu, Polymer, 2005, 18, 7055–7065 CrossRef.
- J. Liu, C. Detrembleur, M. De Pauw-Gillet, S. Mornet, E. Duguet and C. Jérôme, Polym. Chem., 2014, 5, 799–813 RSC.
- A. Imaz, J. I. Miranda, J. Ramos and J. Forcada, Eur. Polym. J., 2008, 44, 4002–4011 CrossRef CAS.
- J. Rieger, G. Osterwinter, C. Bui, F. Stoffelbach and B. Charleux, Macromolecules, 2009, 42, 5518–5525 CrossRef CAS.
- A. Laukkanen, F. M. Winnik and H. Tenhu, Macromolecules, 2005, 38, 2439–2448 CrossRef CAS.
- S. Binauld, L. Delafresnaye, B. Charleux, F. D'Agosto and M. Lansalot, Macromolecules, 2014, 47, 3461–3472 CrossRef CAS.
- C. S. Chern, Prog. Polym. Sci., 2006, 5, 443–486 CrossRef.
- K. Yan; and Y. Luo, React. Chem. Eng., 2017, 2, 159–167 RSC.
- J. Qiu, B. Charleux and K. Matyjaszewski, Prog. Polym. Sci., 2001, 26, 2083–2134 CrossRef CAS.
- P. B. Zetterlund, Polym. Chem., 2011, 2, 534–549 RSC.
- L. K. E. A. Abdelmohsen, R. S. M. Rikken, P. C. M. Christianenvan, J. C. M. Hest and D. A. Wilson, Polymer, 2016, 107, 445–449 CrossRef CAS.
- V. Boyko, A. Pich, Y. Lu, S. Richter, K. Arndt and H. P. Adler, Polymer, 2003, 26, 7821–7827 CrossRef.
- E. Constable, C. S. Mundwiler, W. Meier and C. Nardin, Chem. Commun., 1999, 1483–1484 RSC.
- W. Schärtl, Light scattering from polymer solutions and nanoparticle dispersions, Springer, Berlin, 2007 Search PubMed.
- H. Senff; and W. Richtering, Colloid Polym. Sci., 2000, 278, 830–840 CrossRef.
- H. Dou, M. Jiang, H. Peng, D. Chen and Y. Hong, Angew. Chem., Int. Ed., 2003, 42, 1516–1519 CrossRef CAS PubMed.
- N. J. Warren, O. O. Mykhaylyk, A. J. Ryan, M. Williams, T. Doussineau, P. Dugourd, R. Antoine, G. Portale and S. P. Armes, J. Am. Chem. Soc., 2015, 137, 1929–1937 CrossRef CAS PubMed.
Footnote |
| † Electronic supplementary information (ESI) available. See DOI: 10.1039/c8py01421c |
| This journal is © The Royal Society of Chemistry 2019 |


