Ultrafast dynamics of the antibiotic Rifampicin in solution†
Lorenzo
Angiolini
 ,
Boiko
Cohen
 * and
Abderrazzak
Douhal
 *
*
Departamento de Química Física, Facultad de Ciencias Ambientales y Bioquímica and INAMOL, Universidad de Castilla-La Mancha, Avenida Carlos III, S/N, 45071 Toledo, Spain. E-mail: boyko.koen@uclm.es; abderrazzak.douhal@uclm.es
First published on 25th September 2018
Abstract
Rifampicin (Rif) is an effective antibiotic against mycobacterial infections and a wide range of Gram-positive and Gram-negative bacteria. The geometry, conformation and the intramolecular H-bond network of Rif can affect its antibacterial efficiency. In this work, we report on the excited-state dynamics of Rif in sodium phosphate buffer and dichloromethane solutions using femtosecond time-resolved spectroscopic methods. The femtosecond UV-Vis-nearIR transient absorption and fluorescence up-conversion experiments reveal an ultrafast (<100 fs) Franck–Condon relaxation with a partial charge transfer character in S1, and a short-lived emission (τ ∼ 6 ps) due to a non-radiative relaxation to the ground state, associated with the stretching of the vibrational mode of the Rif internal H-bond network. The large Stokes-shifted emission (∼6800 cm−1) indicates a significant electronic change in the excited-state. In deuterated potassium phosphate buffer, the decay time becomes longer (∼20 ps). The large kinetic isotope effect (KIE) of ∼4 on the decay rate indicates that the stretching modes of the internal H-bond network are slowed by the H/D isotope substitution. The results provide new information on the dynamics of Rif structures and the related processes in aqueous solutions, showing that the internal H-bonding interactions are the ones that govern the ground and excited state properties of Rif but water molecules exert additional stabilization of its zwitterionic form through intermolecular H-bonds, which is responsible for its high antimicrobial activity.
Introduction
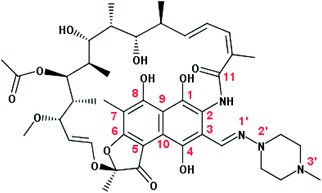
Rifampicin (Rif, Scheme 1) is an antibiotic drug that belongs to the chemical class of naphthalenic ansamycins.1 It shows strong antibacterial activity against a broad spectrum of Gram-positive and Gram-negative bacteria, and is mainly used to treat tuberculosis and leprosy infections.2 The mechanism of action of Rif consists in binding to the DNA dependent RNA polymerase β subunit and thus inhibiting the protein transcription process, which leads to the death of the bacterial cells. The interaction with the β subunit is predominantly driven by van der Waals interactions with the long hydrophobic side chain near the naphthalene core of Rif, and by hydrogen bond (H-bond) interactions with the polar groups on the naphthol ring and on the aliphatic bridge.3 Recently, studies of the Rif crystal structures and its analogues in complexes with the RNA polymerase (in solution) reported a fundamental relationship between the structural conformations of Rif-based antibiotics and their antibacterial activity.4Rif presents a rigid structure with flexibility restricted by a system of strong intramolecular H-bonds (Scheme 1). In protic solvents, the proton transfer (PT) reaction forces the structure to a zwitterion form that shows a conformation different from the neutral one observed in aprotic solvents.5 A new binding model with the RNA polymerase was described taking into account that in water, Rif is present in a zwitterionic form and that a proton is transferred from the OH group at C8 to the piperazine N3′ nitrogen atom, creating further interactions with the protein subunit. Additionally, it was demonstrated that different substituents at the C3 site can cause changes in the geometry of the molecule, modifying the spatial arrangement of the OH groups involved in the binding and further affecting Rif's antibacterial activity. Once delivered into the body, Rif is found under different conditions in biological media and interacts with several molecules (i.e. ions, macromolecules) that can affect the Rif conformation, thus possibly affecting its antibacterial activity.
Ultrafast femtosecond (fs) spectroscopy is a powerful tool to study the excited-state behaviour of various dyes and drugs in chemical and biological systems.6–10 Recently, we have reported on ultrafast studies of different drugs (Levosimendan, Piroxicam and Milrinone) in solutions.10–12 We observed that changing the surrounding media modifies the structures of the drugs, their excited-state dynamics, and possibly their activity. Considering the relevance of the Rif structure and stability to its activity, it is important to unravel its ground and excited state dynamics in aqueous solutions. To date, the effect of water molecules on Rif conformational dynamics has not been characterized; thus an ultrafast spectroscopic study can fill this gap and provide further information to understand Rif behaviour in biological media.
Here, we report on a systematic study of Rif in aqueous solutions and in an organic solvent (dichloromethane, DCM) using ultrafast optical techniques. Time-resolved fluorescence up-conversion and transient absorption experiments reveal that after electronic excitation (to S1 or to S2) of Rif, an ultrafast emission from the Franck–Condon state takes place, probably associated with a charge transfer and a change in its conformations. These ultrafast events occur in a time shorter that 100 fs and are reflected by a large Stokes shift (∼6800 cm−1) of the emission spectrum. In sodium phosphate buffer (pH 7.1), the excited Rif at S1 state relaxes to the ground state (S0) in ∼4–6 ps, which suggests the presence of an ultrafast non-radiative relaxation channel. This decay time increases to 20 ps in deuterated potassium phosphate buffer, leading to a large kinetic isotope effect (KIE) of 4, which indicates the involvement of several H-bonding interactions with water molecules at the S1 state. The lack of KIE in deuterated DCM further confirms the importance of water molecules in the relaxation dynamics of excited Rif. In a DCM solution, the lifetime increases slightly up to 7.7 ps. Our results clearly demonstrate the combined action of both intramolecular and intermolecular H-bonds of Rif to stabilize its zwitterionic form and retain its high antimicrobial activity.
Experimental
Materials
Rifampicin (Rif, Sigma-Aldrich, red powder, ≥97% pure), dichloromethane (DCM, 99.9% pure), dichloromethane-D2 (99.5 atom %D), Na2HPO4, NaH2PO4 (Scharlab), D2O (Sigma-Aldrich, 99.9 atom %D), KD2PO4 (Sigma-Aldrich, 98 atom %D) and K2HPO4 (Scharlab, 99%) were used as received.Sample preparation and experimental setup
![[thin space (1/6-em)]](https://www.rsc.org/images/entities/char_2009.gif) 000 M−1 cm−1 at 334 nm).13 The steady-state absorption spectra were measured using a JASCO V670 spectrophotometer. The buffer solution was used to avoid the oxidation process in distilled water and changes in the Rif spectroscopic properties.14 No difference was observed between the absorption spectra of Rif in water and in pH 7 buffer (before the occurrence of oxidation in water).
000 M−1 cm−1 at 334 nm).13 The steady-state absorption spectra were measured using a JASCO V670 spectrophotometer. The buffer solution was used to avoid the oxidation process in distilled water and changes in the Rif spectroscopic properties.14 No difference was observed between the absorption spectra of Rif in water and in pH 7 buffer (before the occurrence of oxidation in water).
The fs transient absorption experiments were performed using a chirped pulse amplification setup.16 The setup consists of a Ti:sapphire oscillator (TISSA 100, CDP Systems) pumped by a 5 W diode laser (Verdi 5, Coherent). The seed pulse (30 fs, 450 mW at 86 MHz) was centred at 800 nm and then directed to an amplifier (Legend-USP, Coherent). The amplified fundamental beam (50 fs, 1 W at 1 kHz) pumps an optical parametric amplifier (OPA) for wavelength conversion (CDP Systems). The fourth (340 and 460 nm) harmonic of the OPA output was used as a pump. Portion (∼ 5%) of the 800 nm amplifier output is sent through a delay line and used to generate a white-light continuum in a 3 mm thick sapphire crystal. The white-light continuum is split into two identical probes and reference beams which are directed to a rotating cell containing the sample (1.0 mm thick), where the probe and the pump beams are overlapped. The transmitted light is focused to light guides, directed to a spectrograph and collected by a pair of photodiode arrays (CDP Systems). The obtained signal was measured as a difference in the optical density (ΔOD) of the sample probed by the white light continuum with and without pump excitation. The polarization of the pump is set to the magic angle with respect to the probe using a Berek's variable wave plate. The pump pulse intensity was maintained at ∼100–200 μW. Experiments at different excitation intensities did not show changes in the observed dynamics. The IRF was measured in terms of the OD change of DCM in similar cells, following the excitation at 340 and 460 nm to produce values of 120 and 100 fs, respectively. The ratio of the spot size of the pump with respect to the probe was always greater than 3![[thin space (1/6-em)]](https://www.rsc.org/images/entities/char_2009.gif) :
:![[thin space (1/6-em)]](https://www.rsc.org/images/entities/char_2009.gif) 1. The spot size was measured using the razor (knife)-edge method.17,18
1. The spot size was measured using the razor (knife)-edge method.17,18
Results and discussion
Steady-state absorption
To characterize the ground- and excited-state properties of Rif, we first studied its steady-state UV-visible absorption spectra in aqueous sodium phosphate buffer (pH 7.1) and in DCM (Fig. 1). In the former solution, the absorption spectrum is characterized by two bands with intensity maxima at 335 and 475 nm. These bands are assigned to π–π* transitions, associated respectively with the naphthoquinone chromophore and the electron-donating carbonyl group at C11 in the lateral chain.19–21 It has been suggested that this carbonyl group shows a charge-transfer (CT) character while interacting with the hydroxyl group at C1. In DCM solutions, the absorption observed at 335 nm in the aqueous solution shifts by 15 nm (∼1300 cm−1) to 350 nm, while the band at 475 nm remains unchanged.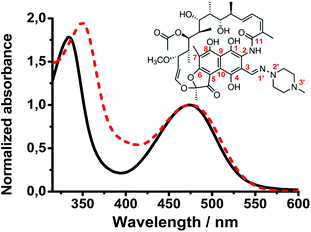 | ||
| Fig. 1 Normalized UV-Vis absorption spectra of Rif (7.7 × 10⁻⁶ M) in a water solution of sodium phosphate buffer at pH 7.1 (solid line) and in dichloromethane (dashed line). | ||
Several studies reported that in aprotic solvents, Rif is present in a neutral (phenolic) form, while in protic solvents, it behaves as a zwitterion (phenolate) form. In water, its acidic function (pKa = 1.7) is related to the OH group at C8 of the naphthoquinone core, and the basic function (pKa = 7.9) is associated with the 3-substituent piperazine moiety.4,22–24 Following a PT process in the ground state, a positive charge is localized on the N3′ atom of the piperazine moiety, while a negative charge is localized on the OH group at C8. This electronic redistribution affects the naphthoquinone chromophore molecular orbitals resulting in a change in the Rif structure that can further induce the rearrangement of the intramolecular H-bonds. When the polarity of the solvent increases, a solvatochromic effect was observed for both Rif absorption bands, with a hypsochromic shift (negative) of the UV band and a bathochromic shift (positive) of the visible band.21 Thus, we explain the observed blue shift of the UV band in aqueous solution (compared to the DCM solution) in terms of higher destabilization of the S2 state of Rif resulting from H-bond interactions with water molecules and/or from orientation–induction interactions. The CT character of the 474 nm band should lead to a strong solvatochromic effect upon the formation of intermolecular H-bonds in the buffer solution.25,26 However, we did not observe such a change, which is in contrast with the difference in the dielectric constant values of water (ε = 80.1, μ = 1.84D) and DCM (ε = 9, μ = 1.6D) and the presence of intermolecular H-bonds. This suggests that the Rif intramolecular H-bond network is strong enough and is not affected by the intermolecular H-bonds or polar interactions with water molecules to alter the S0–S1 transition.5,27–29
We also tried to record the emission spectrum and fluorescence lifetime decays of a diluted Rif solution in phosphate buffer, but we failed to obtain accurate data to be shown. This suggests that Rif shows a very low fluorescence quantum yield (<10−4), which in turn indicates the presence of ultrafast non-radiative decay channel/s of the excited-state. Therefore, we performed ultrafast fluorescence up-conversion and transient-absorption experiments to study the emitting and non-emitting species of Rif, respectively, in the buffer and DCM solutions.
Femtosecond fluorescence up-conversion
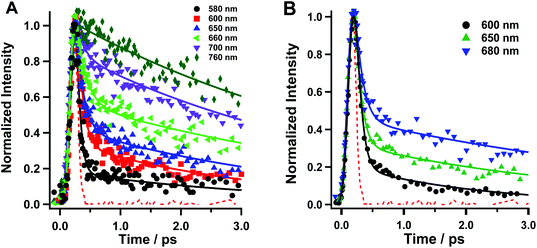
We conducted fluorescence up-conversion experiments with Rif in the phosphate buffer (pH 7.1), and in DCM solution, with excitation at 420 nm (S0–S1 transition). We gated the emission from 570 to 760 nm.Fig. 2 shows representative fs-emission decays in pH 7.1 phosphate buffer and DCM on a short time window (0–3 ps) while Table 1 shows the relevant parameters obtained from multi-exponential fits. The decays on the larger time window are given in the ESI (Fig. S1†). The analysis of the emission decays in the buffer at 580 nm yields an ultrafast component (τ1 < 100 fs, a1 = 94%) along with a fast (τ3 = 0.8 ps, a2 = 4%) and a slower (τ2 = 3.6 ps, a2 = 2%) one. The intermediate component of ∼0.8–1 ps is observed only in the decays at bluer wavelengths. At the redder part of the spectral range, and up to 720 nm, the value of τ1 remains low, while its contribution (pre-exponential factor) decreases to 33%. On the other hand, the τ2 value increases to 5.6 ps with a concomitant increase in its relative contribution (67% at 720 nm). At 740 and 780 nm, τ1 disappears completely and the only observed contribution comes from τ2, whose value increases to 5.9 ps. The fs-component reveals the occurrence of an ultrafast process, in excited Rif, which is within the instrument response function (IRF ∼ 220 fs). The value of this component and its higher contribution at the blue side of the emission spectra are within the time scale for the Frank–Condon (FC) relaxation of the excited state. Due to the charged nature of Rif, we anticipate that the locally excited (LE) state will have a certain degree of CT character. Next, we assign the τ2 component to the relaxation of the S1 state to S0. Its low value suggests the involvement of fast and efficient non-radiative processes in the relaxation of excited Rif. The lower values of τ2 at the bluest observed wavelengths in comparison with those at longer wavelengths along with τ3 reflect the occurrence of additional fast processes such as solvation/vibrational cooling (VC) that combine with the short fluorescence decay time. Many organic molecules with multi-ring structures have similar values for VC in aqueous and organic solvents ranging from ∼1 to several tens of ps.30,31 It should be noted that all components are present only as decays in the whole gated spectral region suggesting the lack of dynamical Stokes shift (DSS), which is strongly related to the solvation dynamics.32–35 Although the inertial component of the solvation dynamics in the used solvents is ultrafast (in aqueous solutions it is faster than 50 fs, while in DCM it is <200 fs), it completes on a much longer time-scale. The DSS is also associated with the occurrence of strong CT processes. Thus, in Rif, the lack of DSS suggests that the FC relaxation has a very weak CT character arising from a partial charge recombination (CR) in the optically excited zwitterion. The weak CT character of this process is a result of the strong intramolecular hydrogen bonded network that stabilizes the zwitterionic form.
| Solvent | λ obs (nm) | τ 1 (fs ± 40) | a 1 (%) | τ 2 (ps± 0.3) | a 2 (%) | τ 3 (ps ± 0.1) | a 3 (%) |
|---|---|---|---|---|---|---|---|
| Na2HPO4/NaH2PO4/H2O buffer 0.1 M | 580 | <100 | 94 | 3.6 | 2 | 0.8 | 4 |
| 600 | <100 | 83 | 3.4 | 15 | 1.0 | 2 | |
| 620 | <100 | 82 | 2.9 | 18 | — | — | |
| 650 | <100 | 77 | 3.1 | 23 | — | — | |
| 660 | <100 | 70 | 4.1 | 30 | — | — | |
| 680 | <100 | 62 | 4.5 | 38 | — | — | |
| 700 | <100 | 51 | 4.9 | 49 | — | — | |
| 720 | <100 | 33 | 5.6 | 67 | — | — | |
| 740 | — | — | 4.8 | 100 | — | — | |
| 760 | — | — | 5.9 | 100 | — | — | |
| DCM | 600 | <100 | 93 | 2.1 | 7 | — | — |
| 650 | <100 | 87 | 3.1 | 13 | — | — | |
| 680 | <100 | 78 | 4.0 | 22 | — | — |
In order to also evaluate the salt effect, the possibility of excited state intermolecular proton transfer (ESPT) and the ionic force of the media on the excited state dynamics of Rif, we performed additional measurements in phosphate buffer with a higher concentration of the phosphate salts (1 M). We did not observe a significant effect on increasing the salt concentration. Thus, we conclude that the ionic force of this buffer, at least in the studied range, has a negligible effect on the photobehaviour of Rif.
The analysis of the emission decays in DCM at 600 nm yields an ultrafast component (τ1 < 100 fs, a1 = 93%) along with a fast one (τ2 = 2.1 ps, a2 = 7%). At longer observation wavelengths, the value of τ1 remains unchanged, while its contribution decreases to 87% at 650 nm and to 78% at 680 nm. The value of τ2 increases to 3.1 ps at 650 nm and to 4 ps at 680 nm, with a contribution of 13% and 22%, respectively. Compared to the phosphate buffer solution, Rif in DCM shows similar behaviour. However, at 680 nm, the τ2 component contribution in DCM (22%) is lower than that in the phosphate buffer (38%). The value of τ2 in DCM at 600 nm (2.1 ps) is also slightly longer than that in buffer (1.7 ps). These mild variations reflect the effect of the change in polarity and the H-bond ability of the media (water) on Rif dynamics, compared to DCM.
To investigate further the effect of H-bonding and the viscosity on the relaxation dynamics of Rif, we performed additional fluorescence up-conversion experiments with Rif in methanol (MetOH) and ethylene glycol (EG) solutions, with excitation at 420 nm and gating the emission from 570 to 760 nm. Fig. S2† shows the fs-emission decays, while Table S1† exhibits the parameters obtained from multi-exponential fits. We did not observe significant changes in the emission decays of excited Rif both in MeOH and in EG, which indicates that the strength of the intermolecular H-bond interactions and the viscosity (lack of twisting motion) do not play a significant role in the relaxation of Rif to S0.
Since it was not possible to collect the steady state emission spectrum of Rif, we could not reconstruct reliable decay associated emission spectra. However, to gain approximate information about the position of the emission spectra, we reconstructed the emission spectra at longer decay times (∼5–10 ps). The resulting spectra (Fig. S3†) suggest that the Rif maximum of emission intensity is located approximately at 700 nm. At this wavelength, the emission is largely Stokes shifted (6800 cm−1) and suggests the occurrence of a large electronic change in the excited Rif structure.
Multinuclear NMR studies of zwitterion Rif crystal structures have shown a ground state intramolecular PT reaction from the OH group at C8 to the N3′ nitrogen atom in the piperazine moiety, which causes the reorganization of the intramolecular H-bonds followed by changes in the geometry of the structure.25 After the PT reaction, the H-bond between the carbonyl oxygen at C11 and the OH group at C1 is broken while a new one is formed between the amino group at C2 and the N1′ nitrogen atom. The breaking and forming of H-bonds reduce the rigidity of the molecule and modify its molecular structure. Thus, following the excitation of the zwitterion Rif, an ultrafast emission from the FC state with at least a partial CT (charge recombination, CR) character produces a new electronic redistribution and a change in its dipole moment orientation. As a result, excited Rif undergoes conformational and structural changes, which also affect the intramolecular H-bond network and the intermolecular H-bonds with the surrounding water molecules. Other ground state zwitterion molecular systems that do not have intramolecular H-bond networks have shown similar dynamics following excitation, with the most notable example being betaine-30. These molecules usually emit from the FC state to reach the relaxed LE state. The system then goes to a dark state and recovers to the S0 state.31,36–40 In many of these systems, these transitions are accompanied by complete or partial CR, followed by a charge separation (CS). On the other hand, a geometry-dependent relaxation from the locally excited-state to an intramolecular charge transfer (ICT) state of a lower energy has been reported for 1,8-bis(dimethylamino)naphthalene, and various anthracyclines with a similar ring structure to Rif.41–43 Therefore, we expect the relaxation to the ground state of the relaxed S1 state to be related to the strength of the intra- and/or intermolecular H-bonds. The formation, or change in the strength, of intermolecular H-bonds with solvent molecules following electronic excitation may lead to new vibronic modes, which couple the excited and ground states.44 This coupling may be accompanied by intersystem crossing, charge transfer and/or PT reactions as observed in several molecular systems with comparable structures.45–48 In certain cases, an excited-state intramolecular proton transfer (ESIPT) may be coupled to ICT, which provides an important contribution to the π–π* transition of the anthraquinone skeleton.43
Femtosecond UV-visible-near infrared transient absorption
To elucidate further the excited-state dynamics, we studied the fs time-resolved UV-visible-near infrared transient absorption (TA) behaviour of Rif in both media upon excitation at 460 and 340 nm.Fig. 3a shows the visible/near-infrared (NIR) TA spectra of Rif in the phosphate buffer solution at selected delay times, upon excitation at 460 nm (S0–S1 transition). The TA spectra exhibit positive (absorption) and negative (bleaching and stimulated emission) signals. Initially, a positive broad band centred at 540 nm arises within the first hundred fs, which then decays at longer delay times and persists for up to 20 ps. In the NIR region of the spectrum, a negative band (maximum at 910 nm) is present that shows a comparable time evolution to the positive band observed in the visible domain (540 nm). This NIR band arises from the stimulated emission of Rif. The large red shift (9940 cm−1) in the maximum of intensity of this band, compared to the 6800 cm−1 shift of that in the reconstructed emission spectra (Fig. S3†), is likely caused by the strong overlap with the positive TA signals, which affects the overall aspect and the position of the spectra. We observed an additional weak negative band with a maximum intensity at ∼460 nm (visible upon excitation at 340 nm). The position of this band coincides with the absorption intensity maximum of the steady-state UV-visible absorption spectrum (475 nm). Hence, we assign it to the ground state recovery after completing the photodynamic cycle. Due to the spectral overlap between the ground state recovery and the excited state absorption (ESA) bands that have opposite amplitudes, no information about the time evolution in this spectral range can be extracted. The TA spectra of Rif in DCM solutions present similar features and comparable dynamics as those in the phosphate buffer (Fig. 3b). The positive band has its intensity maximum at 550 nm, while that of the negative (stimulated emission) band is at ∼940 nm. The time evolution of the characteristic bands in buffer and in DCM did not show any significant spectral shifts, which is in agreement with the lack of rising components in the fluorescence up-conversion experiments.
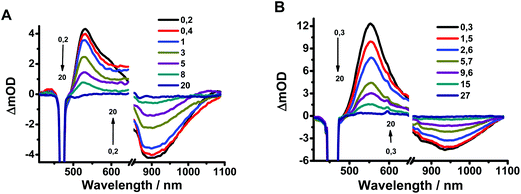 | ||
| Fig. 3 Transient absorption spectra of Rif in (A) pH 7.1 phosphate buffer and (B) DCM in a 20 ps time delay window. The pump wavelength was 460 nm. | ||
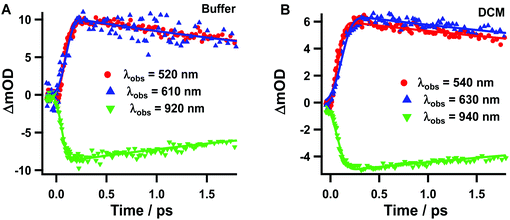
Next, we analysed the TA spectra of Rif in phosphate buffer and in DCM solution selecting transient signals that reflect their characteristic features (520, 610 and 920 nm for the pH 7.1 buffer, and 540, 630 and 940 nm for the DCM solution). Fig. 4 shows the decays at these probed regions, in a short time window, while Fig. S4† exhibits their behaviour at longer (up to 40 ps) and shorter delay times. Table 2 gives the parameters obtained from the exponential fits. The transients at 520 nm (540 nm) rise within the IRF and decay monoexponentially to zero with a time constant of ∼4.4–4.8 ps in pH 7.1 buffer solution, which increases to ∼6.6–7.7 in DCM. When we probed the dynamics at 610–630 nm, we observed a new rising component of 90–100 fs along with the decaying ps-one observed for the 520–540 nm region (Fig. S4B†). The transients in the NIR region show similar bi-exponential behaviour with time components of ∼100 fs and 4–7 ps.
| Transient absorption lifetimes of Rif | ||||
|---|---|---|---|---|
| Solvent | λ obs (nm) | λ exc (nm) | τ 1 (fs ± 60) | τ 2 (ps ± 0.3) |
| H2ONa2HPO4/NaH2PO4 buffer 0.1 M | 520 | 340 | (−) 110 | 5.2 |
| 460 | — | 4.8 | ||
| 610 | 340 | 110 | 5.2 | |
| 460 | (−) 90 | 4.6 | ||
| 920 | 340 | (−) 110 | 5.2 | |
| 460 | (−) 90 | 4.4 | ||
| DCM | 540 | 340 | (−) 100 | 5.9 |
| 460 | — | 6.9 | ||
| 630 | 340 | 100 | 5.4 | |
| 460 | (−) 100 | 7.7 | ||
| 940 | 340 | (−) 100 | 6.1 | |
| 460 | (−) 100 | 6.6 | ||
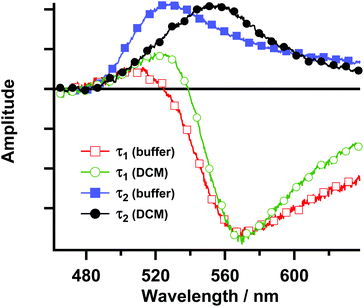
The spectra measured at various time delays have also been globally analysed using a sum of exponential functions (Fig. 5). A good fit was obtained with a two-exponential function. The decay-associated spectra resulting from the global analysis for both the buffer and DCM solutions reveal that the spectrum associated with the shortest time constant (τ1 ∼ 90 fs) is negative above 520 nm. In this region, the stimulated emission is present in the TA spectra at a very early time. Thus, this time constant can be ascribed to the decay of the FC excited state in agreement with the presence of an ultrafast decay component in the fluorescence up-conversion experiments. The positive feature in the spectrum of τ1 around 500 nm is most probably due to an artefact in the fit since representative decays in this region do not show the presence of an ultrafast decay component. It should be noted that below 500 nm, where the excited state absorption of this emitting species should produce a decay component with a similar time constant and a positive amplitude, there is a strong influence of the overlap between the ground state absorption and the ESA. This is evidenced by the very weak intensity of the characteristic negative band centred at 460 nm that corresponds to the ground state depletion. The spectrum associated with τ2 is characterized by a positive band at 520–530 nm for the buffer solution and at 550–560 nm for the DCM solution. This positive band suggests that the decay of the relaxed S1 excited state takes place with this time constant. Although strongly affected by the overlap with the stimulated emission and the ground state depletion bands, the change in the relative position (τ2) and the different broadness (τ1) of both decay-associated spectra for Rif in buffer and in DCM suggest at least a partial CT character of the LE and the relaxed S1 states.
The excitation of Rif in both pH 7.1 buffer and DCM solutions at 340 nm (Fig. S5 and S6†) allows the S0–S2 transition to take place, which results in an ultrafast internal conversion (IC) process from the S2 state to the S1 state (τ1 < 100 fs), as evidenced by the ultrafast decay component at 630 nm (Fig. S6A†). Following the IC, the S1 state relaxes to the S0 state with time constants that are consistent with the ones observed in the transient signals upon excitation at 460 nm.
In summary, the excitation of Rif at 460 nm places the system in its S1 state (in S2 upon excitation at 340 nm, followed by an ultrafast IC in <100 fs to S1) in both solutions. After FC relaxation with the partial CT character, S1 decays to the ground state (S0) in ∼4–6 ps (buffer) and ∼6–8 ps (DCM). These values are in agreement with those observed in the fluorescence up-conversion experiments. The difference in the values of the S1–S0 relaxation times for the two solutions suggests the involvement of intermolecular H-bonds between Rif and the surrounding water molecules that act synergistically with the intramolecular H-bond network of Rif to stabilize further the zwitterionic form. This is strongly supported by the large change in the excited state decay in deuterated buffer (vide infra).
Kinetic isotope effect (KIE)
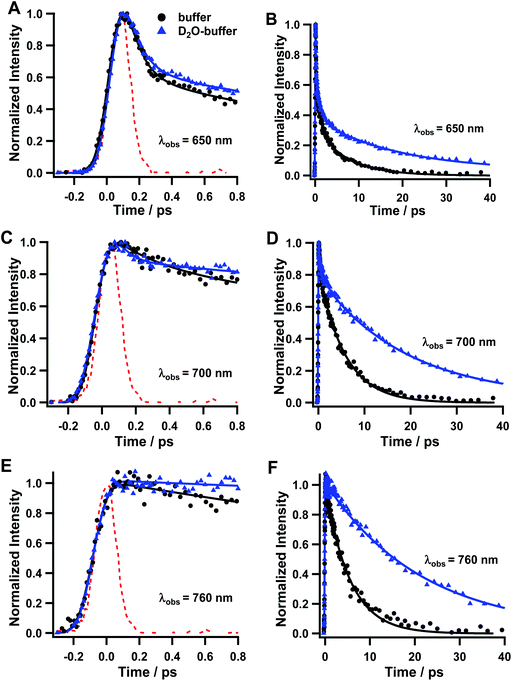
To obtain further details on the processes involved in the relaxation dynamics of Rif, we studied its photoinduced behaviour in deuterated potassium phosphate buffer (pD = 7.4). Fig. 6 shows representative emission decays upon excitation at 420 nm. The multiexponential fit gives three decay components: τ1 = 110 fs, τ2 = 1.5 ps and τ3 = 20.3 ps at 650 nm; and τ1 = 140 fs, τ2 = 1.4 ps, and τ3 = 19.2 ps for 700 nm (Table 3). For the emissions gated at 760 nm, only the longest component (τ3 = 22.4 ps) is observed. In similarity with the photobehaviour of Rif in the normal buffer, we assign τ1 to the emission from the FC state, which remains largely unaffected by the proton/deuterium exchange. We assign τ2 to the VC/solvation process and the longer component to the relaxation of the S1 state to the S0 one, which increases from ∼5–6 ps in the normal buffer to ∼20–24 ps in the deuterated buffer, giving rise to a kinetic isotope effect (KIE) of ∼4.| Solvent | λ obs (nm) | τ 1 (fs ± 40) | a 1 (%) | τ 2 (ps± 0.3) | a 2 (%) | τ 3 (ps ± 1) | a 3 (%) |
|---|---|---|---|---|---|---|---|
| Na2HPO4NaH2PO4/D2O buffer | 680 | <100 | 62 | 1.5 | 17 | 20.3 | 21 |
| 700 | 120 | 22 | 1.4 | 10 | 19.2 | 68 | |
| 760 | — | — | — | — | 22.4 | 100 |
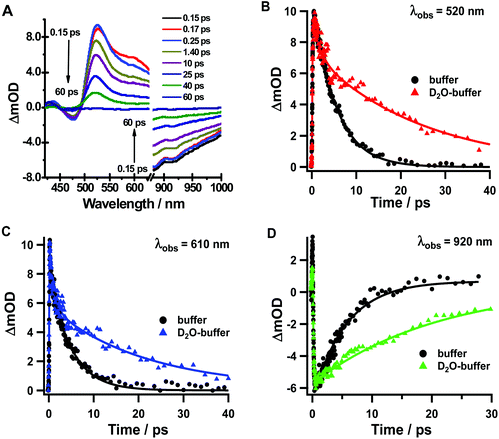
The transient absorption spectra of Rif in the deuterated buffer (Fig. 7a) closely resemble those observed for the pH 7.1 buffer (Fig. 3), although they present different dynamical behaviours in a longer time range (Fig. 7b, c and d, S7† and Table 4). Following excitation at 340 nm, both the positive signal at 520 nm and the stimulated emission signal at 920 nm exhibit an ultrafast rising component of τ1 ∼ 120 fs (decay component at 610 nm) and a slow monoexponential decay to zero with a time constant of τ2 = 20–25 ps assigned to the S1–S0 relaxation (Fig. S8†). The value of the ultrafast component slightly increases compared with that in the buffer solution (τ1 ∼ 100 fs), although this increase falls within the experimental error. On the other hand, the value of τ2 significantly changes from 5 ps in the normal phosphate buffer to 20–25 ps in the deuterated buffer, which gives a KIE of ∼4 for the relaxation from S1 to S0, as evidenced also by the fluorescence up-conversion experiments (Fig. 6). The 1.4–1.5 ps observed in the emission transients and when probing the TA signal at 520 nm is assigned to VC of Rif following the optical excitation. Further TA experiments in deuterated DCM did not show any KIE (ESI, Table S2†), indicating that DCM is not involved in the Rif excited state relaxation.
| Solvent | λ obs (nm) | λ exc (nm) | τ 1 (fs ± 60) | τ 2 (ps ± 0.3) | τ 3 (ps ± 1.6) |
|---|---|---|---|---|---|
| D2ONa2HPO4/NaH2PO4 buffer | 520 | 340 | (−) 120 | 1.4 | 24.7 |
| 460 | — | — | 20.1 | ||
| 610 | 340 | 120 | 1.4 | 24.8 | |
| 460 | — | — | 17.6 | ||
| 920 | 340 | (−) 120 | — | 24.3 | |
| 460 | — | — | 19.6 |
The large value of the KIE (∼4), which presents a significant deviation from the normal value (1.2–1.4), suggests that the H2O/D2O molecules participate actively in the relaxation of excited Rif through H-bonding interactions.49,50 One possible scenario is that the intermolecular H-bond interactions can promote solvent-assisted ESIPT, which could also give rise to the observed KIE.51 A deviation from the normal KIE has been reported in water solutions for other molecules, such as 6-amino-2-(20-hydroxyphenyl)benzoxazole (KIE = 13)52 and 7-azaindole (KIE = 4.7), which undergo solvent-assisted ESIPT. However, we did not find strong evidence to support the occurrence of ESIPT in excited Rif. If ESIPT was involved in the excited state relaxation dynamics of Rif, we would expect to observe a rising component with a value of ∼6 ps and ∼20 ps in the normal and deuterated buffers, respectively, corresponding to the formation of the photoproduced keto or enol Rif tautomers. The absence of this behaviour and the comparable dynamics in normal phosphate buffer and in DCM exclude the possibility for ESIPT or solvent-mediated ESIPT. Due to the presence of intermolecular H-bonds, one might also consider the possibility for excited state intermolecular proton transfer (ESPT) reaction to/from the solvent. However, such a reaction requires the molecule to become a strong photoacid or a photobase in the excited state in order to readily give or receive the proton. Additionally, these reactions usually take place on time scales that are relatively longer (the τPT for pyranine for example is ∼100 ps) and form photoproducts that are strongly emissive. Only super-photoacids, such as cyanine derivatives (phenol-carboxyether dipicolinium cyanine (QCy9)) are capable of transferring a proton to the solvent within the time scales of the components found in the present study.53,54 Finally, the zwitterion nature of Rif also raises the possibility of the presence of two prototropic forms in equilibrium in the ground state that upon excitation reach a new equilibrium in the excited state and consecutively relax back to the ground state independently with time constants of ∼100 fs and 4–6 ps. First, this scenario is unlikely since several spectroscopic and NMR studies have identified that Rif exists only in a zwitterionic form in the ground state. Additionally, the TA experiments identified a rising component (∼100 fs) in the decays of Rif excited at 460 nm (Fig. S4B†), associated with the FC relaxation with a weak CT character. This rising component, along with the presence of a decaying one with the same value of the emission decays and the relatively simple shape of the TA spectra in both solvents, indicate the presence of a single excited zwitterion species that undergoes initial weak CR and relaxes to the ground state through the back CS process. These processes are strongly influenced by the presence of inter- and intramolecular hydrogen bonds.
The ultrafast formation of the S1 state with the partial CT character, along with the presence of both intra- and intermolecular H-bonds, may lead to new vibronic, dissipative modes, which couple the S1 state with the ground state. The CT (partial) character is indicated by the solvent dependence of the shape and the position of the decay associated TA spectra and the mild dependence of the value of the component associated with the relaxation to the ground state. The intermolecular H-bonding interactions thus speed up the non-radiative IC from S1 to S0 in Rif. The efficiency of this process decreases in the deuterated buffer, giving rise to the observed KIE of ∼4. Non-radiative relaxation in competition with the emissive relaxation has been reported for zwitterion molecular systems, and for amino and hydroxyquinone derivatives, with structures similar to the naphthoquinone core of Rif.28,46,55–57 For the latter molecules, the vibrational modes of the H-bonds (involving OH and NH groups), the intramolecular H-bonds with a CT character and the solvent-mediated H-bonds are behind the non-radiative relaxation of the excited state.
Large KIE values were reported for several molecules that undergo fast non-radiative S1–S0 IC associated with the presence of intermolecular H-bonding interactions. A KIE of ∼4 was reported for 4-aminophthalimide (4-AP). This KIE was related to the reduction of the stretching frequency of the N–H vibrational mode of the 4-AP imide group.58–63 A KIE of 9 was reported for the non-radiative rate constants for the CT state IC to S0 in several 1- and 2-substituted aminoanthraquinones in EtOH/EtOD.46 For nitrobenzoxadiazole, a significant KIE on the S1–S0 IC was observed both in H2O and in MeOH/MeOD but no such effects were detected in DMSO/d-DMSO.47 The lack of KIE in deuterated DCM for Rif and the similarity of the excited state dynamics in buffer and DCM suggest that the intramolecular H-bonding network of Rif plays a dominant role in the stabilization of the zwitterionic form in the ground state. However, in aqueous solvents, additional intermolecular H-bonds with the surrounding water molecules are formed affecting the time constants of the relaxation of the S1 state.
Rif excited-state dynamics interpretation
Finally, Scheme 2 summarizes the proposed mechanism for the Rif excited-state dynamics and relaxation processes. In the phosphate buffer at pH 7.1, Rif is present predominantly in the zwitterionic (phenolate) form in the ground state, with the negative charge localized on the oxygen C8 and stabilized in the naphthoquinone ring, while the positive charge is localized at the N3′ nitrogen atom, in the piperazine moiety.4 Following excitation at 340 nm to the S2 state, Rif undergoes an ultrafast (∼100 fs) IC to S1 followed by an ultrafast FC relaxation (within the IRF) to the S1 state with the CT character. This process involves an ultrafast structural relaxation upon geometry changes, as evidenced by the large Stokes shift, which can be induced by the rearrangement of the intramolecular H-bonds.4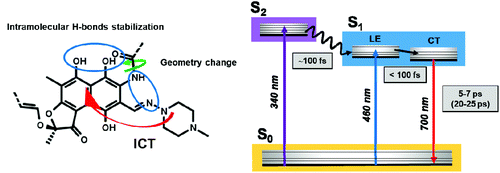 | ||
| Scheme 2 Representation of the proposed excited-state processes and the related mechanisms for the relaxation of excited Rif. Values in parentheses are from deuterated phosphate buffer experiments. | ||
The reduced energy of the relaxed S1 state (CT), after the geometry relaxation, is related to the reported conjugated system involving the naphthoquinone core and the formation of a quasi-aromatic ring. H-bonds can be formed between the amino groups at C2 and the piperazine N3′ nitrogen atom while the carbonyl groups at C11 can interact strongly with the OH group at C1.4 These interactions may enhance the stabilization of the Rif intramolecular H-bonds in the CT state by electronic delocalization along a proton-bridged quasi-six-membered ring. Additionally, they can cause the delocalization of the electronic excitation over the naphthoquinone rings, as typically observed for resonance-assisted H-bonding rings.28,64–66 With the delocalization of the electronic excitation, this relaxation process stabilizes the π–π* transition of the naphthoquinone skeleton. The observed similarities between the dynamics of Rif in normal buffer and in DCM, such as the large Stokes shift and the short NIR emission lifetime, suggest that Rif undergoes similar geometry relaxation in the S1 state, with a weak solvent effect on this process.
Finally, from the S1 state, Rif relaxes to the ground state S0via a NIR emission (5–7 ps) coupled to a non-radiative deactivation pathway of the excited-state. The non-radiative relaxation of Rif takes place through vibrational modes, which are enhanced by the formation of intermolecular H-bonds with the solvent. In aqueous solutions, the interactions with the H2O molecules speed up the stretching frequency, reducing the radiative relaxation, showing a shorter emission lifetime than that in DCM.
Conclusions
In this work, we presented the results from ultrafast time-resolved fluorescence up-conversion and transient absorption studies of Rif in pH 7.1 sodium phosphate buffer and DCM. The time-resolved studies show an ultrafast IC (∼100 fs) from S2 to S1 upon excitation at 340 nm, followed by an ultrafast FC relaxation to the S1 state associated with a weak charge transfer and geometry change, leading to the relaxed S1-CT state. This state decays to S0 in ∼4–8 ps, depending on the solvent, showing a weak solvent effect in water where Rif has a shorter lifetime compared to that in the DCM solution. A large KIE (∼4) was found in aqueous solutions associated with the modification of the Rif H-bond stretching frequencies. The change in the solute–solvent interactions affects the non-radiative relaxation pathway resulting in an increase in the Rif emission lifetime. In deuterated DCM solution we did not observe the KIE, suggesting that the Rif intramolecular H-bond network plays a dominant role in the Rif relaxation dynamics. The present study provides insights into the physicochemical properties of Rif in aqueous solution and demonstrates how water molecules affect the Rif structural dynamics and photobehaviour. The obtained results show the importance of the intramolecular H-bond network that stabilizes the zwitterionic form of the molecule and dictates its relaxation dynamics in both H2O and DCM. On the other hand, the stabilization effect of the intramolecular H-bonds is potentiated further by the formation of intermolecular H-bonds with the surrounding water molecules. Thus, we suggest that the synergetic action of the intra- and intermolecular H-bond interactions helps Rif retain its high antimicrobial activity in its zwitterionic form.Conflicts of interest
There are no conflicts to declare.Acknowledgements
We thank the Marie Curie Program (FP7-PEOPLE-ITN-2013 and CYCLON-HIT 608407) and MINECO (MAT2014-57646-P) for financial support.References
- F. Parenti and G. Lancini, in Antibiotic and Chemotherapy, ed. D. Greenwood, S. R. Norrby and R. J. Whitley, Content Repository Only!, London, 9th edn, 2010, pp. 326–333, DOI:10.1016/B978-0-7020-4064-1.00027-0.
- H. G. Floss and T. W. Yu, Chem. Rev., 2005, 105, 621–632 CrossRef CAS PubMed.
- E. A. Campbell, N. Korzheva, A. Mustaev, K. Murakami, S. Nair, A. Goldfarb and S. A. Darst, Cell, 2001, 104, 901–912 CrossRef CAS PubMed.
- K. Pyta, P. Przybylski, K. Klich and J. Stefanska, Org. Biomol. Chem., 2012, 10, 8283–8297 RSC.
- K. Pyta, P. Przybylski, B. Wicher, M. Gdaniec and J. Stefanska, Org. Biomol. Chem., 2012, 10, 2385–2388 RSC.
- K. Das, A. V. Smirnov, J. Wen, P. Miskovsky and J. W. Petrich, Photochem. Photobiol., 1999, 69, 633–645 CrossRef CAS PubMed.
- A. H. Zewail, J. Phys. Chem. A, 2000, 104, 5660–5694 CrossRef CAS.
- S. Schneider, M. O. Schmitt, G. Brehm, M. Reiher, P. Matousek and M. Towrie, Photochem. Photobiol. Sci., 2003, 2, 1107–1117 RSC.
- S. Monti, I. Manet, F. Manoli and S. Sortino, Photochem. Photobiol. Sci., 2007, 6, 462–470 RSC.
- B. Cohen, J. A. Organero, L. Santos, L. R. Padial and A. Douhal, J. Phys. Chem. B, 2010, 114, 14787–14795 CrossRef CAS PubMed.
- M. El-Kemary, J. A. Organero and A. Douhal, J. Med. Chem., 2006, 49, 3086–3091 CrossRef CAS PubMed.
- M. Gil and A. Douhal, J. Phys. Chem. A, 2008, 112, 8231–8237 CrossRef CAS PubMed.
- N. Sitaram and D. Chatterji, FEBS Lett., 1985, 182, 77–80 CrossRef CAS PubMed.
- L. Angiolini, M. Agnes, B. Cohen, K. Yannakopoulou and A. Douhal, Int. J. Pharm., 2017, 531, 668–675 CrossRef CAS PubMed.
- M. Gutierrez, F. Sanchez and A. Douhal, Phys. Chem. Chem. Phys., 2016, 18, 5112–5120 RSC.
- M. Ziolek, I. Tacchini, M. T. Martinez, X. Yang, L. Sun and A. Douhal, Phys. Chem. Chem. Phys., 2011, 13, 4032–4044 RSC.
- J. A. Arnaud, W. M. Hubbard, G. D. Mandeville, B. de la Clavière, E. A. Franke and J. M. Franke, Appl. Opt., 1971, 10, 2775–2776 CrossRef CAS PubMed.
- M. A. C. de Araujo, R. Silva, E. de Lima, D. P. Pereira and P. C. de Oliveira, Appl. Opt., 2009, 48, 393–396 CrossRef PubMed.
- J. Casado, J. Peleteiro and M. A. Rios, Chem. Phys. Lett., 1979, 62, 349–355 CrossRef CAS.
- B. D. Howes, L. Guerrini, S. Sanchez-Cortes, M. P. Marzocchi, J. V. Garcia-Ramos and G. Smulevich, J. Raman Spectrosc., 2007, 38, 859–864 CrossRef CAS.
- C. Nadejde, L. Ursu, D. Creanga and D. Dorohoi, Rev. Chim., 2015, 66, 360–363 CAS.
- G. G. Gallo and P. Radaelli, in Analytical Profiles of Drug Substances, ed. K. Florey, Academic Press, 1976, vol. 5, pp. 467–513 Search PubMed.
- K. Bujnowski, L. Synoradzki, R. C. Darlak, T. A. Zevaco and E. Dinjus, RSC Adv., 2016, 6, 114758–114772 RSC.
- B. Wicher, K. Pyta, P. Przybylski and M. Gdaniec, Cryst. Growth Des., 2018, 18, 742–754 CrossRef CAS.
- B. Wicher, K. Pyta, P. Przybylski, E. Tykarska and M. Gdaniec, Acta Crystallogr., Sect. C: Cryst. Struct. Commun., 2012, 68, o209–o212 CrossRef CAS PubMed.
- M. Umadevi and V. Ramakrishnan, Spectrochim. Acta, Part A, 2003, 59, 393–403 CrossRef CAS.
- Z. Yoshida and F. Takabayashi, Tetrahedron, 1968, 24, 933–943 CrossRef.
- D. K. Palit, H. Pal, T. Mukherjee and J. P. Mittal, J. Chem. Soc., Faraday Trans., 1990, 86, 3861–3869 RSC.
- M. Umadevi, P. Vanelle, T. Terme, B. J. M. Rajkumar and V. Ramakrishnan, J. Fluoresc., 2008, 18, 1139–1149 CrossRef CAS PubMed.
- E. A. Pritchina, N. P. Gritsan, G. T. Burdzinski and M. S. Platz, J. Phys. Chem. A, 2007, 111, 10483–10489 CrossRef CAS PubMed.
- T. Kumpulainen, B. Lang, A. Rosspeintner and E. Vauthey, Chem. Rev., 2017, 117, 10826–10939 CrossRef CAS PubMed.
- Y. Georgievskii, C.-P. Hsu and R. A. Marcus, J. Chem. Phys., 1998, 108, 7356–7366 CrossRef CAS.
- R. Jimenez, G. R. Fleming, P. V. Kumar and M. Maroncelli, Nature, 1994, 369, 471 CrossRef CAS.
- M. L. Horng, J. A. Gardecki, A. Papazyan and M. Maroncelli, J. Phys. Chem., 1995, 99, 17311–17337 CrossRef CAS.
- S. J. Schmidtke, D. F. Underwood and D. A. Blank, J. Phys. Chem. A, 2005, 109, 7033–7045 CrossRef CAS PubMed.
- G. Duvanel, J. Grilj, H. Chaumeil, P. Jacques and E. Vauthey, Photochem. Photobiol. Sci., 2010, 9, 908–915 RSC.
- R. G. Fedunov, A. V. Plotnikova, A. I. Ivanov and E. Vauthey, J. Phys. Chem. A, 2017, 121, 471–481 CrossRef CAS PubMed.
- S. A. Kovalenko, N. Eilers-König, T. A. Senyushkina and N. P. Ernsting, J. Phys. Chem. A, 2001, 105, 4834–4843 CrossRef CAS.
- P. J. Reid and P. F. Barbara, J. Phys. Chem., 1995, 99, 3554–3565 CrossRef CAS.
- A. E. Johnson, N. E. Levinger, W. JarzÈ©ba, R. E. Schlief, D. A. V. Kliner and P. F. Barbara, Chem. Phys., 1993, 176, 555–574 CrossRef CAS.
- A. Szemik-Hojniak, G. Balkowski, G. W. H. Wurpel, J. Herbich, J. H. van der Waals and W. J. Buma, J. Phys. Chem. A, 2004, 108, 10623–10631 CrossRef CAS.
- G. Balkowski, A. Szemik-Hojniak, I. H. M. van Stokkum, H. Zhang and W. J. Buma, J. Phys. Chem. A, 2005, 109, 3535–3541 CrossRef CAS PubMed.
- G. Smulevich, A. R. Mantini, A. Feis and M. P. Marzocchi, J. Raman Spectrosc., 2001, 32, 565–578 CrossRef CAS.
- L. Biczók, T. Bérces and H. Linschitz, J. Am. Chem. Soc., 1997, 119, 11071–11077 CrossRef.
- G. Schulman Stehpen and P. Liedke, Journal, 1973, 84, 317 Search PubMed.
- H. Inoue, M. Hida, N. Nakashima and K. Yoshihara, J. Phys. Chem., 1982, 86, 3184–3188 CrossRef CAS.
- S. Lin and W. S. Struve, Photochem. Photobiol., 1991, 54, 361–365 CrossRef CAS PubMed.
- C. Ma, Y.-Q. Ou, C. T.-L. Chan, A. K.-W. Wong, R. C.-T. Chan, B. P.-Y. Chung, C. Jiang, M.-L. Wang and W.-M. Kwok, Phys. Chem. Chem. Phys., 2018, 20, 1240–1251 RSC.
- P. M. Kiefer and J. T. Hynes, J. Phys. Chem. A, 2004, 108, 11793–11808 CrossRef CAS.
- P. M. Kiefer and J. T. Hynes, J. Phys. Chem. A, 2004, 108, 11809–11818 CrossRef CAS.
- Y. Peng, Y. Ye, X. Xiu and S. Sun, J. Phys. Chem. A, 2017, 121, 5625–5634 CrossRef CAS PubMed.
- N. Alarcos, M. Gutierrez, M. Liras, F. Sanchez and A. Douhal, Phys. Chem. Chem. Phys., 2015, 17, 16257–16269 RSC.
- R. Simkovitch, S. Shomer, R. Gepshtein and D. Huppert, J. Phys. Chem. B, 2015, 119, 2253–2262 CrossRef CAS PubMed.
- P. Cimino, U. Raucci, G. Donati, M. G. Chiariello, M. Schiazza, F. Coppola and N. Rega, Theor. Chem. Acc., 2016, 135, 117 Search PubMed.
- A. Navas Diaz, J. Photochem. Photobiol., A, 1990, 53, 141–167 CrossRef CAS.
- V. J. P. Srivatsavoy, B. Venkataraman and N. Periasamy, J. Photochem. Photobiol., A, 1992, 68, 169–184 CrossRef CAS.
- O. F. Mohammed, D. Q. Xiao, V. S. Batista and E. T. J. Nibbering, J. Phys. Chem. A, 2014, 118, 3090–3099 CrossRef CAS PubMed.
- P. Avouris, W. M. Gelbart and M. A. Elsayed, Chem. Rev., 1977, 77, 793–833 CrossRef CAS.
- S. Das, A. Datta and K. Bhattacharyya, J. Phys. Chem. A, 1997, 101, 3299–3304 CrossRef CAS.
- E. Krystkowiak, K. Dobek and A. Maciejewski, J. Photochem. Photobiol., A, 2006, 184, 250–264 CrossRef CAS.
- A. M. Durantini, R. D. Falcone, J. D. Anunziata, J. J. Silber, E. B. Abuin, E. A. Lissi and N. M. Correa, J. Phys. Chem. B, 2013, 117, 2160–2168 CrossRef CAS PubMed.
- D. C. Khara and A. Samanta, J. Phys. Chem. B, 2013, 117, 5387–5388 CrossRef CAS PubMed.
- D. C. Khara, S. Banerjee and A. Samanta, ChemPhysChem, 2014, 15, 1793–1798 CrossRef CAS PubMed.
- G. Gilli, F. Bellucci, V. Ferretti and V. Bertolasi, J. Am. Chem. Soc., 1989, 111, 1023–1028 CrossRef CAS.
- P. Gilli, V. Bertolasi, L. Pretto, A. Lyčka and G. Gilli, J. Am. Chem. Soc., 2002, 124, 13554–13567 CrossRef CAS PubMed.
- H. Houjou, T. Motoyama, S. Banno, I. Yoshikawa and K. Araki, J. Org. Chem., 2009, 74, 520–529 CrossRef CAS PubMed.
Footnote |
| † Electronic supplementary information (ESI) available. See DOI: 10.1039/c8pp00192h |
| This journal is © The Royal Society of Chemistry and Owner Societies 2019 |

