 Open Access Article
Creative Commons Attribution 3.0 Unported Licence
Altering CO binding on gold cluster cations by Pd-doping†
Heider A.
Abdulhussein
 ab,
Piero
Ferrari
 c,
Jan
Vanbuel
 c,
Christopher
Heard
 d,
André
Fielicke
 e,
Peter
Lievens
 c,
Ewald
Janssens
 c and
Roy L.
Johnston
 *a
*a
aSchool of Chemistry, University of Birmingham, Edgbaston, Birmingham B15 2TT, UK. E-mail: r.l.johnston@bham.ac.uk
bDepartment of Chemistry, College of Science, University of Kufa, Najaf, Iraq
cQuantum Solid State Physics, KU Leuven, 3001 Leuven, Belgium. E-mail: ewald.janssens@kuleuven.be
dDepartment of Physical and Macromolecular Chemistry, Charles University, 12843 Praha 2, Czech Republic
eFritz-Haber-Institut der Max-Planck-Gesellschaft, Faradayweg 4-6, 14195 Berlin, Germany
First published on 14th August 2019
Abstract
The introduction of dopant atoms into metal nanoparticles is an effective way to control the interaction with adsorbate molecules and is important in many catalytic processes. In this work, experimental and theoretical evidence of the influence of Pd doping on the bonding between small cationic AuN+ clusters and CO is presented. The CO adsorption is studied by combining low-pressure collision cell reactivity and infrared multiple photon dissociation spectroscopy experiments with density functional theory calculations. Measured dissociation rates of cluster–CO complexes (N ≤ 21) allow the estimation of cluster–CO binding energies, showing that Pd doping increases the CO adsorption energy to an extent that is size-dependent. These trends are reproduced by theoretical calculations up to N = 13. In agreement with theory, measurements of the C–O vibrational frequency suggest that for the doped PdAuN−1+ (N = 3–5, 11) clusters, CO adsorbs on an Au atom, while for N = 6–10 and N = 12–14, CO interacts directly with the Pd dopant. A pronounced red-shifting of the C–O vibrational frequency is observed when CO interacts directly with the Pd dopant, indicating a significant back-donation of electron charge from Pd to CO. In contrast, the blue-shifted frequencies, observed when CO interacts with an Au atom, indicate that σ-donation dominates the Au–CO interaction. Studying such systems at the sub-nanometre scale enables a fundamental comprehension of the interactions between adsorbates, dopants and the host (Au) species at the atomic level.
1 Introduction
The surface of a catalyst is crucial for its catalytic activity and can be affected by many factors. The surface and core of nanoalloy systems usually differ in their chemical composition,1 given that surface segregation is controlled by the surface free energy. However, the active surface state of a nanoalloy catalyst cannot be predicted only on the basis of surface energy. Other parameters, such as particle size and support effects, as well as the influence of adsorbates,2,3 are important in determining the composition of the particle's surface. Under catalytic reaction conditions, these factors determine the surface segregation, thereby altering the structures and the local atomic compositions, and consequently the activities and selectivities of nanoalloy catalysts. This has been observed in a number of gold alloy systems.4,5 For example, thermodynamically, Au tends to occupy surface sites on AuPd nanoalloys under vacuum conditions.6–8 However, upon exposure to reactive gases, such as CO,9,10 O2,11 NO,6 and CO + O2,12 facile surface segregation of Pd occurs. The preference for Pd atom migration to the nanoalloy-substrate interface has also been investigated for AuPd nanoalloys on an oxide-support.13,14 Such observations emphasize that the segregation mechanism is subtle, and hence it is necessary to combine a variety of different techniques to characterize the structures and reactivities of nanoalloys under industrial catalysis conditions.Fundamental aspects of molecular adsorption and catalytic activity of nanoalloys can be investigated by studying small gas-phase clusters.15–17,19 The ability to tune the size, composition and charge state of clusters in the gas phase enables elucidating the specific role each of these parameters play in different reactions. From a theoretical point of view, small clusters at the sub-nanometre scale can be studied at a high level of theory.15 The possibility of combining state-of-the-art experiments with high-level calculations allows the direct comparison of findings, by which one can gain an important understanding of interactions and processes at the atomic scale.18,19 Moreover, sub-nanometre clusters themselves often exhibit higher catalytic performance (activity and/or selectivity)20 compared to their bulk and even nanoscale counterparts.21,22 For example, AuN clusters (N = 8, 13 and 20) supported on MgO and Mg(OH)2 surfaces have shown high catalytic activity for CO oxidation.23–25
The nature of CO adsorption on metallic clusters is strongly dependent on the type(s) of metal. Dissociative adsorption of CO is favoured on relatively electron deficient metals on the left-hand side of the periodic table26,27 (e.g. V,28 Nb,29–32 Mo and Tc30). The more loosely bound electrons, coupled with the only partially filled d-bands of these early transition metals, make them more reactive. Also, for these more electropositive metals there is an increased possibility of coordination of CO via both the C and O atoms. These factors combine to favour CO dissociation, resulting in adsorbed C and O atoms rather than an adsorbed molecule.27,31,33,34 The gradual activation of the C–O bond when moving towards the early transition metals has been detected by IR spectroscopy of the cluster–CO complexes.26,27,35 The bonding between CO and the metals on the right-hand side of the d-block, including Au36,37 and Pd,38 is treated by the Blyholder model,39 where σ-donation of electron density from CO to the metal and π-back-donation from the metal to CO take place. Thus, they form weaker metal–CO bonds, leading to non-dissociative CO adsorption (the adsorbed CO molecules in such systems are easily desorbed, without dissociation, by raising the temperature33,40). The transition from dissociative to non-dissociative CO adsorption on transition metals has been previously identified at room temperature by Brodén et al.,26 suggesting that the transition shifts from iron in the 3d-block across technetium in the 4d-block towards tungsten in the heavier 5d elements.
Previous studies on Au clusters have shown that many of their physical and chemical properties can be tuned by the presence of a dopant atom.41–44 The geometries,45 optical properties,46–48 and reactivities,42,43,49–51 of doped Au clusters are, therefore, expected to be different from those of their pure Au counterparts. A significant amount of research has been performed on investigating doping and mixing effects on the reactivity of binary metallic nanoparticles with CO molecules. For AuPt clusters, the composition Au0.75Pt0.25 is found to show the highest adsorption strength of CO.52 Adding a Pd dopant atom into cationic AuN+ clusters (N = 2–20) is found to induce electronic and structural modifications, and results in very different stability patterns.19 It has previously been shown that the interaction with CO is improved significantly by doping Pd atoms into smaller free AuN (N = 2–3) clusters.53 The interaction is also enhanced for N = 4 and 6, but reduced for N = 5 after doping a single Pd atom in the AuN+ clusters.54 While doping a single atom of Au does not change the catalytic properties of the Pd5 cluster for CO oxidation,55 enhanced CO oxidation activity has been observed for Au1Pd4 deposited on a TiO2(110) surface.56 Stronger CO adsorption has also been predicted for doping vanadium into AuN (N = 2–14) clusters.43 In contrast, doping copper, silver or yttrium atoms into Au clusters was found to reduce the cluster–CO interaction, which was attributed to a decrease in electron transfer between the metal cluster and the CO molecule.53,57,58
Formation of contiguous Pd sites, in particular forming dimers at the surface of AuPd(100) systems under high CO pressures, was investigated by Goodman and co-workers.59,60 They demonstrated that Pd starts to segregate to the surface at a CO pressure of 10−3 Torr at 260 K. Zhu et al.61 found evidence for CO-induced Pd surface enrichment, and in addition that, at low Pd concentrations, only Pd dimers and isolated Pd atoms are present on the surface of AuPd nanoparticles. These findings emphasize the importance of determining the surface structure and chemical ordering of nanoalloys under vacuum conditions and controlling these features under realistic operating conditions, in order to optimize catalyst performance. Although the segregation of Pd to an alloy surface in the presence of CO can be suggested by experimental10,62 and theoretical6,9,60,63 studies, knowledge of the effect of doping by single Pd atom on the coordination and surface reactivity of gold clusters towards CO gas, as well as the preferred location of the Pd atom, remains limited.
In this work, we combine low-pressure collision cell reactivity and infrared multiphoton dissociation spectroscopy experiments with density functional theory calculations to study in detail the influence of Pd-doping on the interaction of one and two CO molecules on a series of small cationic gold clusters, AuN+ with N ≤ 21.
2 Methods
2.1 Theoretical calculation methods
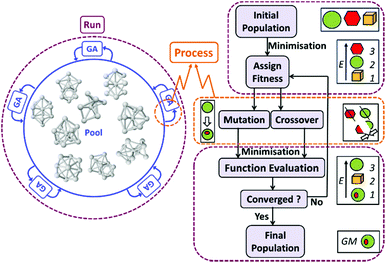
The initial step in the theoretical calculations is searching for low-energy isomers of AuN+ and PdAuN−1+ clusters and their CO complexes, in the size range N = 1–13. This is performed by using the Birmingham Parallel Genetic Algorithm (BPGA)64 combined with Density Functional Theory (DFT). This methodology was previously applied for global optimization of bare cationic AuN+ and PdAuN−1+ (N = 1–20) clusters.19 In this initial step of isomer searching, DFT calculations (Γ-point) are performed using the Vienna Ab initio Simulation Package (VASP),65 employing projected-augmented wave (PAW) pseudopotentials and the PBE exchange–correlation functional.66,67 This method is selected because of its speed and reliability in calculating gold clusters, as shown in previous work.68–70 A plane-wave basis set is utilized, including spin polarization. The plane wave cut-off energy is truncated at 400 eV. To improve convergence, Methfessel–Paxton smearing, with a Sigma value of 0.01 eV is used.71 The thresholds for the electronic energy and forces are set to 10−6 eV and 10−5 eV Å−1, respectively.As shown in Fig. 1, in BPGA a parallel evaluation of cluster structures is performed, using the so-called pool methodology.71 Each BPGA run implements multiple GA instances which, in turn, run a set of parallel processes independently.71,72 The initial population (a specified number of random structures) is generated from scratch and then subjected to geometrical relaxation (DFT local energy minimization). Crossover and mutation operations are then performed. Selection of individuals for crossover is achieved by tournament selection. The cut-and-splice method of Deaven and Ho105 is used to perform the crossover. A homotop-swap option is adopted as a mutation operation for nanoalloys, while for the pure clusters a random-atom displacement mutation is employed. Fitness evaluation is then used to replace the highest energy isomers by the newly created lowest energy isomers among the set of offspring and mutants. The structure with the lowest energy in the final population is chosen as the global minimum (GM) geometry. Considering all symmetry-inequivalent atomic sites in a particular cluster, all possible complexes with one and two atop adsorbed CO molecules are generated.
Subsequently, all the low energy cluster–CO isomers are subjected to a reoptimization procedure using spin-unrestricted DFT, employing the orbital-based NWChem package.72 Def2-TZVPP basis sets are used for all atoms: Au, Pd, C, and O, and the corresponding effective core potentials (def2-ECP) of Weigend and Ahlrichs are employed for Au and Pd.73 The range-separated hybrid exchange–correlation functional LC-ωPBEh is utilised.74,75 Long-range corrected (LC) functionals are typically used for systems that exhibit long range charge transfer, due to the improved asymptotic behaviour of the exchange energy at long range and correction for the self-interaction energy. Binary metallic clusters, where the electronegativities of the two metals are different,75,76 and organic photovoltaic materials with spatial charge separation77,78 are prime examples of such systems. The LC-ωPBEh functional previously has been used with great success for investigating the lowest-energy structures and optical absorption of cationic Au and Ag doped Au clusters,47,79,80 as well as the relative stability and optical absorption of cationic Au and Pd doped Au clusters.19,46 The harmonic vibrational frequencies were calculated using the NWChem package, employing the same exchange correlation functional and basis set as in the geometry optimization step.73 This allows us to confirm that the calculated structures are true local minima (i.e. having no imaginary frequencies). Spin states are optimized for each cluster and cluster–CO complex. All the optimal electronic configurations are found to exhibit the lowest possible spin multiplicity, which corresponds to either 2S + 1 = 1 (singlet) for even-electron counts or 2 (doublet) for odd-electron counts. Fig. S1 in the ESI† shows the optimal spin state for the mono-carbonyl species as a function of their relative energies.
Binding energies of CO on the clusters are calculated as:
| Eb = ECO + Ecluster − Ecluster–CO | (1) |
2.2 Reactivity measurements
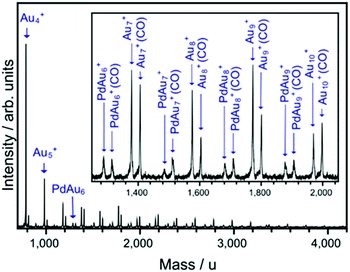
Reactivity measurements are performed in a cluster beam setup equipped with a dual-target dual-laser ablation cluster source described in detail elsewhere.84 Two independent Au and Pd targets are ablated by two Nd:YAG lasers (532 nm, 10 Hz). Before ablation, He gas is introduced in the source by a pulsed valve (backing pressure of 7 bar). By collisions with He, the ablation plasma is cooled down, triggering cluster formation. This process is enhanced by a supersonic expansion into vacuum of the ablated plume, taking place through a conical nozzle that is kept at a temperature of 200 K by a flow of liquid N2 and resistive heating. The cluster beam, composed of a mixture of pure AuN+ and single doped PdAuN−1+ clusters, is then interacting with CO gas in a low-pressure collision reaction cell (controlled pressures of CO, PCO, in the 0–0.2 Pa range).85 This leads to the formation of cluster–CO complexes, with each cluster adsorbing maximally one CO molecule. Finally, the distribution of pure clusters and their CO complexes is analyzed by reflectron time-of-flight (TOF) mass spectrometry. A typical example of a mass spectrum recorded under these conditions is presented in Fig. 2, where peaks corresponding to bare AuN+ and PdAuN−1+ clusters are visible, together with the corresponding CO complexes. Only clusters with one attached CO are present in the spectra, as highlighted in the inset of the figure.Quantitative information on cluster reactivity is extracted based on a proposed model for adsorption. Since in the studied PCO range at most one CO molecule is attached per cluster, no sequential adsorption of CO is considered. A detailed description of this model can be found in ref. 86 and 87. As a function of PCO, the relative abundance of the MAuN−1+(CO) [M = Au, Pd] complex with respect to the bare MAuN−1+ cluster is given by:
 | (2) |
Here kB is the Boltzmann constant, TCO the temperature of the CO gas (e.g. room temperature), and t1 and t2 the times clusters spend inside the reaction cell and between the cell and the entrance to the time-of-flight mass spectrometer, respectively. kf and kd are the rates of formation and dissociation of a cluster–CO complex, respectively. Although the effect of both parameters are convoluted in eqn (2), kf mainly determines the slope of the initial increase with PCO, whereas the saturation reached at higher pressure is given by kd (see section 3.1). In the procedure, eqn (2) is fitted to the experimentally determined normalized abundances of cluster–CO complexes as a function of PCO at the reaction cell, with kd as fitting parameter. The rate of forward reaction, kf, is approximated initially by hard-sphere collision theory.42 Only for N = 4 this procedure did not give a satisfactory fit of the experimental data (the initial increase with pressure was not well reproduced), and both kf and kd had to be used as fitting parameters. For this cluster size, a kf coefficient slightly larger than the value corresponding to the hard sphere approximation is found, suggesting a role of electrostatic interactions in the CO adsorption process for this cluster size. For all other sizes, the hard-sphere model is a good approximation.
2.3 Infrared multiphoton dissociation measurements
The frequencies of the internal C–O stretching mode (νCO) of cluster–CO complexes are measured by infrared multiple photon dissociation (IRMPD) spectroscopy, performed in a dual-target dual-laser ablation cluster source setup coupled to the beamline of the Infrared Free Electron Laser at the Fritz Haber Institute of the Max Planck Society (FHI FEL).88,89 A detailed description of the cluster source is given in ref. 90, and its operational principles are similar to those of the cluster source used for the reactivity measurements. The main difference is that the CO gas is introduced via a reaction channel directly connected to the cluster source, using a pulsed valve at a backing pressure of 1 bar (operated at 10 Hz). In this way, clusters interact with CO in a high-collision regime and the complexes formed are thermalized by the pressure of He. The source is operated at room temperature. In the studied size range of N = 5–14, each cluster attaches up to two or three CO molecules.After production, the cluster beam is collimated by a 2 mm diameter skimmer, followed by a 1 mm diameter aperture. In between the clusters interact with a focused, counter-propagating, IR laser beam delivered by the FHI FEL (operated at 5 Hz). Finally, clusters are analysed by reflectron TOF mass spectrometry and mass spectra are recorded with and without (reference spectra) exposure to the IR light. The FHI FEL is scanned in the 2050–2250 cm−1 frequency range with a step size of 5 cm−1 and an average energy of 25 mJ per pulse. When laser excitation takes place in resonance with the C–O stretching mode, multiple photon absorption heats up the cluster via intra-molecular vibrational redistribution. Once the internal energy of the cluster is high enough, fragmentation occurs through the lowest-energy fragmentation channel, in this case the desorption of the CO molecule. In this way depletion spectra are recorded, by comparing cluster–CO complex intensities in mass spectra with and without laser interaction.
3 Results and discussion
3.1 Binding energies CO
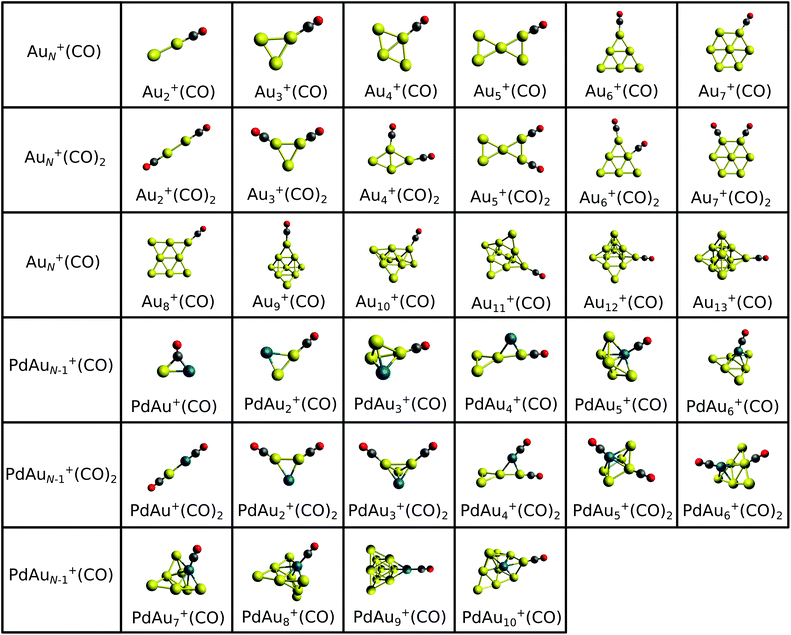
The structures of CO complexes can be determined, and their cluster–CO binding energies can be calculated, theoretically. Various CO adsorption sites were considered in order to determine the lowest-energy configurations. Atop (terminal), edge-bridging (bridge) and face-capping (hollow) binding sites were compared for the AuN+(CO) and PdAuN−1+(CO) clusters with N = 3 and 4. The relative binding energies of CO (ΔEb), corresponding to the different adsorption sites, are listed in Table S1 of the ESI.† Although the bridging site is preferred for PdAu+(CO), atop sites are found to be the preferred adsorption sites of CO for all the clusters with N = 3 and 4. In addition, the Au atop site is found to have a νCO value closest to that measured by IRMPD for both PdAu3+(CO) and Au4+(CO) clusters (see below). Atop CO binding on Au was previously suggested for the PdAu2+(CO) cluster.53 Based on the correlation of calculated atop CO frequencies and experiment, only atop site adsorption is considered for the larger cluster–CO complexes.Based on the structures located by our global optimization calculations and those reported recently,19 all possible atop adsorption site configurations of CO on AuN+ (N = 2–13) and PdAuN−1+ (N = 2–10) clusters were calculated. The geometries of the lowest energy cluster–CO complexes are shown in Fig. 3. The structures of complexes with two CO molecules adsorbed on atop sites have also been calculated for selected sizes (N = 2–7 for AuN+ and N = 4–7 for PdAuN−1+). Their lowest energy geometries are also shown in Fig. 3. Although a large number of CO ligands can distort the framework of some metal clusters (e.g. Au5+(CO)4,5 and Au6+(CO)5,6),36,91,92 in order to maximize the number of Au–CO bonds, the adsorption of a second CO molecule does not lead to significant structural rearrangements. The structures of the bare clusters have been presented in previous work.19 However, upon adsorption of a single CO molecule, the central structure of the doped PdAu7+ cluster undergoes a distortion from a square-based pyramid to a trigonal bipyramid. Also, for PdAu5+ there is a distortion from a bicapped tetrahedron for the bare cluster and mono-carbonyl species to a capped square-based pyramid for the dicarbonyl species. For the smallest clusters, the CO molecule is bound preferentially to a low-coordinated Au atom, while for N ≥ 6 the Pd dopant becomes the preferred adsorption site.
Based on the lowest energy structures presented in Fig. 3, CO binding energies were calculated viaeqn (1). A summary of the binding energies is presented graphically in Fig. 4 and listed in Table S2 of the ESI.† A very high Eb value is found for PdAu+(CO) (Eb = 5.93 eV) with a bridging CO adsorption site between the Au and Pd atoms, opposite to Au2+(CO) (Eb = 1.93 eV) where CO adopts an atop configuration. In the N = 3–5 size range, CO interacts directly with an Au atom in both AuN+(CO) and PdAuN−1+(CO). For N ≥ 6, an odd-even variation (relative to the number of atoms) can be seen in the calculated binding energies Eb for AuN+(CO) clusters. However, for sizes (N ≥ 5), a significantly larger Eb is obtained for the Pd-doped species, as compared to the pure clusters composed of the same number of atoms, except for size N = 7 which has almost the same value in both cases. Considering other CO adsorption sites, for PdAu6+(CO) Eb is only 0.1 eV greater for the global minimum (Pd bound), while this difference is 0.15 eV in the case of PdAu8+(CO). For the PdAu+(CO) cluster, CO adsorption on Au is 0.6 eV less stable than on Pd (which spontaneously deforms into the μ2 bridging mode), though the Au-bound isomer was predicted to be the most stable structure by Deng and co-workers.93 The greater binding strength of CO on Pd, compared to Au, is in line with numerous previous calculations for CO adsorption upon clusters and surfaces.81,94–97 Overall, as seen in Fig. 4, Pd-doping enhances the interaction of CO on the clusters, even in those cases where Au is the adsorption site. This is discussed in more depth in Section 3.3.
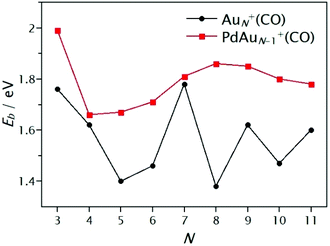 | ||
| Fig. 4 Cluster–CO binding energies (Eb) calculated by DFT as a function of cluster size for AuN+(CO) (N = 3–11) and PdAuN−1+(CO) (N = 3–10). | ||
The DFT calculations are complemented by mass spectrometric experiments. Already from the mass spectrum presented in Fig. 2 a size-dependent effect of Pd-doping can be seen in the interaction of the clusters with CO. For example, for N = 7 and 10 no clear influence of doping is visible (i.e. the ratio of the intensities of the cluster–CO complex and the bare cluster is comparable for AuN+ and PdAuN−1+). In contrast, a clear influence of the dopant is observed for N = 8 and 9, with the intensity ratio of the CO complexes to the bare clusters being larger for PdAuN−1+ than for AuN+. These differences in the relative intensities of the bare clusters and their CO-complexes only qualitatively illustrate the effect of doping on the interaction of a cluster with CO. To quantify the effect of doping, pressure dependent relative abundances of the CO complexes are fitted using eqn (2), as described in the Methods Section. This analysis gives the dissociation rates of CO, kd, which are sensitive to the CO binding energy.
Examples of these fits are shown in Fig. 5, for the pure gold clusters Au4+(CO), Au8+(CO) and Au20+(CO) in panel (a) and for the doped clusters PdAu3+(CO), PdAu7+(CO) and PdAu19+(CO) in panel (b). From the left panel of Fig. 5 it can be observed that the relative intensity of the CO complexes is higher for larger clusters. This is a consequence of the reduced heat capacity of the smaller species, which is reasonably well approximated as (3N-6)kB, where kB is the Boltzmann constant. Therefore, small clusters heat up more upon redistribution of the heat of formation of the CO complex (binding energy), thereby increasing kd.89 Thus, only clusters of the same size should be compared to exclude (to a first approximation) the effect of the different clusters heat capacities. The inclusion of heat capacity effects into the analysis is presented in section 3.2. A second observation from Fig. 5 is the effect of doping on the CO adsorption, as observed also in Fig. 2. While for N = 8 the presence of Pd increases the adsorption of CO considerably, reduced reactivity is found upon doping Au20+. This suggests stronger binding of CO to PdAu7+ than to Au8+, with the opposite applying to the cases of PdAu19+ and Au20+.
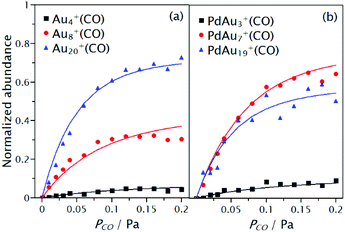 | ||
| Fig. 5 Normalized abundances of Au4+(CO), Au8+(CO) and Au20+(CO) in (a) and PdAu3+(CO), PdAu7+(CO) and PdAu19+(CO) in (b), as a function of PCO at the reaction cell. Points represent the experimental data, while solid lines are fits with eqn (2). | ||
A summary of the extracted kd values is shown in Fig. 6 for the pure AuN+ and singly doped PdAuN+ clusters (N = 4–21). First, an overall decrease of kd with cluster size is observed. This, as discussed previously, is a consequence of the reduced heat capacity of the smaller clusters. Although the influence of Pd is not drastic for all sizes, some interesting cases are seen. For sizes N = 4, 5, 9 and in particular for N = 8, reduced dissociation rates are observed upon doping. As a first approximation, this suggests that for these clusters the substitution of Au by Pd increases the CO binding energy. In contrast, for N = 7, 10 and 18–21, dissociation rates are higher upon doping. For these sizes, Pd doping seems to reduce the CO binding energy. This experimental observation apparently is in disagreement with the DFT calculated binding energies Eb shown in Fig. 4, where Pd doping was predicted to increase Eb, independent of cluster size. As discussed in the following section, the reason for this apparent discrepancy is that heat capacities are not accounted for.
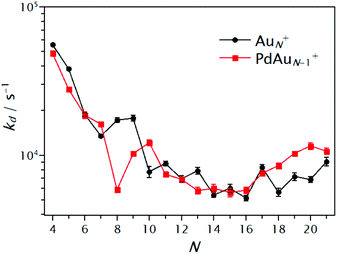 | ||
| Fig. 6 Dissociation rates of CO for AuN+(CO) (black circles) and PdAuN−1+(CO) (red squares) clusters extracted by fitting eqn (2) to the normalized abundance curves as a function of PCO. | ||
3.2 RRKM simulations for extracting CO binding energies
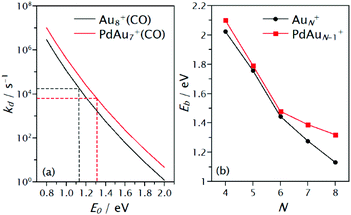
The CO binding energy is not the only factor that determines the rate at which CO will be desorb from a cluster. The effect of heat capacities should be included to compare with the DFT calculations, which provide Eb, with the kd that is obtained from the mass spectrometric experiments. One possibility is to use Rice–Ramsperger–Kassel–Marcus (RRKM) theory.98–100 In RRKM, a cluster is described as a set of s harmonic oscillators, one for each vibrational degree of freedom. One particular oscillator, the critical oscillator s0, is selected to represent the reaction coordinate R of the dissociation process. For the clusters studied here, the critical oscillator is the cluster–CO vibration, which leads to dissociation of the complex. The total energy of the energized system (after CO adsorption), E, is assumed to be statistically distributed over the s oscillators and dissociation occurs when a fraction of the total energy E, larger than a critical energy E0, is localized in s0. In this case, E0 is understood as the CO binding energy (calculated by DFT) and the heat capacity of a cluster depends on its vibrational degrees of freedom. By using statistical methods, an expression for the dissociation rate can be obtained. Thus, by knowing kd and the vibrational frequencies of a cluster, the CO binding energy can be estimated and therefore, theoretical calculations can be directly compared with the experimental findings. This analysis was performed by using the MassKinetics software package.101Results of this analysis are shown in Fig. 7. In panel (a) an example of the procedure is presented, for cluster size N = 8. Simulated dissociation rates are plotted as a function of the critical energy E0, which represents the CO binding energy Eb. As expected, kd decreases with increasing E0. Dotted lines represent the intersection of the experimentally determined rate and the corresponding critical energy associated with it. This process was performed for the clusters in the N = 4–8 size range. For this analysis, the vibrational frequencies of the lowest energy structures calculated by DFT were used. The RRKM determined CO binding energies are given in Fig. 7b. Despite the assumptions made in the RRKM analysis, the binding energies extracted by this approach and those calculated by DFT show the same trends. In both cases, an overall decrease in Eb with size is found, being more pronounced for AuN+, and most importantly, in all cases higher Eb are found for the Pd-doped clusters. The difference in Eb between AuN+ and PdAuN−1+ is found to be small for N = 4–6 and larger for N = 7 and 8. The effect of the Pd dopant atom for the N = 5 and 6 size, however, seems to be smaller in the RRKM estimation than that found by DFT, while the reverse is observed for N = 7.
3.3 Internal C–O stretching frequencies
The frequencies of the internal C–O stretching mode (νCO) for clusters adsorbing one or two CO molecules in the N = 4–14 size range were measured by IRMPD spectroscopy. Knowledge of νCO alone is not sufficient to characterize the structure of a cluster. However, as discussed below, it allows the determination of the reactive site for CO adsorption (either an Au or a Pd atom).Depending on cluster size, different behaviour of νCO with size is observed when comparing clusters with one or two CO molecules. This is exemplified in Fig. 8, which shows depletion spectra recorded for cluster sizes N = 5 and N = 7, both for the homoatomic (left) and Pd-doped species (right). For Au5+, a single absorption feature is observed around 2165 cm−1, independently of whether the cluster adsorbs a single or two CO molecules. For PdAu4+, however, the νCO band of the first CO molecule (black curve) is at approximately 2165 cm−1, as for Au5+, while for PdAu4+(CO)2 (red curve) two distinct bands are observed. A maximum in depletion is found at 2165 cm−1, in addition to a side peak close to 2120 cm−1. This suggests that for this doped cluster the first CO molecule is bound to an Au atom in PdAu4+, while the second CO is adsorbed on the Pd dopant. The situation is different for N = 7, as shown in the lower panels. As for the previous case, for the homoatomic Au cluster, bands for one and two adsorbed CO molecules are found at the same position, around 2160 cm−1. However, for PdAu6+, νCO of the first adsorbed CO is red-shifted by almost 30 cm−1, whereas when two CO molecules are adsorbed two distinctive bands are observed. This observation suggests that for PdAu6+ the first CO molecule is adsorbed on Pd, in contrast to PdAu4+, which is in agreement with our calculations.
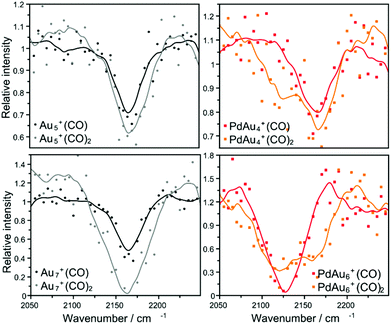 | ||
| Fig. 8 Depletion spectra of AuN+(CO)p and PdAuN−1+(CO)p clusters with N = 5, 7 and p = 1, 2. Points represent the experimental data, while solid lines are an average of 4 adjacent points. | ||
A summary of the vibrational frequencies determined by IRMPD of the first adsorbed CO molecule is shown in Fig. 9. For cluster sizes N = 4, 5 and 11, depletion spectra suggest that the binding site of the first CO molecule is an Au atom, while for N = 6–10 and 12–14, the first CO is proposed to be adsorbed on the Pd dopant.
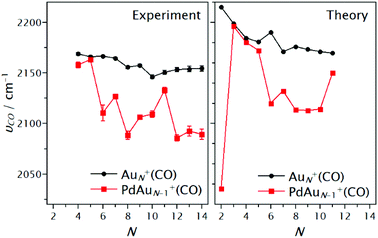 | ||
| Fig. 9 Measured and calculated CO stretching frequencies, νCO, for the first adsorbed CO molecule on AuN+ and PdAuN−1+ clusters. | ||
We have also calculated the vibrational frequency of CO on the most favourable adsorption site on each cluster, at the same level of theory used in the final calculations of the cluster–CO complex structures, i.e. LC-ωPBEh/Def2-TZVPP. Although the calculated νCO frequencies (after scaling) (right panel of Fig. 9) are found to be slightly blue-shifted with respect to the experimental values, trends are very well reproduced by DFT. The calculations predict a large difference between νCO of Au2+(CO) and PdAu+(CO), although in this particular case, this is a consequence of the bridge adsorption site found for PdAu+(CO). The similar values for the vibrational frequencies for PdAuN−1+(CO) and AuN+(CO) at sizes N = 4, 5 and 11 observed experimentally are also found in the theoretical calculations. For cluster sizes N = 6–10, a larger difference is predicted by DFT, also in agreement with the experimental results. A comparison with previous theoretical calculations from literature is difficult, since studies of the adsorption of CO on cationic Pd doped Au clusters at the subnanometre scale are scarce. The small difference between the frequencies for the species at N = 3 predicted here was suggested previously by Zhong et al.54 Zhong and co-workers54 performed DFT calculations for PdmAun+(CO) (n + m < 6) clusters at the B3PW91/6-311+G level. They found that CO binds to Pd in PdAu6+, in agreement with our findings.
Therefore, Pd–CO binding is responsible for red-shifting the CO stretch of the larger clusters N ≥ 6 (except for N = 11), relative to that of the free CO molecule (2143 cm−1). It has been shown that νCO for CO adsorbed on transition metal clusters can be decreased by replacing metal atoms with lower principal quantum numbers.102 Hence this is in agreement with our observation when Pd(4d) replaces Au(5d). A way of understanding this effect is provided by the Blyholder model,39 in which the metal–CO bonding is described by electron charge donation from the occupied 5σ orbital of CO to empty d-states of the metal, and back-donation of electron charge from occupied metal d-states to the 2π* antibonding orbital of CO, which is empty in the free molecule. For transition metal clusters, this model has successfully explained the adsorption of CO molecules and provided a description for the observed red-shifted νCO frequencies of adsorbed CO, in comparison to the free molecule. The back-donation process partly populates the 2π* antibonding orbital of CO, which destabilizes the C–O bond, lowering νCO. For the clusters with CO bound to Pd (N ≥ 6, except for N = 11), the lowered νCO frequencies suggest electron charge donation from the d-orbitals of Pd to CO, in agreement with the Blyholder model. This also agrees with previous calculations on the Pd–CO system, which predicted a decrease in νCO upon adsorption, although smaller than for other transition metals.103 Consequently, for those sizes where CO binds to the Pd dopant, the enhanced adsorption energy of CO upon doping can be rationalized by the significant electron donation from Pd d-states to the 2π* orbital of CO. For the clusters where CO interacts directly with an Au atom, however, νCO frequencies are found higher than for the free CO molecule. This shows that back-donation of electron charge is not a determining factor in the interaction of CO with Au, which is mainly due to electron charge donation from CO to Au. Therefore, for these sizes (N = 3–5) the Blyholder model loses its applicability, since electron back-donation is absent. The blue-shifting is due to the dominance of the repulsion between the filled 5σ HOMO of the CO molecule and a filled d-orbital on the Au atom, as described in the Bagus model.102,104
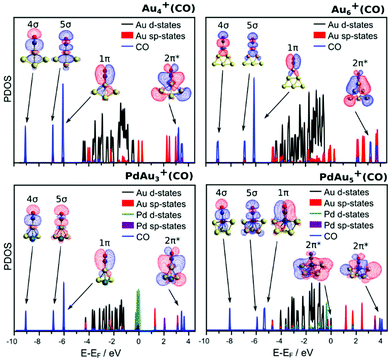
Partial density of states (PDOS) of four representative cluster–CO complexes, Au4+(CO), PdAu3+(CO), Au6+(CO) and PdAu5+(CO), are shown in Fig. 10. In each case, the DOS has been projected onto states with Au(d), Au(sp), Pd(d), Pd(sp) and CO character. In both pure Au clusters, three states with pronounced CO-character are found; plotting the wavefunction of these states reveals the same symmetry as the 4σ, 5σ and 1π MO or the free CO molecules, however in this case hybridized with the states of the cluster. The hybridized 5σ MO undergoes a pronounced stabilization upon CO adsorption, which is an indication of the 5σ to Au(d) electron charge transfer. Interestingly, for these two clusters the MOs with CO 2π* character are found well above the HOMO states. This shows that on pure Au clusters the back-donation of electron charge, from Au(d) to the CO 2π* state, is indeed absent, as discussed above based on the measured vibrational frequencies of the adsorbed CO molecules. The PDOS of the PdAu3+(CO) complex, with CO adsorbed on an Au site, is very similar to that of the pure Au clusters. Hybridized states with 4σ, 5σ and 1π symmetry are also found in the DOS, with a large stabilization of the 5σ MO. In the case of PdAu5+(CO), however, where CO binds to the Pd dopant, an important difference is observed. The HOMO state of this cluster has partial 2π* character, unlike the other three clusters where CO interacts directly with an Au atom. Although in this cluster there are still empty states with 2π* character, the HOMO state shows that, upon adsorption on Pd, back-donation of electron charge, from Pd(d) to CO 2π*, is present. This is again consistent with the measured vibrational frequencies of the internal C–O mode.
Tables S3 and S4 in the ESI† list the partial charge distributions calculated with both the Mulliken and Löwdin partitioning methods for some of the bare clusters and their CO complexes. It is noted that, except for PdAu+, the Au atoms donate electron charge to the Pd dopant, which is significantly less positively charged than the Au atoms, and occupies highly coordinated sites in order to maximise this electron charge transfer from Au to Pd.19,46 This observation explains why for the PdAu+(CO) complex CO binding onto Au is much less favourable than onto Pd (0.6 eV higher), in contrast to the other clusters in the N ≤ 5 size range. For this cluster, the Au atom has a higher electron charge in its d-states, diminishing the possibility of CO to donate electron charge from the 5σ orbital. Moreover, as shown in Fig. 3, the lowest-energy configuration for this complex is that with CO in a bridge position between the Au and the Pd atoms. Due to the Pd to Au electron charge donation in this cluster, the Pd dopant has less electron density available for donation to the 2π* orbital of CO, which is the dominant bonding mechanism when CO binds directly to the Pd dopant.
Overall, with the exception of N = 2, Pd doping is seen to enhance the binding energies of CO, irrespective of whether the adsorption site is an Au atom or the Pd dopant atom. This can be rationalized in terms of the observed Au to Pd electron charge donation. In those doped clusters where Au is the adsorption site, the CO 5σ to Au d-states donation is enhanced, since Au has donated electron charge from its d-states to Pd. In contrast, when CO binds to Pd, an enhanced d-state (Pd) to 2π* (CO) donation is present, due to the higher population of the Pd d-states.
The adsorption of CO leads to an electronic rearrangement in the cluster which is small in magnitude. The unclear behaviour of charge distribution was previously reported by Joshi et al.53 for dimeric and trimeric cationic AuPd clusters with an adsorbed CO, and attributed to complex electron density transfer processes. The carbon atom is overall negatively charged in all cases. This charge is of the same magnitude regardless of cluster size. For Au–CO binding, Mulliken and Löwdin partial charges are C = −0.07e, O = +0.07e and C = −0.12e, O = +0.12e, respectively, and CO adsorbs preferentially to the Au atom that is more electron deficient. The oxygen atom is overall electron deficient and is again unaffected by the cluster size. This lack of size/structure sensitivity in CO electronics is in line with the lack of sensitivity of the M–C and C–O bond lengths across the cluster series. Multiple adsorption, as shown in the case of Au4+(CO)1,2 (Table S5 in the ESI†) does not lead to a significant change in electronic properties.
4 Conclusions
We have presented a study combining low-pressure collision cell reactivity and infrared multiphoton dissociation spectroscopy experiments with density functional theory calculations, to investigate the influence of Pd-doping on the interaction between CO molecules and small cationic gold clusters.The rates of dissociation of formed cluster–CO complexes in the low-pressure collision cell were used to experimentally determine binding energies of CO on small cationic Au and Pd doped Au clusters. Hereto, an RRKM analysis was performed using as input parameters the dissociation rates of the CO-complexes and the vibrational frequencies of the clusters, calculated by DFT on the lowest energy structures. Pd doping is found to increase the CO binding energies irrespective of cluster size, although the extent of this increase is size-dependent. These findings agree remarkably well with binding energies determined by DFT.
Infrared multiphoton dissociation spectroscopy was used to characterize the internal C–O vibrational frequency and determine the CO adsorption site preference on the doped clusters. In clusters with N = 4, 5 and 11 atoms, CO binds to an Au atom, whereas for clusters with N = 6–10 and 12–14, CO binds to the Pd dopant, in agreement with theory.
This work highlights the subtle variations of adsorption preference and reactivity of clusters in the subnanometre size regime where every-atom-counts. We find that multiple synergistic analysis methods are necessary to unambiguously describe the preferred adsorption modes and binding strengths for cluster–molecule interactions.
Conflicts of interest
There are no conflicts to declare.Acknowledgements
H. A. A. is grateful to the University of Kufa and the Ministry of Higher Education and Scientific Research (Iraq) for financial support through the award of a PhD scholarship. P. F. and J. V. acknowledge the Research Foundation-Flanders (FWO) for a post-doctoral and doctoral grant, respectively. Calculations were performed on: the University of Birmingham's BlueBEAR high-performance computer (http://www.bear.bham.ac.uk/bluebear); ATHENA at HPC Midlands Plus, which is funded by the EPSRC through grant (EP/P020232); THOMAS, the UK Materials and Molecular Modelling Hub for computational resources, which is partially funded by EPSRC (EP/P020194/1); and ARCHER, the UK National Supercomputing Service (http://www.archer.ac.uk) via membership of the UK's HPC Materials Chemistry Consortium, which is funded by EPSRC (EP/L000202), and “TOUCAN: Towards an Understanding of Catalysis on Nanoalloys” membership, which is funded by EPSRC under Critical Mass Grant (EP/J010804/1). This work was supported by the FWO and the KU Leuven Research Council (GOA/14/007 and C14/18/073).References
- H. Zhang, T. Watanabe, M. Okumura, M. Haruta and N. Toshima, Nat. Mater., 2012, 11, 49–52 CrossRef PubMed.
- T. V. de Bocarmé, T.-D. Chau, F. Tielens, J. Andrés, P. Gaspard, R. L. C. Wang, H. J. Kreuzer and N. Kruse, J. Chem. Phys., 2006, 125, 054703 CrossRef PubMed.
- F. Tielens, J. Andrés, T.-D. Chau, T. V. de Bocarmé, N. Kruse and P. Geerlings, Chem. Phys. Lett., 2006, 421, 433–438 CrossRef CAS.
- M. García-Motaa and N. López, Phys. Chem. Chem. Phys., 2011, 13, 5790–5797 RSC.
- S. A. Tenney, W. He, C. C. Roberts, J. S. Ratli, S. I. Shah, G. S. Shafai, V. Turkowski, T. S. Rahman and D. A. Chen, J. Phys. Chem. C, 2011, 115, 11112–11123 CrossRef CAS.
- T. V. de Bocarmé, M. Moors, N. Kruse, I. S. Atanasov, M. Hou, A. Cerezo and G. D. W. Smith, Ultramicroscopy, 2009, 109, 619–624 CrossRef PubMed.
- Y. Gao, W. Huang, J. Woodford, L. Wang and X. C. Zeng, J. Am. Chem. Soc., 2009, 131, 9484–9485 CrossRef CAS.
- R. Ferrando, J. Jellinek and R. L. Johnston, Chem. Rev., 2008, 108, 846 CrossRef PubMed.
- V. Soto-Verdugo and H. Metiu, Surf. Sci., 2007, 601, 5332–5339 CrossRef CAS.
- A. Hugon, L. Delannoy, J. Krafft and C. Louis, J. Phys. Chem. C, 2010, 114, 10823 CrossRef CAS.
- A. Dhouib and H. Guesmi, Chem. Phys. Lett., 2012, 521, 98–103 CrossRef CAS.
- L. Delannoy, S. Giorgio, G. Mattei, C. R. Henry, N. El Kolli, C. Møthivier and C. Louis, ChemCatChem, 2013, 5, 2707–2716 CrossRef CAS.
- R. Ismail, R. Ferrando and R. L. Johnston, J. Phys. Chem. C, 2013, 117, 293 CrossRef CAS.
- H. A. Hussein, J. B. A. Davis and R. L. Johnston, Phys. Chem. Chem. Phys., 2016, 18, 26133–26143 RSC.
- H. A. Hussein and R. L. Johnston, in Frontiers of Nanoscience, ed. S. T. Bromley and S. M. Woodley, Elsevier, Amsterdam, 2018, pp. 145–169 Search PubMed.
- S. Zhou, J. Li, M. Schlangen and H. Schwarz, Angew. Chem., Int. Ed., 2016, 55, 10877–10880 CrossRef CAS PubMed.
- S. M. Lang, I. Fleischer, T. M. Bernhardt, R. N. Barnett and U. Landman, J. Am. Chem. Soc., 2012, 134, 20654–20659 CrossRef CAS PubMed.
- H. Schwarz, Angew. Chem., Int. Ed., 2015, 54, 10090–10100 CrossRef CAS PubMed.
- P. Ferrari, H. A. Hussein, C. J. Heard, J. Vanbuel, R. L. Johnston, P. Lievens and E. Janssens, Phys. Rev. A, 2018, 97, 052508 CrossRef CAS.
- J. Oliver-Meseguer, J. R. Cabrero-Antonino, I. Domínguez, A. Leyva-Pérez and A. Corma, Science, 2012, 338, 1452–1455 CrossRef CAS PubMed.
- B. Hammer and J. K. Norskov, Nature, 2002, 376, 238–240 CrossRef.
- F. Yang, D. Deng, X. Pan, Q. Fu and X. Bao, Natl. Sci. Rev., 2015, 2, 183–201 CrossRef CAS.
- A. Sanchez, S. Abbet, U. Heiz, W. D. Schneider, H. Häkkinen, R. N. Barnett and U. Landman, J. Phys. Chem. A, 1999, 103, 9573–9578 CrossRef CAS.
- U. Heiz, A. Sanchez, S. Abbet and W. D. Schneider, Eur. Phys. J. D, 1999, 9, 35–39 CrossRef CAS.
- D. A. H. Cunningham, W. Vogel, H. Kageyama, S. Tsubota and M. Haruta, J. Catal., 1998, 177, 1–10 CrossRef CAS.
- G. Brodén, T. N. Rhodin, C. Brucker, R. Benbow and Z. Hurych, Surf. Sci., 1976, 59, 593–611 CrossRef.
- A. Fielicke, P. Gruene, G. Meijer and D. M. Rayner, Surf. Sci., 2009, 603, 1427–1433 CrossRef CAS.
- I. Swart, A. Fielicke, B. Redlich, G. Meijer, B. M. Weckhuysen and F. M. F. de Groot, J. Am. Chem. Soc., 2007, 129, 2516–2520 CrossRef CAS PubMed.
- D. B. Pedersen, D. M. Rayner, B. Simard, M. A. Addicoat, M. A. Buntine, G. F. Metha and A. Fielicke, J. Phys. Chem. A, 2004, 108, 964–970 CrossRef CAS.
- M. A. Addicoat, M. A. Buntine, B. Yates and G. F. Metha, J. Comput. Chem., 2008, 29, 1497–1506 CrossRef CAS PubMed.
- A. S. Gentleman, M. A. Addicoat and G. F. Metha, Aust. J. Chem., 2011, 64, 1554 CrossRef CAS.
- Y. Xie, S. G. He, F. Dong and E. R. Bernstein, J. Chem. Phys., 2008, 128, 044306 CrossRef CAS PubMed.
- J. K. Nørskov, T. Bligaard, J. Rossmeisl and C. H. Christensen, Nat. Chem., 2009, 1, 37–46 CrossRef PubMed.
- T. Wang, X.-X. Tian, Y.-W. Li, J. Wang, M. Beller and H. Jiao, ACS Catal., 2014, 4, 1991–2005 CrossRef CAS.
- J. T. Lyon, P. Gruene, A. Fielicke, G. Meijer and D. M. Rayner, J. Chem. Phys., 2009, 131, 184706 CrossRef PubMed.
- A. Fielicke, G. Von Helden, G. Meijer, D. B. Pedersen, B. Simard and D. M. Rayner, J. Am. Chem. Soc., 2005, 127, 8416–8423 CrossRef CAS.
- A. Fielicke, G. Von Helden, G. Meijer, B. Simard and D. M. Rayner, J. Phys. Chem. B, 2005, 109, 23935–23940 CrossRef CAS PubMed.
- P. Gruene, A. Fielicke, G. Meijer and D. M. Rayner, Phys. Chem. Chem. Phys., 2008, 10, 6144–6149 RSC.
- G. Blyholder, J. Phys. Chem., 1964, 68, 2772–2777 CrossRef CAS.
- I. Chorkendorff and J. W. Niemantsverdriet, Concepts of Modern Catalysis and Kinetics, Wiley-VCH, Germany, 3rd edn, 2017 Search PubMed.
- P. Pyykkö and N. Runeberg, Angew. Chem., Int. Ed., 2002, 41, 2174–2176 CrossRef.
- P. Ferrari, L. M. Molina, V. E. Kaydashev, J. A. Alonso, P. Lievens and E. Janssens, Angew. Chem., Int. Ed., 2016, 55, 11059–11063 CrossRef CAS.
- P. V. Nhat, T. B. Tai and M. T. Nguyen, J. Chem. Phys., 2012, 137, 164312 CrossRef PubMed.
- H. T. Le, S. M. Lang, J. De Haeck, P. Lievens and E. Janssens, Phys. Chem. Chem. Phys., 2012, 14, 9350–9358 RSC.
- P. Gruene, A. Fielicke, G. Meijer, E. Janssens, T. N. Vu, T. N. Minh and P. Lievens, ChemPhysChem, 2008, 9, 703–706 CrossRef CAS.
- V. Kaydashev, P. Ferrari, C. Heard, E. Janssens, R. L. Johnston and P. Lievens, Part. Part. Syst. Charact., 2016, 33, 364–372 CrossRef CAS.
- A. Shayeghi, C. J. Heard, R. L. Johnston and R. Schäfer, J. Chem. Phys., 2014, 140, 054312 CrossRef CAS.
- V. E. Kaydashev, E. Janssens and P. Lievens, J. Chem. Phys., 2015, 142, 034310 CrossRef PubMed.
- S. M. Lang, A. Frank and T. M. Bernhardt, Int. J. Mass Spectrom., 2013, 354–355, 365–371 CrossRef CAS.
- E. M. Fernández, M. B. Torres and L. C. Balbás, Eur. Phys. J. D, 2009, 52, 135–138 CrossRef.
- W. Zeng, J. Tang, P. Wang and Y. Pei, RSC Adv., 2016, 6, 55876–55877 Search PubMed.
- C. Song, Q. Ge and L. Wang, J. Phys. Chem. B, 2005, 109, 22341–22350 CrossRef CAS PubMed.
- A. M. Joshi, M. H. Tucker, W. N. Delgass and K. T. Thomson, J. Chem. Phys., 2006, 125, 194707 CrossRef PubMed.
- Y. M. Chen, X. Y. Kuang, X. W. Sheng, P. Shao, M. M. Zhong and H. Q. Wang, Z. Naturforsch., A: Phys. Sci., 2013, 68, 651–658 CAS.
- D. Palagin and J. P. K. Doye, Phys. Chem. Chem. Phys., 2015, 17, 28010–28021 RSC.
- J. Zhang and A. N. Alexandrova, J. Phys. Chem. Lett., 2013, 4, 2250–2255 CrossRef CAS.
- M. Neumaier, F. Weigend, O. Hampe and M. M. Kappes, J. Chem. Phys., 2006, 125, 104308 CrossRef PubMed.
- Y. Zhao, Z. Li and J. Yang, Phys. Chem. Chem. Phys., 2009, 11, 2329–2334 RSC.
- F. Gao, Y. Wang and D. W. Goodman, J. Phys. Chem. C, 2009, 113, 14993–15000 CrossRef CAS.
- F. Gao, Y. Wang and D. W. Goodman, J. Am. Chem. Soc., 2009, 131, 5734–5735 CrossRef CAS PubMed.
- B. Zhu, G. Thrimurthulu, L. Delannoy, C. Louis, C. Mottet, J. Creuze, B. Legrand and H. Guesmi, J. Catal., 2013, 308, 272–281 CrossRef CAS.
- N. El Kolli, L. Delannoy and C. Louis, J. Catal., 2013, 297, 79–92 CrossRef.
- P. S. West, R. L. Johnston, G. Barcaro and A. Fortunelli, J. Phys. Chem. C, 2010, 114, 19678–19686 CrossRef CAS.
- J. Davis, A. Shayeghi, S. L. Horswell and R. L. Johnston, Nanoscale, 2015, 7, 14032–14038 RSC.
- G. Kresse and J. Hafner, Phys. Rev. B: Condens. Matter Mater. Phys., 1993, 47, 558–561 CrossRef CAS.
- J. Perdew, K. Burke and Y. Wang, Phys. Rev. B: Condens. Matter Mater. Phys., 1996, 54, 16533–16539 CrossRef CAS.
- G. Kresse, Phys. Rev. B: Condens. Matter Mater. Phys., 1999, 59, 1758–1775 CrossRef CAS.
- D. Cortés-Arriagada, M. P. Oyarzún, L. Sanhueza and A. Toro-Labbé, J. Phys. Chem. A, 2015, 119, 6909–6918 CrossRef PubMed.
- D. Cortés-Arriagada and A. Toro-Labbé, Theor. Chem. Acc., 2016, 135, 52 Search PubMed.
- B. R. Goldsmith, J. Florian, J. X. Liu, P. Gruene, J. T. Lyon, D. M. Rayner, A. Fielicke, M. Scheffler and L. M. Ghiringhelli, Phys. Rev. Mater., 2019, 3, 016002 Search PubMed.
- M. Methfessel and A. T. Paxton, Phys. Rev. B: Condens. Matter Mater. Phys., 1989, 40, 3616–3621 CrossRef CAS PubMed.
- M. Valiev, E. J. Bylaska, N. Govind, K. Kowalski, T. P. Straatsma, H. J. J. Van Dam, D. Wang, J. Nieplocha, E. Apra, T. L. Windus and W. A. De Jong, Comput. Phys. Commun., 2010, 181, 1477–1489 CrossRef CAS.
- F. Weigend and R. Ahlrichs, Phys. Chem. Chem. Phys., 2005, 7, 3297–3305 RSC.
- O. A. Vydrov and G. E. Scuseria, J. Chem. Phys., 2006, 125, 234109 CrossRef PubMed.
- M. A. Rohrdanz, K. M. Martins and J. M. Herbert, J. Chem. Phys., 2009, 130, 054112 CrossRef PubMed.
- R. Reske, M. Duca, M. Oezaslan, K. J. P. Schouten, M. T. M. Koper and P. Strasser, J. Phys. Chem. Lett., 2013, 4, 2410–2413 CrossRef CAS.
- S. Refaely-Abramson, R. Baer and L. Kronik, Phys. Rev. B: Condens. Matter Mater. Phys., 2011, 84, 075144 CrossRef.
- M. Pastore, E. Mosconi, F. De Angelis and M. Grätzel, J. Phys. Chem. C, 2010, 114, 7205–7212 CrossRef CAS.
- A. Shayeghi, R. Schäfer, D. M. Rayner, R. L. Johnston and A. Fielicke, J. Chem. Phys., 2015, 143, 024310 CrossRef CAS PubMed.
- A. Shayeghi, R. L. Johnston, D. M. Rayner, R. Schäfer and A. Fielicke, Angew. Chem., Int. Ed., 2015, 54, 10675–10680 CrossRef CAS PubMed.
- J. B. A. Davis, F. Baletto and R. L. Johnston, J. Phys. Chem. A, 2015, 119, 9703–9709 CrossRef CAS PubMed.
- K. P. Huber and G. Herzberg, Molecular Spectra And Molecular Structure, IV. Constants Of Diatomic Molecules, Van Nostrand Reinhold, New York, 1979, vol. 5 Search PubMed.
- A. Fielicke, G. von Helden, G. Meijer, D. B. Pedersen, B. Simard and D. M. Rayner, J. Phys. Chem. B, 2004, 108, 14591–14598 CrossRef CAS.
- P. Ferrari, J. Vanbuel, Y. Li, T.-W. Liao, E. Janssens and P. Lievens, in Gas aggregation synthesis of nanoparticles, ed. Y. Huttel, Wiley-VCH, 2017, pp. 59–78 Search PubMed.
- E. Janssens, H. T. Le and P. Lievens, Chem. – Eur. J., 2015, 21, 15256–15262 CrossRef CAS PubMed.
- H. T. Le, S. M. Lang, J. De Haeck, P. Lievens and E. Janssens, Phys. Chem. Chem. Phys., 2012, 14, 9350–9358 RSC.
- J. De Haeck, N. Veldeman, P. Claes, E. Janssens, M. Andersson and P. Lievens, J. Phys. Chem. A, 2011, 115, 2103–2109 CrossRef CAS PubMed.
- W. Schöllkopf, S. Gewinner, H. Junkes, A. Paarmann, G. von Helden, H. P. Bluem and A. M. M. Todd, in Advances in X-ray Free-Electron Lasers Instrumentation III, 2015, vol. 9512, p. 95121L Search PubMed.
- W. Schöllkopf, S. Gewinner, W. Erlebach, H. Junkes, A. Liedke, G. Meijer, A. Paarmann, G. von Helden, H. Bluem, D. Dowell, R. Lange, J. Rathke, A. M. M. Todd, L. M. Young, U. Lehnert, P. Michel, W. Seidel, R. Wensch and S. C. Gottschalk, in the 36th Free Electron Laser Conference, Basel, 2014, pp. 629–634.
- N. X. Truong, M. Haertelt, B. K. A. Jaeger, S. Gewinner, W. Schöllkopf, A. Fielicke and O. Dopfer, Int. J. Mass Spectrom., 2016, 395, 1–6 CrossRef CAS.
- A. P. Woodham and A. Fielicke, in Gold Clusters, Colloids and Nanoparticles I. Structure and Bonding, ed. D. M. P. Mingos, Springer, Cham, 2013, pp. 243–278 Search PubMed.
- X.-F. Yang, Y.-L. Wang, Y.-F. Zhao, A.-Q. Wang, T. Zhang and J. Li, Phys. Chem. Chem. Phys., 2010, 12, 3038 RSC.
- X. Chen, R. F. Lu, E. J. Kan, Y. Z. Liu, C. Y. Xiao and K. M. Deng, J. Mol. Model., 2014, 20, 2313 CrossRef PubMed.
- F. Abild-Pedersen and M. P. Andersson, Surf. Sci., 2007, 601, 1747–1753 CrossRef CAS.
- A. Patra, J. Sun and J. P. Perdew, 2019, arXiv:1807.05450v2 [cond-mtrl-sci].
- T. E. Fan, I. Demiroglu, H. A. Hussein, T. D. Liu and R. L. Johnston, Phys. Chem. Chem. Phys., 2017, 19, 27090–27098 RSC.
- I. Demiroglu, Z. Y. Li, L. Piccolo and R. L. Johnston, Catal. Sci. Technol., 2016, 6, 6916–6931 RSC.
- T. M. Bernhardt, J. Hagen, S. M. Lang, D. M. Popolan, L. D. Socaciu-Siebert and L. Wöste, J. Phys. Chem. A, 2009, 113, 2724 CrossRef CAS PubMed.
- R. A. Marcus, J. Chem. Phys., 1952, 20, 359–364 CrossRef CAS.
- K. A. Holbrook, M. J. Pilling and S. H. Robertson, Unimolecular Reactions, John Wiley & Sons Ltd, Chichester, UK, 2nd edn, 1996 Search PubMed.
- L. Drahos and K. Vékey, J. Mass Spectrom., 2001, 36, 237–263 CrossRef CAS PubMed.
- C. D. Zeinalipour-Yazdi, A. L. Cooksy and A. M. Efstathiou, Surf. Sci., 2008, 602, 1858–1862 CrossRef CAS.
- P. Schwerdtfeger, J. S. McFeaters, J. J. Moore, D. M. McPherson, R. P. Cooney, G. A. Bowmaker, M. Dolg and D. Andrae, Langmuir, 1991, 7, 116–125 CrossRef CAS.
- P. S. Bagus, C. J. Nelin and C. W. Bauschlicher, Phys. Rev. B: Condens. Matter Mater. Phys., 1983, 28, 5423–5438 CrossRef CAS.
- D. Deaven and K. Ho, Phys. Rev. Lett., 1995, 75, 288–291 CrossRef CAS PubMed.
Footnote |
| † Electronic supplementary information (ESI) available. See DOI: 10.1039/c9nr04237g |
| This journal is © The Royal Society of Chemistry 2019 |

