
 Open Access Article
 This Open Access Article is licensed under a Creative Commons Attribution-Non Commercial 3.0 Unported Licence
Microlens array enhanced upconversion luminescence at low excitation irradiance†
Qingyun
Liu
ab,
Haichun
Liu
 *a,
Deyang
Li
b,
Wen
Qiao
c,
Guanying
Chen
*b and
Hans
Ågren
*abd
*a,
Deyang
Li
b,
Wen
Qiao
c,
Guanying
Chen
*b and
Hans
Ågren
*abd
aDepartment of Theoretical Chemistry and Biology, KTH Royal Institute of Technology, Stockholm, Sweden. E-mail: hagren@kth.se; haichun@kth.se
bSchool of Chemistry and Chemical Engineering, Harbin Institute of Technology, Harbin, P.R. China. E-mail: chenguanying@hit.edu.cn
cSchool of Optoelectronic Science and Engineering & Collaborative Innovation Center of Suzhou Nano Science and Technology, Soochow University, Suzhou 215006, P.R. China
dCollege of Chemistry and Chemical Engineering, Henan University, Kaifeng, Henan 475004, P.R. China
First published on 17th July 2019
Abstract
The dearth of high upconversion luminescence (UCL) intensity at low excitation irradiance hinders the prevalent application of lanthanide-doped upconversion nanoparticles (UCNPs) in many fields ranging from optical bioimaging to photovoltaics. In this work, we propose to use microlens arrays (MLAs) as spatial light modulators to manipulate the distribution of excitation light fields in order to increase UCL, taking advantage of its nonlinear response to the excitation irradiance. We show that multicolored UCL from NaYF4:Yb3+,Er3+@NaYF4:Yb3+,Nd3+ and NaYF4:Yb3+,Tm3+@NaYF4:Yb3+,Nd3+ core/shell UCNPs can be increased by more than one order of magnitude under either 980 or 808 nm excitation, by simply placing a polymeric MLA onto the top of these samples. The observed typical green (525/540 nm) and red (654 nm) UCL bands from Er3+ and a blue (450/475 nm) UCL band from Tm3+ exhibit distinct enhancement factors due to their different multi-photon processes. Importantly, our ray tracing simulation reveals that the MLA is able to spatially confine the excitation light (980 and 808 nm) by orders of magnitude, thus amplifying UCL by more than 225-fold (the 450 nm UCL band of Tm3+) at low excitation irradiance. The proposed MLA method has immediate ramifications for the improved performance of all types of UCNP-based devices, such as UCNP-enhanced dye sensitized solar cells demonstrated here.
Introduction
The infrared (IR) region, which contains almost half of the irradiated solar energy, has for a long time constituted the hardest part of the solar irradiation spectrum to be utilized in solar cells.1,2 This is because the involved photosensitizers such as dyes and perovskites typically have very limited response to IR light.3,4 Lanthanide-doped upconversion nanoparticles (UCNPs), which are able to convert the spectral energy in the IR range into shorter-wavelength IR, visible, or even the UV range,1,2,5–12 can provide a solution to circumvent the transmission loss in photovoltaic devices by converting two or more sub-band-gap photons into one above-band-gap photon, and potentially change the status of IR energy utilization of various types of solar cells.Recent advances in upconversion nanochemistry have led to a ready access to high-quality UCNPs with a high luminescence quantum efficiency up to 19% (our previous world-record results) and above.13,14 However, such a high quantum efficiency of UCNPs is concealed by their relatively high excitation-intensity threshold, typically well above 1 W cm−2, which is much higher than that of IR light in the solar spectrum. As a result, when incorporated into solar cells, much of the light converting capacity of UCNPs is wasted due to the low excitation irradiance.15,16 This is fundamentally rooted in the multi-photon nature of UCL.
In view of the nonlinearity of UCNPs, we have, in our previous work, proposed a strategy of modulating the temporal distribution of delivered excitation photons to boost UCL.17,18 By employing quasi-CW excitation (i.e. pulsed excitation with a μs-ms pulse width), multi-photon UCL can be easily enhanced by orders of magnitude relative to that under equivalent CW excitation with identical average excitation intensity. In this work, we explore a spatial version of excitation light modulation to evoke the prominent intrinsic photon conversion capacity of upconversion nanocrystals, which can be achieved only at high excitation intensity. Technically, we propose to utilize polymer-based microlens arrays (MLAs) to spatially modulate the excitation light. It turns out that the light concentration caused by the MLA can lead to significant UCL enhancement, readily higher than one order of magnitude. We performed ray tracing simulations, linking to the excitation light intensity response of nanocrystals, to seek optimal microlens configurations for the upconversion enhancement. The proposed strategy can overcome the high excitation-intensity threshold of upconversion nanomaterials and bring about future breakthroughs in their energy applications to enhance the performance of solar cells in the IR range. It should be noted that our approach is general and can be combined with other strategies, chemical or photonic, of enhancing UCL.
Experiment
Materials
Yttrium(III) chloride hexahydrate (YCl3·6H2O, 99.99%), neodymium(III) chloride hexahydrate (NdCl3·6H2O, 99.99%), erbium(III) chloride hexahydrate (TmCl3·6H2O, 99.99%), thulium(III) chloride hexahydrate (TmCl3·6H2O, 99.99%), sodium hydroxide (NaOH), ammonium fluoride (NH4F), 1-octadecene (ODE), oleic acid (OA), ethanol, methanol, and cyclohexane were purchased from Sigma-Aldrich. All the chemicals were used without further purification.Nanoparticle syntheses
![[thin space (1/6-em)]](https://www.rsc.org/images/entities/char_2009.gif) :1 v/v) and finally dispersed in cyclohexane for subsequent use.
:1 v/v) and finally dispersed in cyclohexane for subsequent use.
Characterization
The structural and morphological characterization was performed on a transmission electron microscope (JEOL, JEM-1400). Luminescence spectra were recorded on an Edinburgh FS5 spectrophotometer equipped with 808 and 980 nm diode lasers. An optical microscope (Olympus CX23) and a surface profiler (Veeco, Dektek 150) were used to characterize the surface structure of the MLA. A solar simulator (Newport Oriel, LSC-100) and a computerized Keithley 2400 source meter were used for current density–voltage (JV) measurement.Investigation of upconversion luminescence enhancement by addition of MLA
A suspension of UCNPs in cyclohexane (500 μL) was added dropwise onto the conducting side of a piece of FTO glass and then dried in mild air at room temperature. A collimated beam of NIR excitation light was shone on the nanoparticles, and the generated emission light was collected by a fiber, placed at the rear side of the FTO glass slide, and then detected by a connected spectrometer. When a piece of MLA was applied, it was attached to the UCNP surface with the assistance of a thin layer of solvent (water, ethanol, methanol) between the MLA and the UCNP layer.Current density–voltage (JV) measurement and characteristics
All the measurements given below were performed on dye sensitized solar cells (DSSC) purchased from the 3GSolar, Ltd. The current density–voltage measurements were performed with a solar simulator (Newport, AM 1.5G, illumination at 0.1 W cm−2) and a computerized Keithley 2400 source meter. UCNPs in cyclohexane (250 μL, 10 mg mL−1) were first added dropwise onto a thin cover slide (1.5 cm × 1.5 cm, a thickness of 0.17 mm) and then dried in air to form a UCNP layer. Current density–voltage (JV) measurements were performed on a reference DSSC, a DSSC with a dry UCNP layer or a MLA placed on top, and a DSSC with both a dry UCNP layer and an MLA placed on top to compare the efficiency differences. For all JV measurements, a black mask was placed on top of the whole DSSC setup to create a 1.0 cm × 0.7 cm exposure area.Results and discussion
Motivation of using microlens arrays as spatial light modulators to enhance upconversion luminescence
Due to the nonlinearity of UCL, its quantum yield (QY) is generally not constant, but increases with the excitation intensity (Fig. 1).15 For instance, for a standard two-photon UCL band, the QY, Φ2-ph, is scaled with the excitation intensity (Iex) according to:15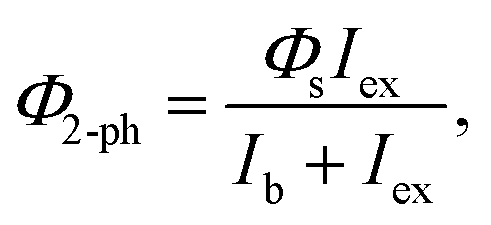 | (1) |
 | ||
| Fig. 1 Schematic illustration of a microlens array-enhanced quantum yield of upconversion luminescence due to its nonlinear response to excitation intensity. | ||
Noticing that UCNPs demand high excitation intensity to trigger their light-conversion capacity, we devoted our efforts to seeking suitable light concentrators. We realized that micrometer-sized lens arrays, among others, can be ideal candidates to improve the performance of UCNP-sensitized devices (Fig. 1), e.g. solar cells. MLAs can not only efficiently concentrate excitation light due to their small radius of curvature, but also be easily integrated into photonic devices. In addition, the availability of relatively low-cost raw materials (e.g. polymer) and fabricating techniques potentially makes the cost affordable for large-scale production. In this work, we investigated the excitation-light modulation effect of MLAs on the luminescence intensity of UCNPs.
Morphologies and optical properties of upconversion nanoparticles
Core NaYF4:20%Yb3+,2%Er3+ and NaYF4:20%Yb3+,0.5%Tm3+ nanoparticles and the corresponding core–shell structured NaYF4:20%Yb3+,2%Er3+@20%Yb3+,30%Nd3+ (denoted as YbEr@YbNd) and NaYF4:20%Yb3+,0.5%Tm3+@20%Yb3+,30%Nd3+ (denoted as YbTm@YbNd) nanoparticles were synthesized following previously reported protocols.19,20 The morphologies of the synthesized nanoparticles were characterized on a transmission electron microscope. The core NaYF4:20%Yb3+,2%Er3+ nanoparticles have an average diameter of ∼30 nm (Fig. S1(a)†), and the core–shell YbEr@YbNd nanoparticles ∼40 nm (Fig. S1(b)†). The Tm3+-doped core and core–shell nanoparticles have a similar average diameter to those of their Er3+-doped counterparts, ∼30 nm and ∼41 nm, respectively (Fig. S1(c) and S1(d)†).The UCL properties of the core–shell YbEr@YbNd and YbTm@YbNd nanoparticles were subsequently studied under continuous-wave (CW) 980 and 808 nm excitation. The YbEr@YbNd nanoparticles emitted relatively strong emission bands at 525/540 nm and 654 nm under both 980 and 808 nm excitation (Fig. S2(a)†), originating from the 2H11/2/4S3/2 → 4I15/2 and the 4F9/2 → 4I15/2 transition of Er3+ ions, respectively.21 The UCL intensity under 808 nm excitation was weaker than that under 980 nm excitation, as energy loss is caused in the indirect excitation approach of 808 nm light (via Nd3+ → Yb3+ → Er3+), which is equivalent to the direct excitation approach of 980 nm light (via Yb3+ → Er3+).22 A much weaker emission band at 409 nm, originating from the Er3+ 2H9/2 → 4I15/2 transition,23 was also detected in both excitation approaches. The excitation intensity response of the nanoparticles was then quantified for both 980 and 808 nm excitation, by varying the excitation power and recording the corresponding UCL spectra. The two-photon green emission bands at 525/540 nm exhibited a near quadratic dependence on the excitation intensity at low excitation intensity (2.93–36.29 W cm−2, 23–285 mW with a beam diameter of ∼1.0 mm) upon CW 980 nm excitation, featuring a slope efficiency of 1.5 (Fig. S2(b)†). Under the same conditions, the red band at 654 nm shows a steeper dependence on the excitation intensity, with a slope efficiency of 1.8. The three-photon blue band at 409 nm shows a slope efficiency of 2.2. The excitation intensity (980 nm) dependence of all these upconversion bands became less prominent with increasing excitation power, which can be ascribed to a saturation effect.15 These UCL bands of YbEr@YbNd nanoparticles exhibit a similar response to the intensity of CW 808 nm excitation light, but with a faster saturation trend (Fig. S2(c)†).
The YbTm@YbNd nanoparticles emitted relatively strong emission bands at 650 nm, 475 nm, and 450 nm (Fig. S2(d)†), originating from the transitions 1G4 → 3F4, 1G4 → 3H6, and 1D2 → 3F4 of Tm3+, respectively.24 These emission bands all show a nonlinear dependence on the excitation intensity under both 980 and 808 nm excitations (Fig. S2(e) and S2(f)†).
Upconversion luminescence enhancement by using a microlens array as an excitation light spatial modulator
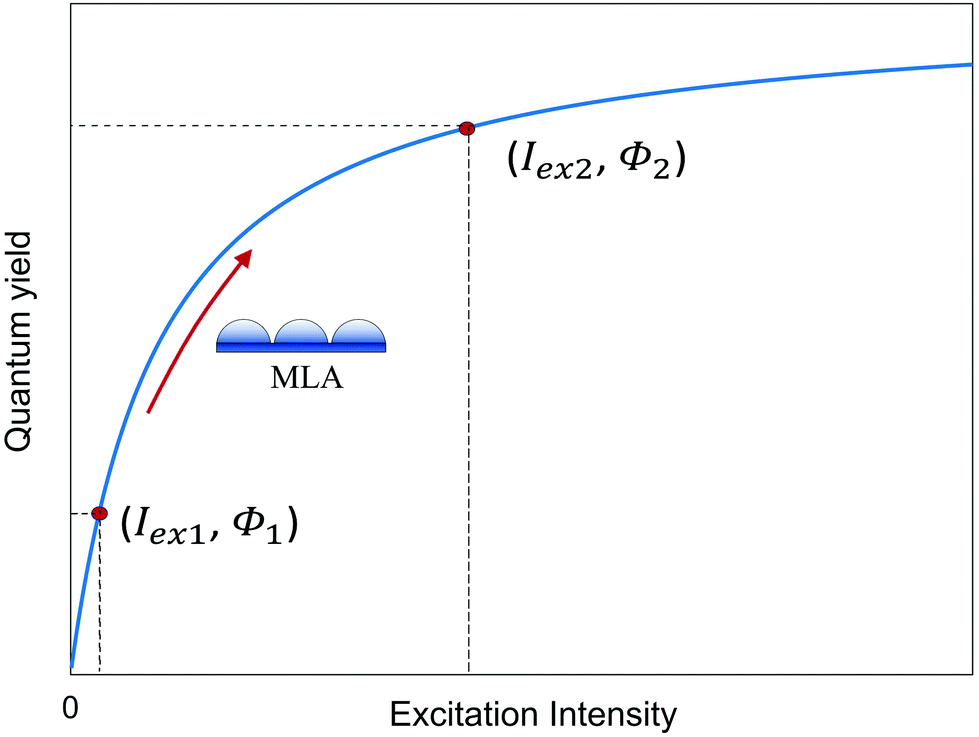
The MLA used in the experiments was made of polycarbonate (PC). The PC material has high transparency in the NIR range, up to 95% (Fig. S3†). Therefore, there is less than 5% energy loss through the MLA structure. A scanning electron microscope (SEM) and an optical microscope were used to characterize the surface structure and profile of the MLA. As shown in Fig. 2(a), the side-view SEM image illustrates a well-defined MLA with a period of 51.02 μm. The height of the microlens is determined to be 16.47 μm and the width is 47.08 μm, with a gap of 3.50 μm between neighboring microlenses. The thickness of the slab part next to the curved layer is 75.00 μm. The top-view SEM image (Fig. 2(b)) and the optical microscopy image (Fig. 2(c)) well illustrate the periodic structure of the MLA.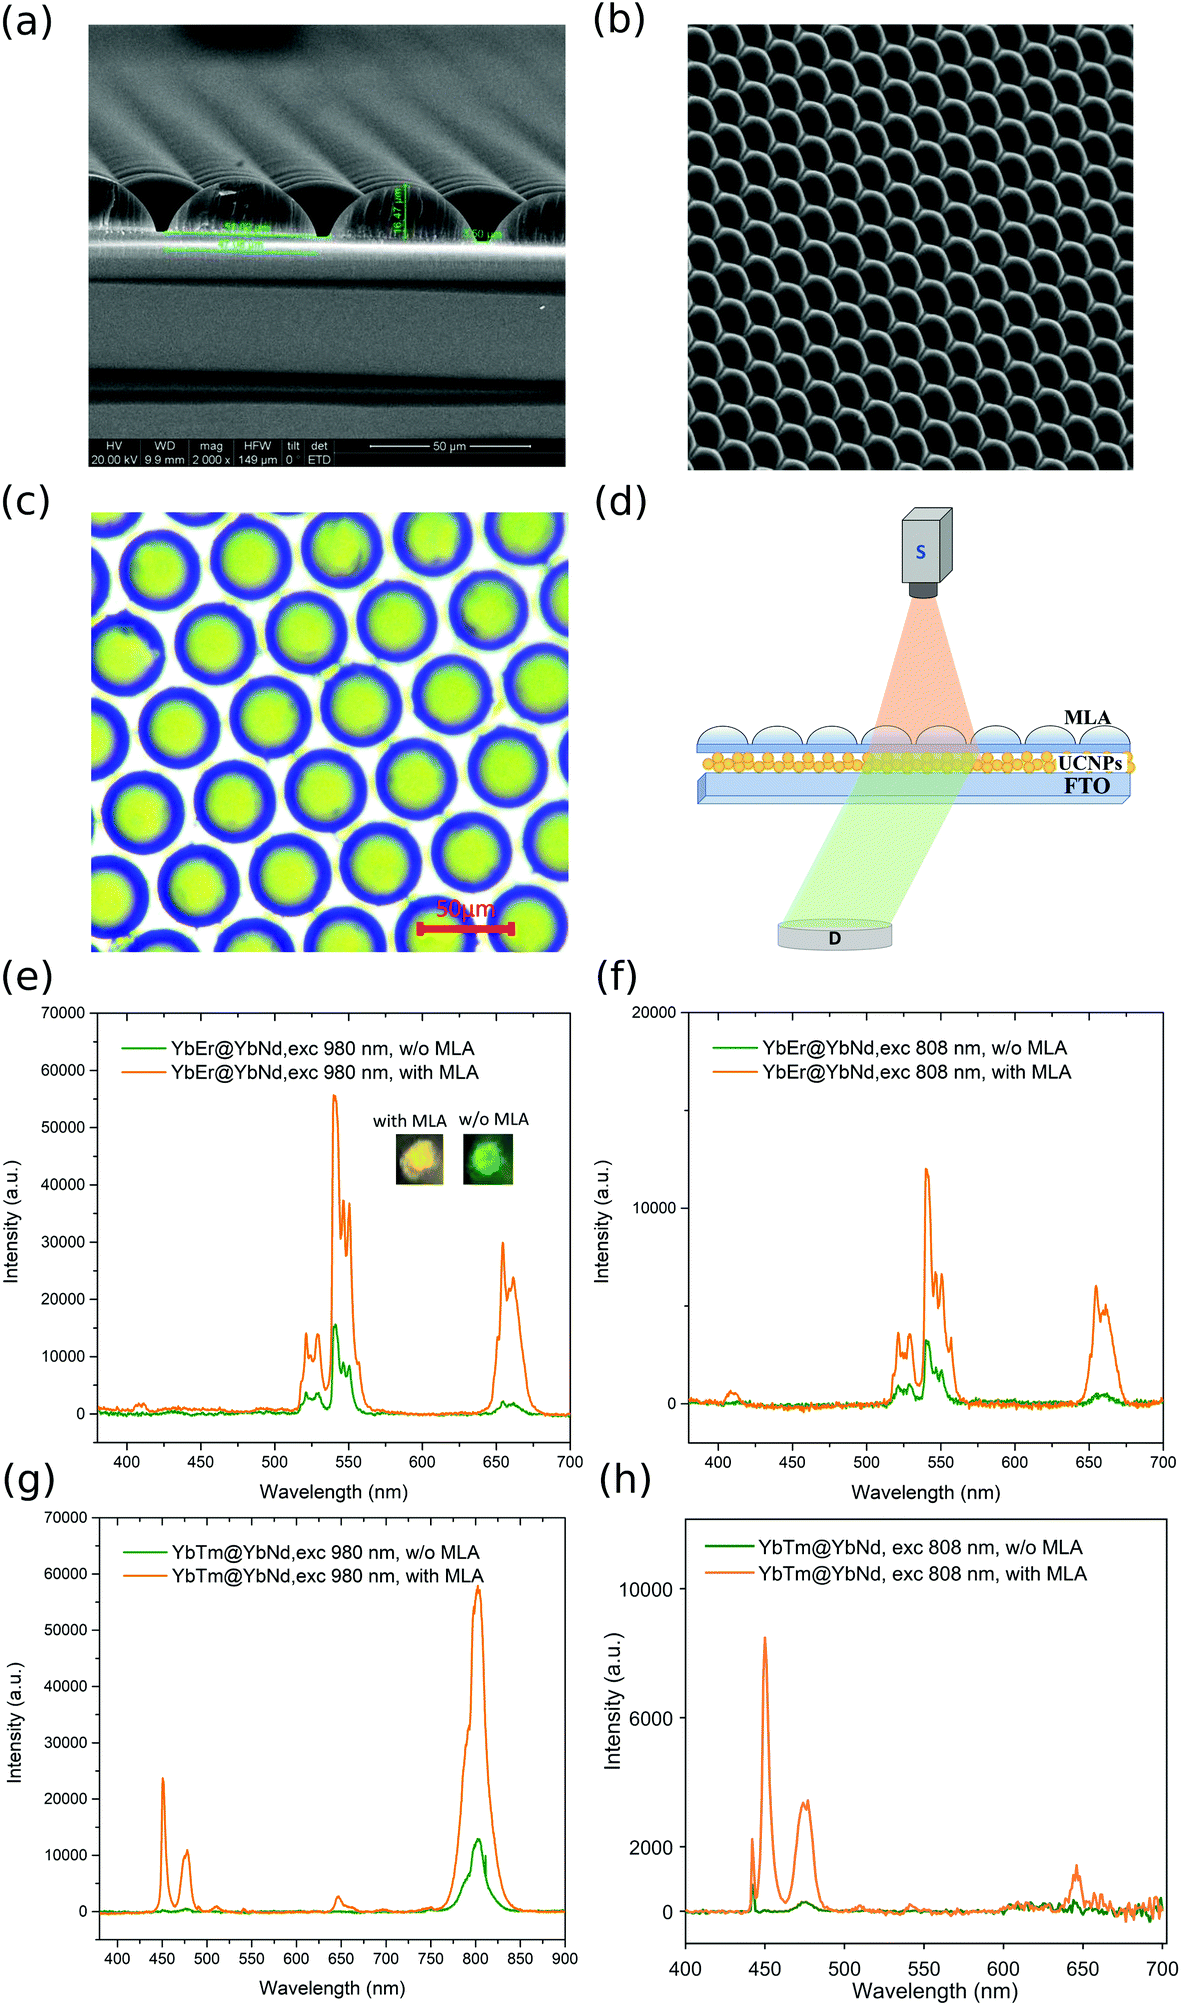 | ||
| Fig. 2 SEM images of (a) the MLA composed of polycarbonate material, side view, and (b) surface structure, top view. (c) Optical microscopy image of the MLA. (d) Schematic of the optical setup for the MLA enhancement effect study: D – detector; S – source. UCL spectra of NaYF4:20%Yb3+,2%Er3+@20%Yb3+,30%Nd3+ nanoparticles under (e) 980 nm and (f) 808 nm CW excitation with and without MLA light modulation (average excitation intensity: 1.3 W cm−2). UCL spectra of NaYF4:20%Yb3+,0.5%Tm3+@20%Yb3+,30%Nd3+ nanoparticles under (g) 980 nm and (h) 808 nm CW excitation with and without MLA light modulation (average excitation intensity: 1.3 W cm−2). | ||
The UCL spectra of the nanoparticle samples were recorded with and without the addition of the MLA into the optical path of the excitation beam (Fig. 2(d)). During the measurements, the MLA was attached to the nanoparticle layer with the help of a thin layer of ethanol solvent in between. Fig. 2(e) presents the result for the YbEr@YbNd nanoparticles under 980 nm excitation. Notably, the intensities of the green (525/540 nm) and red (654 nm) emission bands of Er3+ were enhanced by a factor of ∼3.6 and ∼14.0, respectively, after adding the MLA. The Er3+ blue emission band (409 nm), which was not detectable without the MLA at the applied excitation intensity (1.3 W cm−2), could be well detected after the addition of the MLA to modulate the excitation light. After adding the MLA there was a noticeable change in the emission color even to the naked eye during the experiments (inset of Fig. 2(e)). The modulation effect of the MLA when using 808 nm excitation light was also studied. As shown in Fig. 2(f), under 808 nm excitation, the green and red emission bands of Er3+ of YbEr@YbNd nanoparticles were enhanced by a factor of ∼3.7 and ∼16.0, respectively, after adding the MLA. Similar comparative studies were performed on the YbTm@YbNd nanoparticles. After the MLA was added into the optical path of the excitation beam (either 980 or 808 nm), right in front of the nanoparticle layer, the intensities of the different UCL bands of Tm3+ were remarkably enhanced (Fig. 2(g) and (h)). The strongest two-photon UCL band at 800 nm under 980 nm excitation was enhanced by a factor of 4.5 (Fig. 2(g)). The emission bands at 450 nm, 475 nm and 650 nm of Tm3+ became very significant after adding the MLA, with an enhancement factor of 108, 45, and 45, respectively, compared to what was observed without the MLA (Fig. 2(g)). A similar upconversion enhancement effect of the MLA was also observed when using 808 nm excitation (Fig. 2(h)). Particularly, the 450 nm UCL band was amplified by up to 135-fold (Fig. 2(h)) by the addition of the MLA. These results prove the excitation light modulation effect of the MLA. The observed enhancement factors for different UCL bands under excitation of different wavelengths correlate well with the excitation power response of the upconversion materials shown in Fig. S2.† Since the UCL intensity (If) is proportional to the nth power of the excitation intensity (Iex), i.e., If ∝ Inex, the emission enhancement factor would be related to the slope factor n, with a larger n leading to a larger enhancement. The bigger enhancement factors of the red (654 nm) emission band relative to the green (525/540 nm) bands for the YbEr@YbNd nanoparticles under either 980 or 808 nm excitation (Fig. 2(e) and (f)) are consistent with its steeper excitation power dependence compared to the latter (Fig. S2(b) and (c)†). Similarly, for the YbTm@YbNd nanoparticles, the higher-order multiphoton UC emission band with a larger slope factor n (Fig. S2(e) and (f)†) is associated with a bigger emission enhancement factor (Fig. 2(g) and (h)). In addition, the slightly bigger enhancement factors under 808 nm excitation compared to those under 980 nm excitation of different emission bands can also be explained by the corresponding steeper excitation power dependence.
Due to the same reason, UCL bands should show a decreasing enhancement factor with increasing incident excitation intensity, since they would exhibit gradual saturation, featuring an elevated excitation power dependence, as evident in Fig. S2.† We quantified the enhancement factors of different emission bands of the YbEr@YbNd and YbTm@YbNd nanoparticles under 808 nm excitation with different intensities, and the results confirmed our prediction (Fig. 3(a) and (b)). It is worth mentioning that the enhancement factor for the 450 nm band under 808 nm excitation reached ∼225 at a low excitation intensity of 0.2 W cm−2 and dropped to 4.5 at an excitation intensity of 22.3 W cm−2 (Fig. 3(b)). An indication of the excitation intensity-dependent enhancement factor is that the use of MLA would remarkably boost the UCL intensity of UCNPs at excitation levels relevant to natural solar irradiation. We then measured the UC emission spectra of the YbEr@YbNd and YbTm@YbNd nanoparticles at low excitation irradiance (0.1 W cm−2) with and without the addition of the MLA. As shown in Fig. 3(c)–(f), the UCL enhancement is even more prominent than those shown in Fig. 3(a) and (b). Due to the weakness of the UCL without addition of the MLA, we could not quantify concrete enhancement factors for most emission bands.
 | ||
| Fig. 3 Excitation intensity dependent enhancement factors induced by the addition of MLA of different emission bands of (a) NaYF4:20%Yb3+,2%Er3+@20%Yb3+,30%Nd3+ and (b) NaYF4:20%Yb3+,0.5%Tm3+@20%Yb3+,30%Nd3+ nanoparticles under 808 nm CW excitation. UCL spectra of NaYF4:20%Yb3+,2%Er3+@20%Yb3+,30%Nd3+ nanoparticles under (c) 980 nm and (d) 808 nm CW excitation with and without MLA light modulation (average excitation intensity: 0.1 W cm−2). UCL spectra of NaYF4:20%Yb3+,0.5%Tm3+@20%Yb3+,30%Nd3+ nanoparticles under (e) 980 nm and (f) 808 nm CW excitation with and without MLA light modulation (average excitation intensity: 0.1 W cm−2). | ||
Due to the instrument limitation, we could not accurately control the distance between the MLA and the nanoparticle layer. We tried to vary this distance by replacing ethanol with other solvents as the interface medium, with the intention of making use of their different viscosities and surface tensions. The MLA modulation experiment on the YbEr@YbNd nanoparticles under 980 nm excitation was repeated. As shown in Fig. S4,† the UCL was significantly enhanced for all of the tested solvents, including ethanol, water and methanol. With water, the emission was much less enhanced, while without using any solvent, it was difficult to achieve emission enhancement (data not shown).
Ray-tracing simulations of the excitation light modulation effect of the MLA
To better understand the excitation light spatial modulation effect of MLA, ray tracing simulations were performed using Zemax, a commercially available software. Physical dimensions obtained from the SEM characterization, as schematically depicted in Fig. 4(a), and the optical properties of PC were used in the simulations. The simulated excitation beam (at 980 nm), which was collimated with a top-hat intensity distribution before the MLA, had a very small incident angle onto the MLA surface. Fig. 4(b) and (c) present the simulated excitation light intensity distributions before the MLA (plane D1 in Fig. 4(a)) and at the right edge of the MLA (plane D2 in Fig. 4(a)). As can be seen, the incident beam was periodically re-distributed by the units of the MLA, with the transmitted light concentrated at the focus of each unit (within the MLA). A line profile crossing the central row of the MLA at the right edge was extracted and compared with that on the incident plane prior to the MLA, as shown in Fig. 4(d). With the intensity for the incident top-hat beam set to 1.3 W cm−2, the peak intensity of the transmitted light after the very central unit was as high as 153 W cm−2. The excitation light modulation effect of the MLA on the resulting UCL was then estimated. The emission bands at 525/540 nm and 654 nm with the excitation-intensity response shown in Fig. S2(b)† were selected as the bands of interest. The UCL intensities integrated over the illuminated area when a nanoparticle layer was placed on the incidence plane (If,i) and the MLA focusing plane (If,o) were calculated by: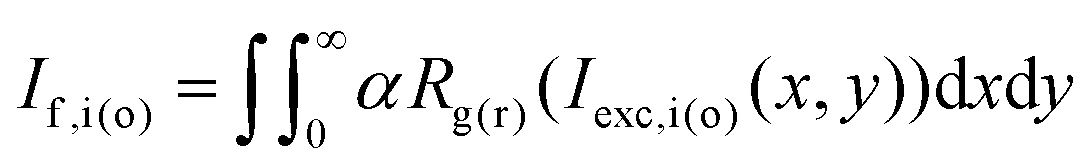 | (2) |
 | ||
| Fig. 4 (a) Geometry used in the ray-tracing simulations. Simulated excitation light intensity distribution (b) before and (c) at the right edge of the MLA. (d) Line profile analyses of excitation light intensity along the selected lines indicated by white lines in (b) and (c). (e) Calculated enhancement factors for upconversion emission bands with different slope factors. | ||
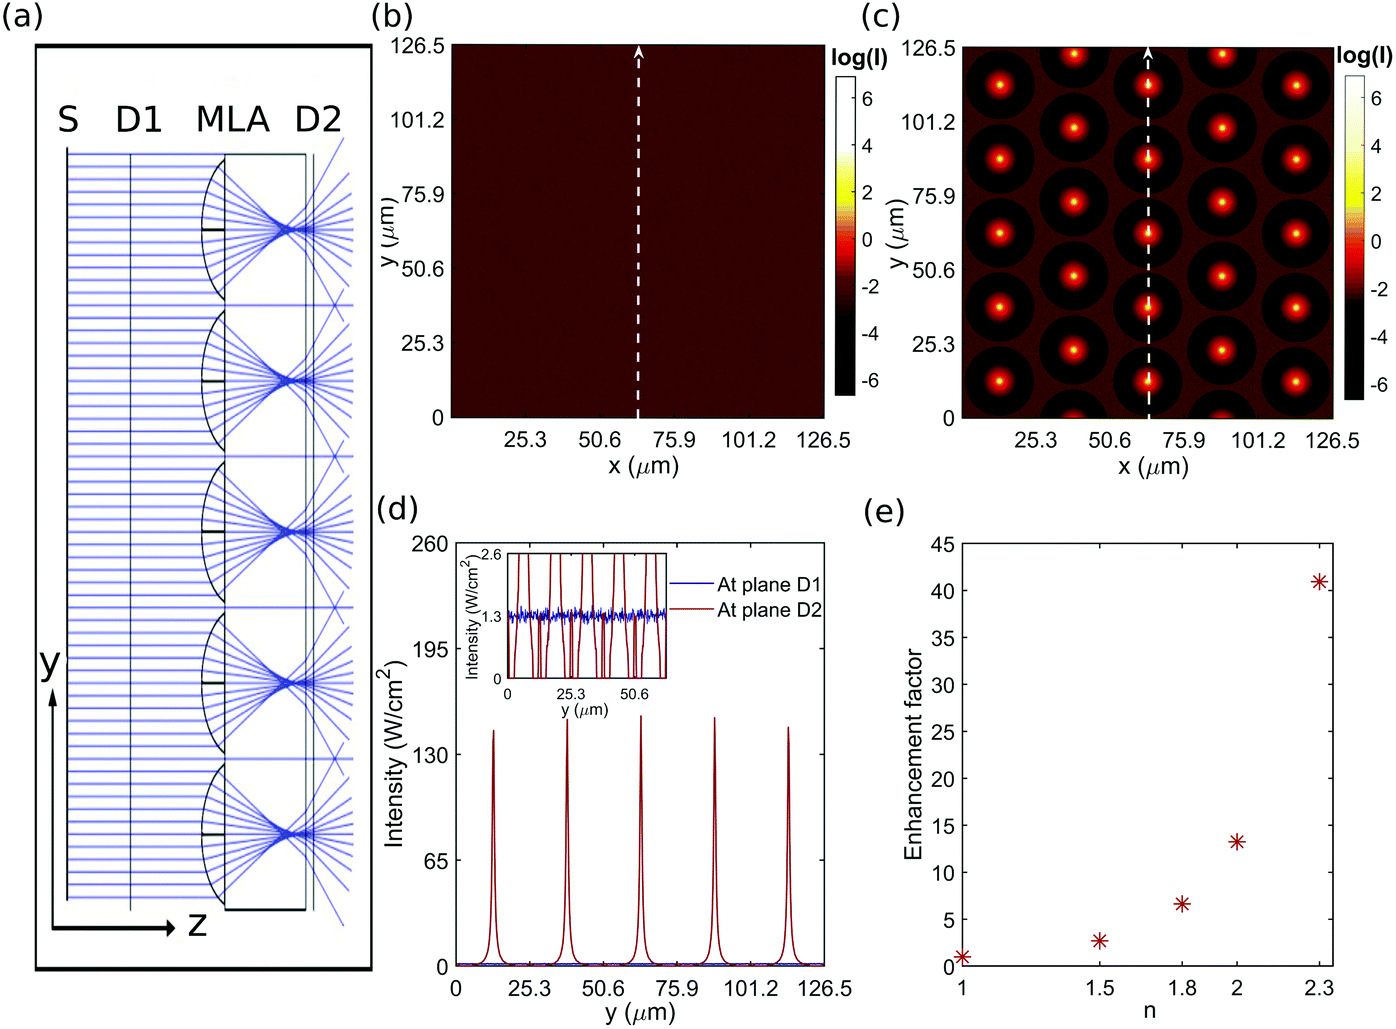
Improved performance of UCNP-enhanced dye-sensitized solar cells by addition of a microlens array
To investigate the influence of the addition of MLA on UCNP-enhanced dye-sensitized solar cells (DSSCs), four DSSCs were prepared, one reference cell (without UCNPs), the second and third incorporated with UCNPs or MLA respectively, and the fourth incorporated with both UCNPs and MLA. The device layout is shown in Fig. 5a. The prepared four cells were tested under direct AM1.5 G simulated sunlight irradiation (0.1 W cm−2). As shown in Fig. 5b, the control DSSC shows a short-circuit current density (Jsc) of 13.20 mA cm−2, VOC = 0.698 V, FF = 58.19 and η = 5.36%. With the addition of UCNPs onto the photoanode, a Jsc of 13.50 mA cm−2 and a η of 5.53% were achieved, featuring a 3.17% efficiency enhancement over the control cell. By adding a piece of MLA onto the photoanode, a Jsc of 13.94 mA cm−2 and a η of 5.75% were achieved, featuring a 7.28% efficiency enhancement over the control cell. After the incorporation of both UCNPs and the MLA into the device, Jsc and η were increased to 14.15 mA cm−2 and 5.87%, respectively, yielding a 6.15% overall efficiency enhancement over the solely UCNP-enhanced cell. Previously, MLAs have been employed to enhance the performance of solar cells, and it has been reported that MLAs are able to prolong the optical path of excitation light and enlarge the light collection angle of solar cells, as well as to concentrate light to facilitate the excitation process.25–29 In our case, the light concentrating effect should be dominant, considering the nonlinear response of UCNPs to excitation light intensity (Fig. S2†). | ||
| Fig. 5 (a) Schematic illustration of the configuration of UCNP- and/or MLA-enhanced DSSC. S – source (b) the current density–voltage (J–V) characteristics of DSSC, DSSC + UCNP, DSSC + MLA and DSSC + UCNP + MLA under AM1.5 G light irradiation (0.1 W cm−2). | ||
Conclusions
Lanthanide photon upconversion nanoparticles (UCNPs) generally exhibit a nonlinear response to excitation light, featuring a higher quantum efficiency at a higher excitation intensity. Thus, effective excitation light concentrators, whenever feasible, are preferred, to make better use of the photon-upconverting capacity of UCNPs. Here, we explored polymer microlens arrays (MLAs) as light concentrators for irradiating UCNPs and investigated their spatial light modulation effect on the resulting upconversion luminescence (UCL). It was found that a piece of MLA can potentially concentrate excitation light by orders of magnitude, subject to its structure and optical properties, and lead to a very significant enhancement of the UCL. MLAs can be easily incorporated into different types of UCNP-enhanced photonic devices, such as dye-sensitized solar cells, and bring further performance improvement in the near infrared range. A test on a dye-sensitized solar cell proved this contention, however, there is much room for optimizing a variety of parameters both for the solar cells and for the light concentrating upconverting layers to make the combined effects even more significant.Conflicts of interest
H. Å., H. L. and Q. L. have a patent application related to this work.Acknowledgements
H. L. acknowledges a Starting Grant (2016-03804) from the Swedish Research Council (Vetenskapsrådet) and a grant from the ÅForsk Foundation (19-424). G. C. acknowledges the grants from the National Natural Science Foundation of China (51672061) and the Fundamental Research Funds for the Central Universities, China (HIT. BRETIV.201503 and AUGA5710052614). H. Å. acknowledges a grant (2016-03619) from the Swedish Research Council (Vetenskapsrådet). Prof. Ying Yan at Soochow University is acknowledged for valuable discussions.References
- C. Yuan, G. Chen, L. Li, J. A. Damasco, Z. Ning, H. Xing, T. Zhang, L. Sun, H. Zeng, A. N. Cartwright, P. N. Prasad and H. Ågren, ACS Appl. Mater. Interfaces, 2014, 6, 18018–18025 CrossRef CAS.
- C. Yuan, G. Chen, P. N. Prasad, T. Y. Ohulchanskyy, Z. Ning, H. Tian, L. Sun and H. Ågren, J. Mater. Chem., 2012, 22, 16709–16713 RSC.
- C. Fei Guo, T. Sun, F. Cao, Q. Liu and Z. Ren, Light: Sci. Appl., 2014, 3, e161 CrossRef.
- C. Xie, P. You, Z. Liu, L. Li and F. Yan, Light: Sci. Appl., 2017, 6, e17023 CrossRef.
- S. Hao, Y. Shang, D. Li, H. Ågren, C.-H. Yang and G. Chen, Nanoscale, 2017, 9, 6711–6715 RSC.
- H. Liu, K. Huang, R. R. Valiev, Q. Zhan, Y. Zhang and H. Ågren, Laser Photonics Rev., 2017, 12, 1700144 CrossRef.
- G. Chen, H. Ågren, T. Y. Ohulchanskyy and P. N. Prasad, Chem. Soc. Rev., 2015, 44, 1680–1713 RSC.
- M. K. G. Jayakumar, N. M. Idris and Y. Zhang, Proc. Natl. Acad. Sci. U. S. A., 2012, 109, 8483–8488 CrossRef CAS.
- K.-C. Liu, Z.-Y. Zhang, C.-X. Shan, Z.-Q. Feng, J.-S. Li, C.-L. Song, Y.-N. Bao, X.-H. Qi and B. Dong, Light: Sci. Appl., 2016, 5, e16136–e16136 CrossRef CAS.
- F. Wang, S. Wen, H. He, B. Wang, Z. Zhou, O. Shimoni and D. Jin, Light: Sci. Appl., 2018, 7, 18007 CrossRef CAS.
- R. Deng, F. Qin, R. Chen, W. Huang, M. Hong and X. Liu, Nat. Nanotechnol., 2015, 10, 237–242 CrossRef CAS.
- W.-P. Qin, Z.-Y. Liu, C.-N. Sin, C.-F. Wu, G.-S. Qin, Z. Chen and K.-Z. Zheng, Light: Sci. Appl., 2014, 3, e193–e193 CrossRef CAS.
- B. Zhou, B. Shi, D. Jin and X. Liu, Nat. Nanotechnol., 2015, 10, 924–936 CrossRef CAS.
- G. Chen, J. Damasco, H. Qiu, W. Shao, T. Y. Ohulchanskyy, R. R. Valiev, X. Wu, G. Han, Y. Wang, C. Yang, H. Ågren and P. N. Prasad, Nano Lett., 2015, 15, 7400–7407 CrossRef CAS.
- H. Liu, C. T. Xu, D. Lindgren, H. Xie, D. Thomas, C. Gundlach and S. Andersson-Engels, Nanoscale, 2013, 5, 4770–4775 RSC.
- J. He, W. Zheng, F. Ligmajer, C.-F. Chan, Z. Bao, K.-L. Wong, X. Chen, J. Hao, J. Dai, S.-F. Yu and D. Y. Lei, Light: Sci. Appl., 2017, 6, e16217–e16217 CrossRef CAS.
- H. Liu, C. T. Xu, G. Dumlupinar, O. B. Jensen, P. E. Andersen and S. Andersson-Engels, Nanoscale, 2013, 5, 10034–10040 RSC.
- A. Bansal, H. Liu, M. K. G. Jayakumar, S. Andersson-Engels and Y. Zhang, Small, 2016, 12, 1732–1743 CrossRef CAS.
- Z. Li and Y. Zhang, Nanotechnology, 2008, 19, 345606–345606 CrossRef.
- H. S. Qian and Y. Zhang, Langmuir, 2008, 24, 12123–12125 CrossRef CAS.
- J. Zhang, Z. Hao, J. Li, X. Zhang, Y. Luo and G. Pan, Light: Sci. Appl., 2015, 4, e239–e239 CrossRef CAS.
- J. Shen, G. Chen, A. M. Vu, W. Fan, O. S. Bilsel, C. C. Chang and G. Han, Adv. Opt. Mater., 2013, 1, 644–650 CrossRef.
- G. Chen, H. Liu, H. Liang, G. Somesfalean and Z. Zhang, Solid State Commun., 2008, 148, 96–100 CrossRef CAS.
- Q. Zhan, H. Liu, B. Wang, Q. Wu, R. Pu, C. Zhou, B. Huang, X. Peng, H. Ågren and S. He, Nat. Commun., 2017, 8, 1058–1058 CrossRef PubMed.
- Y. Chen, M. Elshobaki, Z. Ye, J. M. Park, M. A. Noack, K. M. Ho and S. Chaudhary, Phys. Chem. Chem. Phys., 2013, 15, 4297–4302 RSC.
- M. Nam, K. Kim, J. Lee, K.-K. Lee and S. S. Yang, Solar Energy, 2013, 91, 374–380 CrossRef CAS.
- A. Peer, R. Biswas, J. M. Park, R. Shinar and J. Shinar, Opt. Express, 2017, 25, 10704–10709 CrossRef CAS.
- M. Schmid and P. Manley, J. Photonics Energy, 2014, 5, 057003 CrossRef.
- J. K. Tseng, Y. J. Chen, C. T. Pan, T. T. Wu and M. H. Chung, Solar Energy, 2011, 85, 2167–2178 CrossRef CAS.
Footnote |
| † Electronic supplementary information (ESI) available. See DOI: 10.1039/c9nr03105g |
| This journal is © The Royal Society of Chemistry 2019 |