DOI:
10.1039/C8NR08782B
(Paper)
Nanoscale, 2019,
11, 3979-3992
Multi-scale approach for modeling stability, aggregation, and network formation of nanoparticles suspended in aqueous solutions†
Received
31st October 2018
, Accepted 16th January 2019
First published on 15th February 2019
Abstract
Suspensions of nanoparticles (NPs) in aqueous solutions hold promise in many research fields, including energy applications, water desalination, and nanomedicine. The ability to tune NP interactions, and thereby to modulate the NP self-assembly process, holds the key to rationally synthesize NP suspensions. However, traditional models obtained by coupling the DLVO (Derjaguin, Landau, Verwey, and Overbeek) theory of NP interactions, or suitable modifications of it, with the kinetic theory of colloidal aggregation are inadequate to precisely model NP self-assembly because they neglect hydration forces and discrete-size effects predominant at the nanoscale. By synergistically blending molecular dynamics and stochastic dynamics simulations with continuum theories, we develop a multi-scale (MS) model, which is able to accurately predict suspension stability, timescales for NP aggregation, and macroscopic properties (e.g., the thermal conductivity) of bare and surfactant-coated NP suspensions, in good agreement with the experimental data. Our results enable the formulation of design rules for engineering NP aqueous suspensions in a wide range of applications.
Introduction
In the last few decades, dispersions of nanosized colloids have received considerable attention in a large variety of engineering applications. Indeed, the addition of nanoparticles (NPs) to base fluids has demonstrated excellent promise by extending the technological frontiers in water treatment,1,2 drug delivery,3,4 nanomedicine,5,6 energy storage,7 and heat transfer.8–13 Nevertheless, numerous experimental and theoretical challenges associated with coupling the macroscopic properties, like thermal conductivity and viscosity, with the nanoscale input parameters of nanoparticle suspensions (nano-suspensions), such as NP size, particle volume fraction, and particle surface chemistry, limit their rational design aimed at specific applications.14 In this paper, we present a multi-scale model which is able to predict the dynamic behavior of NPs dispersed in aqueous solutions, thereby bringing us closer to delineating guidelines for modulating the stability and aggregation of nano-suspensions.
Preventing or modulating the aggregation (or self-assembly) of NPs dispersed in fluids has been a primary focus to ensure the stability of nano-suspensions in chemical, energy, and biomedical applications.3,15 On the other hand, the self- or driven-aggregation of nanoparticles into mesoscopic structures has allowed the exploration of advanced materials with tailored optical, electronic, thermal, and magnetic properties.16,17 For example, a multi-step growth of gold and silver nanoparticles from supersaturated aqueous suspensions has led to promising progress in catalysis and structural biology.18 Further, tuning the shape and size of gold colloidal nanocrystals, in combination with the adjustment of surfactant concentration, allowed the formation of supercrystals for molecular transport, sensing, and catalysis.19 Moreover, the self-assembly of polydisperse silica nanoparticles in aqueous dispersions has been utilized to yield coexisting crystals with different structures and functionalities.20 Finally, the generation of nanoparticle-chain morphologies in more dilute suspensions has demonstrated an enhancement of the overall thermophysical properties, thereby encouraging the use of nano-suspensions in the energy field.12,21 Nevertheless, with respect to both improving the stability and promoting self-assembly, the role of nanoparticle interactions is salient in terms of altering the aggregation process, and thereby, the overall macroscopic properties of the assembled meso-structures and dispersions.22,23 Experimental efforts on the targeted design of nano-suspensions have been largely lacking in the absence of a deeper understanding of the influence of NP surface chemistry on the stability of NP suspensions.24 In addition, the lack of a comprehensive model has impeded the tailored use of nano-suspensions. Therefore, from a modeling standpoint, both the inter–NP interactions and the dynamics of the dispersed NPs need to be carefully considered to ensure a reliable prediction of the topology of the assembled nanostructures, and the resulting macroscopic properties. In classical colloid science, the Derjaguin, Landau, Verwey, and Overbeek (DLVO) theory25,26 is a useful modeling approach to theoretically predict the interaction energy between particles suspended in solution. Although the classical DLVO and some adaptations of it, like the charge renormalization theory,33 are considered adequate to describe colloidal interactions in the long range regime, the neglect of hydration effects,27 solvent polarization,28 NP surface phenomena,29,30,32 and the finite size of ions,34 lead to incorrect predictions of the interaction energy when the surface–surface particle distance goes below two nanometers.43 For these reasons, computational strategies should be adopted to develop a deeper fundamental understanding of the inter–particle potential and related NP aggregation. Concerning the dynamics of dispersed NPs, a variety of simulation techniques have been utilized to study the aggregation of colloids.35,36 Monte Carlo (MC) simulations are primarily used to model the kinetics of aggregation in both the Diffusion-Limited Cluster Aggregation (DLCA) and the Reaction-Limited Cluster Aggregation (RLCA) regimes.37,38 However, in these approaches, the particle dynamics is always affected by the sticking probability, neglecting the detachment and rearrangement of aggregates due to thermal motion. Moreover, they often rely on traditional continuum theories, such as the DLVO theory, to evaluate the collision frequency function. With the above background in mind, the availability of a predictive multi-scale model would allow us to uncover the critical links between nanoscale and mesoscale phenomena, and to facilitate the controlled engineering of nano-suspensions.
In this paper, we present a novel multi-scale model to describe the aggregation, self-assembly, and network formation of nanoparticles in aqueous solutions. Specifically, we introduce a modeling tool where molecular dynamics (MD) and stochastic dynamics (SD) simulations are synergistically combined to predict the timescale of NP aggregation, the nano-suspension stability, and the overall macroscopic properties. The proposed multi-scale model is developed in three stages. Firstly, MD simulations are utilized to describe interfacial phenomena occurring at the nanoparticle–solution interface. In particular, bare and surfactant-coated alumina NPs are modeled to investigate surfactant adsorption mechanisms and hydration effects at the NP–water interface. Secondly, the potentials of mean force (PMF) obtained from atomistic simulations are evaluated to account for the nonadditivity of atomistic interactions, including hydrophobic phenomena, hydrogen bonding, capillary action, and other forces that may contribute to the self-organization of the NPs in aqueous solutions.23,39 Although some papers have explored, through MD simulations, the morphology and structure of surfactants at the solid–liquid interface,41 few studies have elucidated the role of interfacial phenomena on the interaction mechanisms between both bare and coated nanoparticles.29,40 Thirdly, to significantly speed-up the simulations, each nanoparticle, either bare or coated, is mapped to one bead, and the calculated PMFs are used as coarse grained (CG) two-bead potentials to carry out SD simulations of dispersed NPs. Although using a many-body potential would certainly be more accurate, such a potential would risk being environment-dependent and would need to be parametrized based on the NP concentration. This pose limitations on the transferability of such a many-body potential to model a broad spectrum of NP suspensions. Further, a detailed cluster analysis has clarified the effect of NP aggregation in the evaluation of thermophysical properties of the suspensions, such as, the thermal conductivity.
In the present study we utilize the described multi-scale approach to model four distinct alumina NP suspensions possessing different degrees of stability, namely, we selected the following suspended NPs: (i) neutral bare nanoparticles (BNPs) of Radius = 2 nm, (ii) sodium dodecyl sulfate (SDS)-coated nanoparticles (CNPs) of Radius = 2.41 nm, (iii) dodecyl trimethyl ammonium bromide (DTAB)-CNPs of Radius = 2.45 nm, and (iv) BNPs of Radius = 0.85 nm with a uniform surface charge of −0.346 C m−2 and [NaCl] = 0.01 M. While samples (i), (ii), and (iii) are thoroughly described in the main text of the paper, the MD simulations corresponding to sample (iv), including the PMF calculation, is detailed in the ESI.† Although we consider specific classes of NPs and coatings, the multi-scale approach developed in this paper can be readily extended to other NP suspensions, providing a modeling tool to formulate guidelines for the rational design of nanoparticle suspensions.
Methods
Molecular dynamics simulations of neutral bare nanoparticles
The procedure to generate the atomic coordinates of a single spherical alumina BNP having radius of 2 nm is described in the ESI.† Briefly, the alumina unit cell was first replicated along the three Cartesian axes, and a spherical particle of desired radius was then created by omitting all the atoms external to a sphere of the chosen radius. The surface chemistry of the BNP was then altered to simulate suspensions at different pH values. Specifically, one neutral NP and one charged NP were considered. For the neutral BNP of 2 nm radius, the alumina atoms were modeled as uncharged Lennard–Jones (LJ) spheres with bonded and nonbonded parameters taken from the CLAYFF force field.54 Note that in simulating nanoparticles which interact through a LJ potential we seek to reproduce the extreme condition of a suspension existing at the isoelectric point (IEP), whose pH is equal to 9.1 for alumina in aqueous solution.21 On the other hand, for the charged BNP, we altered the surface chemistry by adding hydroxyl groups and modifying the surface partial charges (see the ESI† for further details).
To investigate the interactions between two uncharged BNPs, the PMF was calculated at various center of mass (com) separation distances (D), from 3.9 nm to 5 nm. Specifically, 21 configurations were initialized by translating one BNP along the z axis with increments of 0.05 nm. This broad window allowed us to analyse the complete spectrum of interaction forces, from the highly-repulsive regime (D = 3.9 nm) to the weak-potential regime (D = 5 nm), where the average force between the NPs is close to zero, as illustrated in the ESI.† In each of the 21 configurations, the two alumina NPs were centered in a box of 12 × 12 × 30 nm3, and their positions were restrained by freezing the alumina atoms. MD simulations were carried out using GROMACS 5.1.4.55 Lennard–Jones interactions were treated with a cut-off distance of 1.3 nm, and the standard geometric-mean mixing rule was implemented for unlike atoms. Molecular dynamics simulations were first performed in vacuum: after minimizing the energy of the system, the MD simulations were carried out for 100 ps in the Canonical NVT ensemble, where a V-rescale thermostat59 was applied to equilibrate the temperature at 300 K, with τt = 0.1 ps as the time constant. Water molecules, represented by the SPC/E model,56 were then added to each simulation box. The bond lengths and angles in the water molecules were constrained using the SETTLE algorithm,57 and the Particle-Mesh Ewald (PME) summation method was used to compute long-range electrostatic interactions in Fourier (reciprocal) space,58 while the Coulomb interactions in real space were modeled with a cut-off of 1.3 nm. The energy of the solvated system was first minimized and the resulting ensemble was equilibrated in two separate stages: (i) 300 ps of isochoric–isothermal (NVT) equilibration at 300 K using the V-rescale thermostat,59 with τt = 0.1 ps, and (ii) 200 ps of isothermal–isobaric (NPT) equilibration at 1 bar, using the Berendsen barostat60 with τp = 2 ps. Subsequently, simulations were carried out, for 1.5 ns, in the NPT ensemble with a Nosé–Hoover thermostat61 (T = 300 K and τt = 0.2 ps), and a Parrinello–Rahman barostat62 with a τp = 2 ps time constant. The mean forces, F(z), were calculated in each setup by analysing the last 1 ns of the trajectories. The PMF was finally computed by numerically integrating, according to the trapezoidal scheme, the time-averaged forces exerted to maintain the two BNPs at various D values. Specifically,
| |  | (1) |
where
z is the reaction coordinate, and
Dend is the com distance where PMF(
Dend) is equal to zero. It is worth noticing that the PMFs calculated in this content are not corrected by the entropic effect due to the rotation of the NPs because of the solvent (2
kBT![[thin space (1/6-em)]](https://www.rsc.org/images/entities/char_2009.gif)
ln(
z)).
55 In fact, such term is implicitly included in the stochastic dynamics simulations where the PMFs are used.
63 The errors in the simulated PMF profile were estimated based on the errors in the forces obtained using the block-averaging method, while accounting for the integration process.
64 The PMF in vacuum was also evaluated in the case of vibrating BNPs, and a comparison with frozen BNPs is presented in the ESI.
†
Molecular dynamics simulations of surfactant coated nanoparticles
In order to simulate the self-assembly of surfactants on alumina NPs in aqueous solution, two separate simulation boxes of 10 × 10 × 10 nm3 were considered, one for SDS and the other for DTAB CNPs. In the former case, 84 molecules of SDS were randomly arranged within 5 nm from the center of mass of a single BNP, having a radius of 2 nm and centered in the box. In the latter case, 100 molecules of DTAB were used to model the adsorption process on a second alumina particle of the same size. The number of surfactant molecules was initially estimated based on the ratio between alumina BNP surface and the surface area of the tails.65 However, because of the strong adhesion and packaged configuration of surfactants with themselves, the initial number of SDS and DTAB molecules was then adjusted and increased up to 84 and 100 molecules respectively to completely cover the bare NP surface and get isotropic CNPs. Such procedure has avoided the formation of patchy CNPs, thereby assuring the equivalent angular position of the CNPs when computing the PMF. The same simulation protocol was used for the two boxes. In particular, Packmol package66 was used to setup the surfactant molecules in the vicinity of the BNP as previously described, and the GROMACS 5.1.4 package55 was utilized to carry out the MD simulations. The OPLS-AA force field67 was used to model the surfactant molecules. The alumina NPs were described as particles interacting with a LJ potential in order to reduce the computational expense associated with the PMF calculations. The total energies of the SDS and the DTAB CNPs were first minimized in vacuum, and subsequently, SPC/E56 water molecules were added to fill the two boxes. The SDS and the DTAB molecules were assumed to completely dissociate in water. Therefore, Na+ and Br− counterions were added to the SDS and the DTAB boxes, respectively, to fully neutralize the two systems. A second step of energy minimization was subsequently carried out on the two solvated systems. The equilibration of the entire setups was reached by adding to the protocol described for the BNP case an additional equilibration run of 4 ns in the NPT ensemble, coupling the temperature to a Nosé–Hoover thermostat,61 and coupling the pressure to a Parrinello–Rahman barostat.62 During the three equilibration stages, the surfactant molecules were restrained at their initial configurations using a harmonic potential (with a force constant of 1000 kJ mol−1 nm−2), and the alumina particle was frozen. The restraints were then removed to simulate the self-assembly process of the surfactant molecules on the NPs, which was carried out for 45 ns at 300 K and 1 bar. The temperature and the pressure were maintained constant under the isothermal–isobaric ensemble (NPT), implementing a Parrinello–Rahman barostat62 with τp = 2 ps, and a Nosé–Hoover thermostat with τt = 0.2 ps.61 Periodic boundary conditions were applied in all three directions, and the parallel version of the LINCS algorithm68 was used to constrain the H-bonds on the surfactant carbon atoms. Lennard–Jones and Coulomb interactions were cut-off at 1.3 nm, and the Particle-Mesh Ewald (PME) summation method was used to compute long-range electrostatic interactions. It is worth noting that both the nature of the solvent and the surface chemistry of the NP play a crucial role in the adsorption process, clearly altering the orientation of the surfactant molecules at the interface. In our specific case, for example, the absence of hydroxyl groups on the alumina surface promotes a preferential organization, where the surfactant hydrophobic tails reside on the solid surface and the surfactant hydrophilic charged heads point towards the water phase. The resulting configurations of both SDS and DTAB CNPs were then used to compute the PMFs between two identically CNPs at various center of mass separation distances (D), from 4.9 nm to 8 nm. 31 configurations were created by translating one CNP along the z axis with an increment of 0.1 nm. In each of the 31 configurations, the pair of CNPs was centered in a box of 12 × 12 × 30 nm3, and their centers of mass were fixed by freezing the alumina core atoms. To be consistent with the self-assembly MD simulations, the same water model and force fields were used for the PMF calculations. Moreover, a similar protocol was followed to equilibrate the system at 300 K and 1 bar. As before, the restraints on the surfactant molecules were removed after the equilibration process. The actual MD simulations were carried out in the NPT ensemble using a Nosé–Hoover thermostat61 with a 0.2 ps time constant, and a Parrinello–Rahman barostat62 with a 7 ps time constant. 10 ns of trajectories, including 4 ns of equilibration and 6 ns of actual production run, were obtained for each separation distance D, and the mean forces were calculated by analysing the last 4 ns (see the convergence of PMF calculation in the ESI†). To visualize the configurations of CNPs at the last time step, Fig. 2(b) and (c) illustrate two reciprocal positions of nanoparticles for both SDS and DTAB coatings, respectively. Similar to the PMF between two BNPs, the PMFs of surfactant-coated NPs were evaluated by numerically integrating the D-dependent interaction forces (eqn (1)). The standard deviations were estimated using the block-averaging method on the force errors while accounting for the integration process.64
Calculations of the classical DLVO-based potentials
The classical DLVO theory assumes that the interaction energy, U, between two spherical particles of radius R can be well approximated by two additive contributions, namely U(D) = UvdW(D) + UEDL(D), which refer to van der Waals (vdW) and the Electric Double Layer (EDL) interactions, respectively. Because of the small size of the NPs and because of the zero surface charge of the BNP, the DLVO theory corresponding to two interacting BNPs was computed by utilizing the following expression of non-retarded van der Waals contribution:43| |  | (2) |
where H, the Hamaker constant for alumina in water, is equal to 31.6 kJ mol−1,43 and D is the center-to-center separation distance. However, in the case of CNPs, the vdW interactions were modified by the presence of the surfactant adsorbed layers, and an appropriate modification of the UvdW expression was considered. Specifically, the non-retarded van der Waals potential is given by the approximate expression:43| | 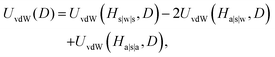 | (3) |
where the various UvdW(D) expressions were computed using eqn (2), and Hs|w|s, Ha|s|w, and Ha|s|a are the Hamaker constants corresponding to two interacting infinite planar surfaces separated by a distance D, across a specific medium. In particular, alumina (a), surfactants (s), and water (w) were considered for the calculation, and the corresponding values of the Hamaker constants are reported in Table 1.
Table 1 Hamaker constant for media 1 and 3 interacting across medium 2 (H1|2|3) at room temperature.43 The Hamaker constant of dodecane is used to approximate those of the SDS and the DTAB coatings
| 1 |
2 |
3 |
H
1|2|3 [kJ mol−1] |
| α-Al2O3 (a) |
Water (w) |
α-Al2O3 (a) |
31.6 |
| Dodecane (s) |
Water (w) |
Dodecane (s) |
2.65 |
| α-Al2O3 (a) |
Dodecane (s) |
α-Al2O3 (a) |
16.14 |
| α-Al2O3 (a) |
Dodecane (s) |
Water (w) |
6.53 |
Note that, in each case, the NP radius is increased by the thickness of the surfactant layer considered, as reported in ref. 43. The classical DLVO theory, including both van der Waals and electrostatic potentials, was used to theoretically describe the interaction potential energy between two CNPs. Specifically, in addition to eqn (3), we applied the following expression to evaluate the Electric Double Layer (EDL) potential energy between two identical spheres:69
| | 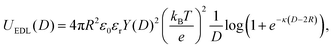 | (4) |
where
kB is the Boltzmann constant,
T is the absolute temperature,
ε0 and
εr are the dielectric permittivity of vacuum and water, respectively,
e is the electronic charge and
κ is the inverse of the Debye–Hückel screening length, namely
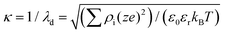
being
ρi and
z the number density of ion species i and its valence, respectively. The function
Y(
D) in
eqn (4) is given by:
69| | 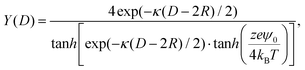 | (5) |
where
ψ0 is the surface potential and is obtained after solving the Grahame equation.
43 All the input parameters used to compute the DLVO potential are provided in the ESI.
† Note that
eqn (4) is expected to be accurate from moderate to high surface potential,
ψ0, for modest to large
κR and for all separation
κ(
D − 2
R), and therefore, it can be used in our analysis (see Table S3 in the ESI
† for the specific values of Debye–Hückel screening length and CNP radius).
A number of improvements to the DLVO theory have been made to overcome the limitations associated with the Poisson–Bolzmann (PB) model,32,34 and to include steric effects of charged species adsorbed at the NP interface.44 An extended body of literature, for example, has been dedicated to the use of the linearized PB theory with renormalized effective electrostatic interaction parameters.33 Extension of the classical DLVO theory have been also formulated to predict the interaction energy between CNPs in aqueous solution.31 Some examples of the modified classical DLVO theory are reported in the ESI.†
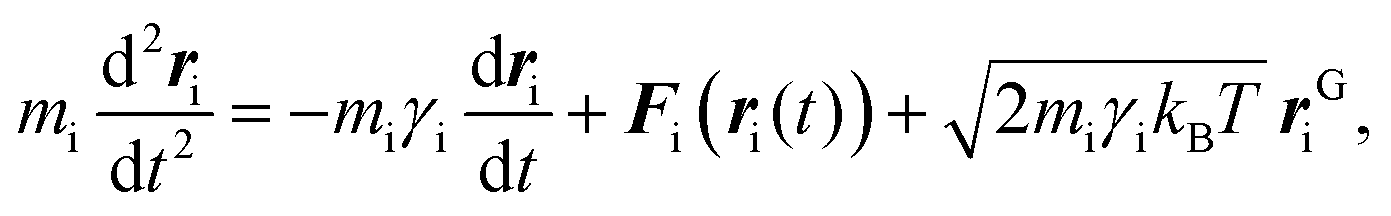
Stochastic dynamics simulations
To implement the effective inter–NP potential using stochastic dynamics simulations, the PMF curves were first fitted to an analytical expression, as reported in the ESI.† Thereafter, the resulting curves were translated into tabular potentials for input in GROMACS.55 To this end, the dynamics of the suspended NPs in aqueous solution was modeled by combining the PMF curves with the Langevin equation,70 namely:| | 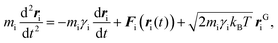 | (6) |
where mi is the mass of NPi, ri is its position at time t, kB is the Boltzmann constant, T is the absolute temperature, rGi is the Gaussian distributed noise, and γi is the friction coefficient associated with the stochastic collisions of the nanoparticle, NPi, with the molecules constituting the solvent.
Based on the range of the inter–particle potential, during the SD simulations, the cut-off radius applied to the force field was fixed at 7 nm and 9 nm for BNP and CNP suspensions, respectively. Each SD simulation started by applying the steepest descent algorithm to minimize the energy of the system, consisting of 2000 randomly distributed NPs. The production run was then carried out in the NVT (T = 300 K) ensemble with an integration time step equal to 0.1 ps. In order to compare the characteristic time scales associated with NP aggregation, we evaluated the formation times of the biggest and longest-lived clusters present in the nano-suspensions considered. First, the size of the biggest NP clusters was monitored and the biggest clusters were identified along the trajectories. Second, to determine if the largest cluster was also the longest-lasting, we indexed the NPs inside the aggregate along the trajectory and we checked if its size remained constant for at least 0.1 ms, which is larger than the average rate of aggregation in the last steps of the dynamics. Finally, the formation times of these selected clusters were classified. Note that this study was carried out starting from t = 0.02 ms, thus neglecting the initial regime where the dynamics are characterized by fast aggregation kinetics. Moreover, for each NP cluster, we considered a fluctuation of ±8% of its original size, because of the thermal motion of single-dispersed NPs which continuously attach and detach from the aggregates.
Thermal conductivity calculations
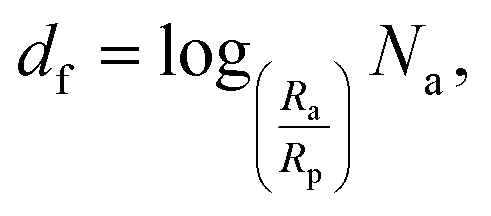
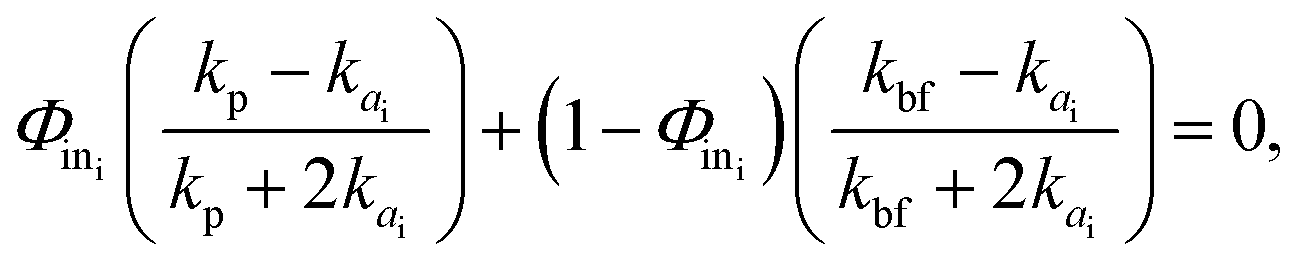
The most widespread strategy to theoretically predict the thermal conductivity of the NP suspensions is based on the Maxwell–Garnett (MG) effective medium theory.71 Although this theory is suitable for low volume fraction, well-dispersed particle suspensions, it yields inaccurate predictions when the particles aggregate. Since the aggregation has been recognized to play a crucial role in the thermal properties of nano-suspensions21,46 the Bruggeman (BG)72 and the Hamilton–Crosser (HC) models73 were also developed to incorporate the formation of clusters in colloidal suspensions. However, their major limitations lie in: (i) the definition of the inter–particle potential (generally based on the classical DLVO theory), and (ii) considering a constant value for the typical fractal dimension parameter describing the shape of the clusters formed.46 Regarding assumption (ii), the identification of a unique fractal dimension parameter is potentially inaccurate.37,74 Indeed, as shown in Fig. S5(a) of the ESI,† clusters having various shapes and sizes can form in a generic suspension, where both compact and more elongated clusters can coexist. Here, based on the above considerations, we adopt a more advanced adaptation of the BG model21 for incorporation of the results from our cluster analysis. Note that the following thermal conductivity calculations were only carried out in the presence of aggregation and hence for nano-suspensions of uncharged BNPs. First, for each nano-suspension with volume fraction Φ, we expressed the concentration of particles inside (in) the aggregates as follows:| |  | (7) |
where Rp is the single-dispersed particle radius, Ra is the cluster radius, and df is the fractal dimension parameter of the cluster, namely:| |  | (8) |
where Na is the number of NPs in each single aggregate. Using the cluster analysis presented above, based on SD simulations, we evaluated Na and Ra, and then computed Φin and df for each cluster in the suspension using eqn (7) and (8), respectively. Subsequently, we utilized the BG model to evaluate the thermal conductivity, kai, of aggregate i as follows:21| | 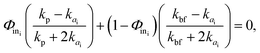 | (9) |
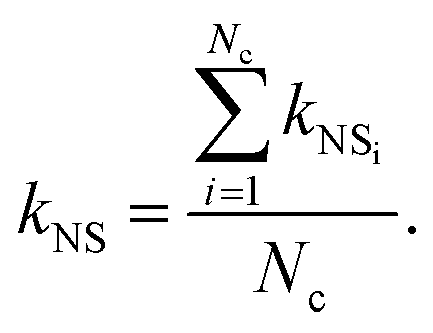
where kbf = 0.6069 W mK−1 is the thermal conductivity of the base fluid (bf), which here is water at 300 K, and kp = 46 W mK−1 is the alumina particle thermal conductivity. Given that Nc is the number of clusters in the selected nano-suspension, we assumed Nc fictitious suspensions, each consisting of identical aggregates and having an aggregate volume fraction equal to Φai = Φ/Φin. The overall thermal conductivity of the ith fictitious nano-suspension, kNSi, was then predicted using the MG model:21| | 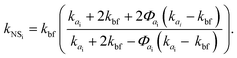 | (10) |
Finally, by averaging the kNSi over the total number of fictitious nano-suspensions, we evaluated the overall thermal conductivity, kNS, as follows:
| |  | (11) |
Results and discussion
Nanoscale interfacial phenomena
Molecular dynamics simulations were carried out to investigate both bare and coated alumina NPs in aqueous solutions. In order to obtain coated nanoparticles (CNPs) in aqueous solutions, extensive all-atom simulations were utilized to model the adsorption of sodium dodecyl sulfate (SDS) and dodecyl trimethyl ammonium bromide (DTAB) on the neutral, bare α-Al2O3 NPs considered above. Equilibrium snapshots of the simulated, final configurations of the bare nanoparticle (BNP) and the CNPs are shown in Fig. 1(a–c), where the water molecules are not shown for clarity. As these figures illustrate, the hydrophobic tails of both SDS and DTAB tend to wrap around the alumina NP in order to minimize their contact with water, while the charged hydrophilic heads project outwards from the alumina surface due to their tendency to be solvated by water. The radial distribution functions (g(r)s) of the SDS and DTAB residues, namely the g(r)s of the center of mass positions of both surfactant tails and heads around the com of an alumina BNP (see Fig. 1(d)), demonstrate the well-ordered distribution of the DS− ions and the DTA+ ions. From the plots of g(r) in Fig. 1(d) one can rigorously identify the thickness of the coating, which is less than 1 nm for the two CNPs. Here, two distinct regions can be noticed: the former corresponding to the first picks closest to the BNP surface, and the latter coinciding with the second picks located at D > 2.5 nm. After a qualitative comparison between the g(r)s in Fig. 1(d) and the snapshots in Fig. 1(b and c), one can intuitively correlate the first and second pick of the g(r)s with the distribution of the surfactant tails and heads respectively. A more quantitative description and validation of the SDS and DTAB conformational structure is provided in the ESI.† However, a minor difference can be noticed between the g(r)s in Fig. 1(d). Specifically, the DTA+ ions present a less confined and packed configuration than that of DS− ions. The slight difference in the distributions of SDS and DTAB (see Fig. 1(d)) was further corroborated by computing, for each CNP, the Lennard–Jones (LJ) interaction energy between the surfactants and the alumina NP. After averaging the resulting LJ interaction energy over the number of adsorbed surfactant molecules, we found an attractive interaction energy of −35.6 ± 3.8 kJ mol−1 and −27.7 ± 3.6 kJ mol−1 per single SDS and DTAB molecule, respectively. In fact, although SDS and DTAB have the same C12 tail length, the sulfur and the oxygen atoms in the SDS head have deeper potential wells (i.e., LJ ε values) than the nitrogen atom and the CH3 groups in the DTAB head, thereby increasing the adhesion of SDS relative to that of DTAB onto the NP surface. Not surprisingly, this result indicates that the surfactant chemical structure plays a key role in altering the extent of surfactant adhesion onto the NP surface, which in turn, determines the atomic configurations of the surfactant coatings. Further analysis was pursued on water layering (hydration effects) in the vicinity of the BNP and CNPs. Specifically, we computed the radial distribution functions (g(r)s) of water around the NP surfaces, and the results are presented in Fig. 1(e). The first density peak in the distribution of water on the BNP surface (green curve in Fig. 1(e)) is greatly lowered around the CNPs (red and blue in Fig. 1(e)), where a hydrophobic-surface-like distribution function of water is observed. However, the charged surfactant heads lead to the formation of a weak layered structure of water, which is more pronounced in the case of the SDS CNPs (red curve in Fig. 1(e)) than in the case of the DTAB CNP (blue curve in Fig. 1(e)). The observed difference between the SDS and the DTAB cases can be understood by calculating the number of hydrogen bonds established between water molecules and the considered surfactant heads. Following Luzar approach,42 we counted roughly 6.8 ± 0.4 hydrogen bonds between a single SDS head and water molecules. On the other hand, the presence of the CH3 groups around the charged nitrogen in the DTAB head prevents the formation of hydrogen bonds with the water molecules, thereby weakening the structured distribution of water at the DTAB CNP–liquid interface.
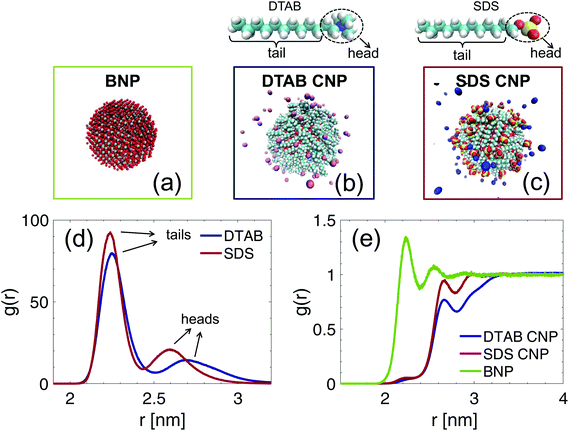 |
| | Fig. 1 Selected configurations of bare (BNP) and surfactant coated nanoparticles (CNPs) in aqueous solutions. Equilibrium molecular dynamics simulation snapshot of: (a) a neutral BNP, (b) a DTAB CNP, and (c) an SDS CNP after 45 ns of surfactant self-assembly simulations. Color code: cyan, carbon atoms; white, hydrogen atoms; red, oxygen atoms; yellow, sulfur atoms; light blue, nitrogen atoms; silver, aluminium atoms. The sodium and bromide counterions are colored in blue and pink, respectively. Water molecules are not shown for clarity. (d) Radial distribution functions (g(r)) of SDS and DTAB residues (com positions of surfactant tails and heads) around the center of mass of an alumina BNP. (e) Radial distribution function (g(r)) of water in the proximity of both bare and coated NPs. Note that the BNP has a radius of 2 nm. | |
Nanoparticle potential of mean force calculations
The equilibrated atomistic configurations of the bare and coated NPs were considered to elucidate the average interaction potential energy between the NPs at the nanoscale. Firstly, the PMF between the uncharged BNPs in water was computed (see the green curve in Fig. 2(d)). To highlight the effect of the solvent on the inter–particle potential, the PMF was also calculated in vacuum (see the black curve in Fig. 2(d)). In both water and vacuum, the alumina NPs exhibit an attractive potential for 4 < D < 4.2 nm, where D is the NP center-to-center separation distance (see Fig. 2(a)). However, the screening effect provided by the water molecules weakens the attractive interaction energy. This is particularly evident around the primary minimum, located at D = 4.05 nm: although no water molecules are expected to be present here, close to the NP–NP contact point (D = 4 nm), the curvature of the NP surface allows water molecules to be located in the 3D gaps directly above and below the contact point. This, in effect, screens the van der Waals attraction between the BNPs leading the PMF in water to be less attractive than in vacuum (compare the green and black curves at the minimum in Fig. 2(d)). When D > 4.2, such screening effect on the PMF competes with the repulsions exerted by the water layers confined between the BNP surfaces. This contribution, referred to as the hydration effect,27,43 is attributed to the structuring of water at the interface. In fact, the first repulsive peak of the PMF in water at D = 4.3 nm corresponds to the first denser region of the radial distribution function of water around the BNP (see the green curve in Fig. 1(e) at r = 2.3 nm). More in general, the PMF profile in water for D > 4.2 nm retraces the oscillatory behavior of the solvent distribution in proximity of the BNP (see the green curve of Fig. 1(e)). Secondly, the PMFs between SDS CNPs and DTAB CNPs in water were computed, and are shown, as a function of D, in Fig. 2(e). To this end, the equilibrated MD configurations resulting from the self-assembly simulations of SDS, or DTAB, on alumina NPs in water were considered as the initial set-up to evaluate the PMFs. For the SDS CNPs, the PMF vs. D profile exhibits a long-range repulsive behavior, extending from 5 nm to 8 nm with a maximum value of around 171.6 kJ mol−1 at D = 5 nm (see the red curve in Fig. 2(e)). For the DTAB CNPs, the PMF vs. D profile also shows a long-range repulsive behavior, overlapping the SDS PMF data for D > 5.2 nm (see Fig. 2(e)). However, some differences are observed between the PMF profiles corresponding to the SDS CNP and the DTAB CNP cases. Firstly, a stronger repulsive potential is felt by the DTAB CNPs for D < 5.2 nm. As discussed above, the DTA+ ions exhibit a weaker adhesive potential than the DS− ions on the alumina NP surface allowing the DTAB heads and portions of the tails to freely fluctuate in the surrounding aqueous solution (see Fig. 2(b)). On the other hand, the DS− ions adopt a more structured morphology upon wrapping the NP surface (see Fig. 2(c)). Therefore, as D decreases, the compression of the fluctuating tails promotes a strong entropic repulsion, which is more pronounced in the case of the DTAB CNPs. Another difference between the PMF curves in Fig. 2(e) is in the extent of hydration repulsion induced by the confined water molecules at the interface. We have already pointed out that the chemical and structural features of the SDS NP coating facilitate interactions with water molecules at the interface, thereby leading to the formation of more hydrogen bonds and an associated denser hydration layer. On the other hand, a more hydrophobic-like-structure is observed in the radial distribution of water around the DTAB NP coating (see Fig. 1(e)). As a result, we can state that the origin of the entropic repulsion between DTAB CNPs is mainly due to fluctuating tails rather than the hydration effects.
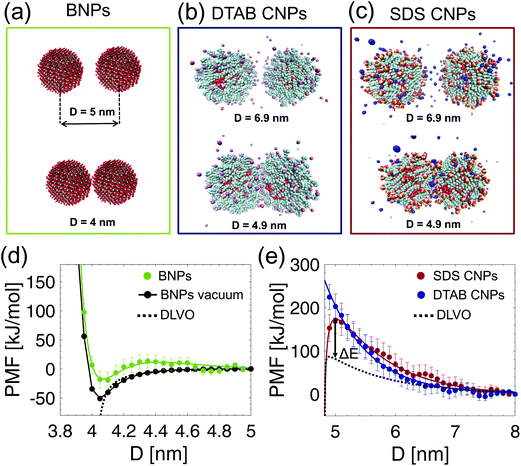 |
| | Fig. 2 Potentials of Mean Force (PMF). (a–c) Representative PMF simulation snapshots in the xz plane obtained by varying D between: (a) two neutral BNPs, (b) two DTAB CNPs, and (c) two SDS CNPs. (d) Simulated PMFs in water (green dots) and in vacuum (black dots) between the BNPs shown in (a). The fitting of the PMF in water (the green curve in (d)) is detailed in the ESI,† and the predicted DLVO interaction potential energy (see eqn (2)) corresponds to the dashed black curve. (e) Simulated PMFs as a function of D for two DTAB CNPs (blue dots) and for two SDS CNPs (red dots). The fitting of the PMF data corresponding to the solid red line (for the SDS CNPs) and to the solid blue line (for the DTAB CNPs) are detailed in the ESI.† The classical DLVO theory prediction (obtained as DLVO = UvdW(D) + UEDL(D) using eqn (3) and (4)) for two SDS CNPs is shown by the dashed black curve. ΔE indicates the difference of the free energy barrier resulting from the DLVO prediction and the MD data. | |
In order to compare our simulation results with theoretical predictions based on the classical DLVO theory, Fig. 2(d) and (e) show the simulated and the predicted PMFs vs. D profiles. Although the Hamaker constant used in the evaluation of the DLVO potential is medium dependent, Fig. 2(d) clearly highlights the inability of the DLVO theory to model the inter–particle interaction in water for D < 4.6 nm. This substantiates the need to carry out atomistic MD simulations to correctly model the inter–particle interactions at the nanoscale. A complete, classical DLVO theory, which includes both attractive van der Waals and repulsive electrostatic interactions is instead considered to theoretically describe the interaction potential energy between charged SDS and charged DTAB CNPs (see the Methods section for additional details). As shown in Fig. 2(e), the simulated PMFs (the red and blue curves) and the classical DLVO theory prediction (the black dashed curve) agree very well for D > 7 nm, where the discrete nature of the aqueous medium, the finite hydrated radii of the sodium and bromide counterions, and the repulsions due to the overlap of surfactant tails can be neglected. On the other hand, the classical DLVO theory prediction significantly deviates from the simulated PMFs when the NP center-to-center separation distance is less than 7 nm (see Fig. 2(e)). Specifically, when D < 7 nm, the combined effect of the DS− and the DTA+ heads, the Na+ and Br− counterions, and the water molecules produce a highly repulsive PMF, which is beyond 200 kJ mol−1 in the case of the DTAB coating (see the blue curve in Fig. 2(e)). Further, the free energy barrier difference, ΔE = 90.6 kJ mol−1, between the simulated PMF and the predicted DLVO interaction potential for two SDS CNPs clearly shows that the classical DLVO theory is extremely inadequate to describe the interactions of soft-matter-coated NP surfaces. Moreover, any extension of the continuum DLVO theory44 reveals strong limitations in its ability to reproduce the actual inter–particle potential (see Fig. S9 in the ESI†).
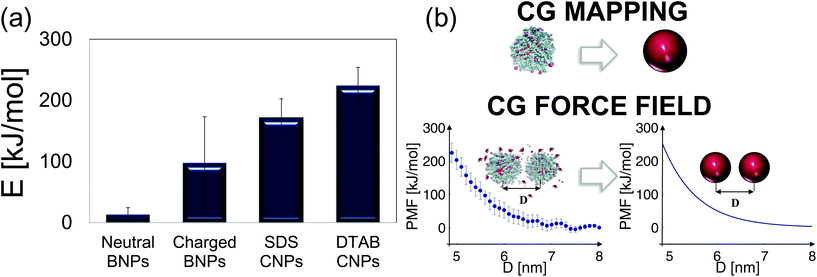
Rational behind the multi-scale model and the stochastic dynamics simulations
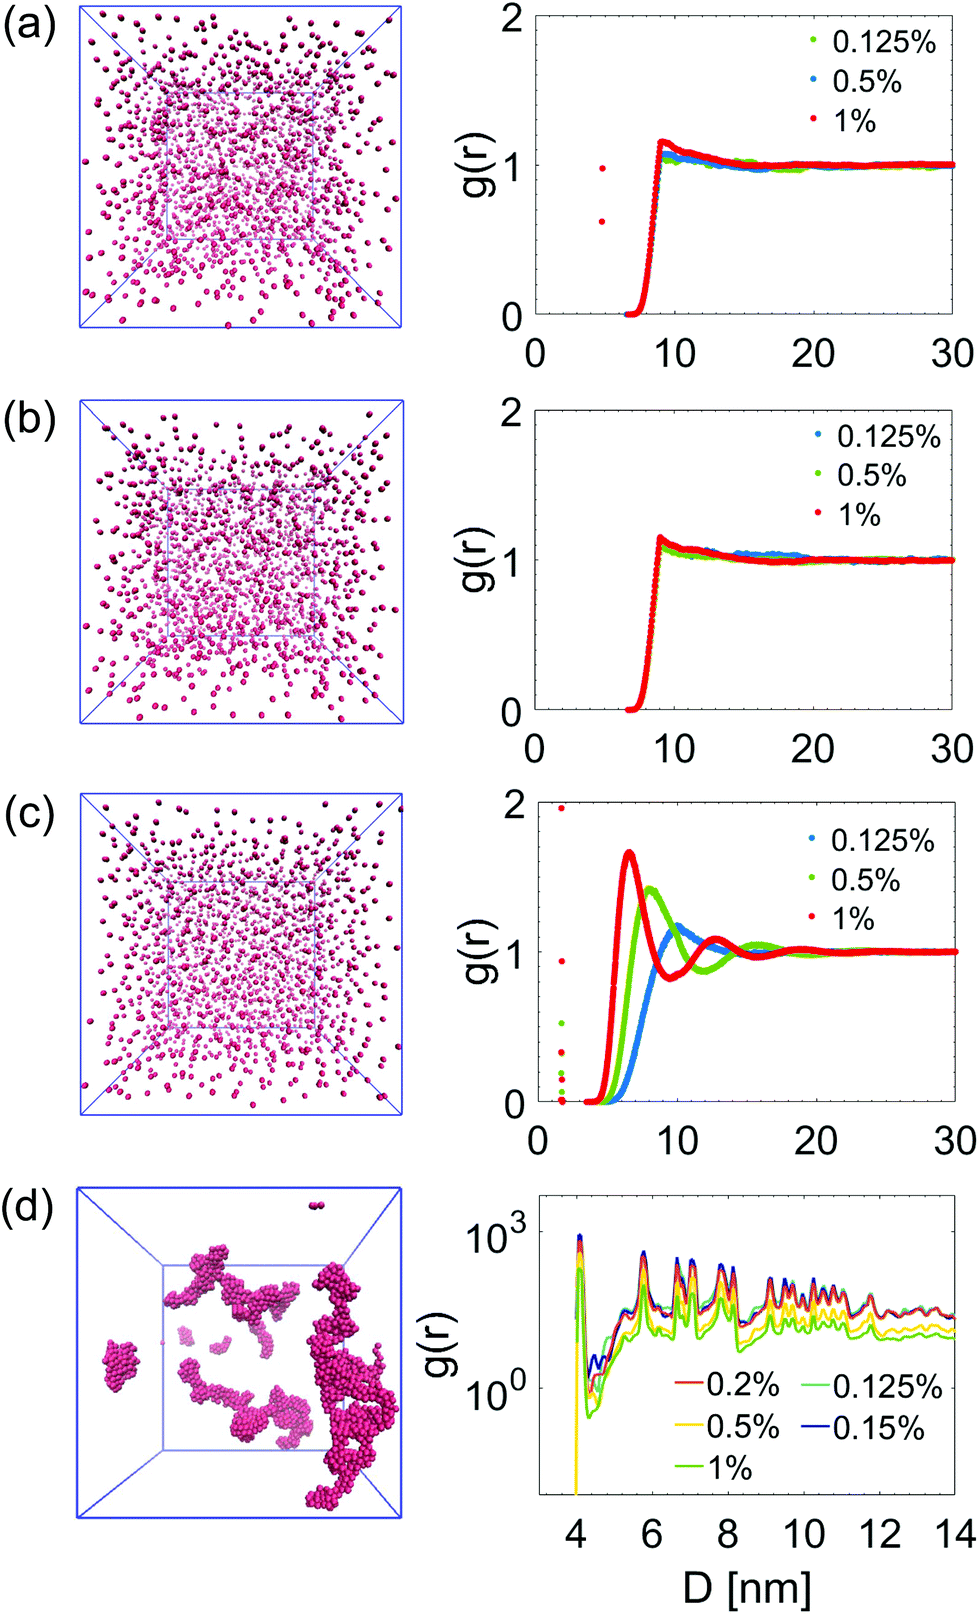
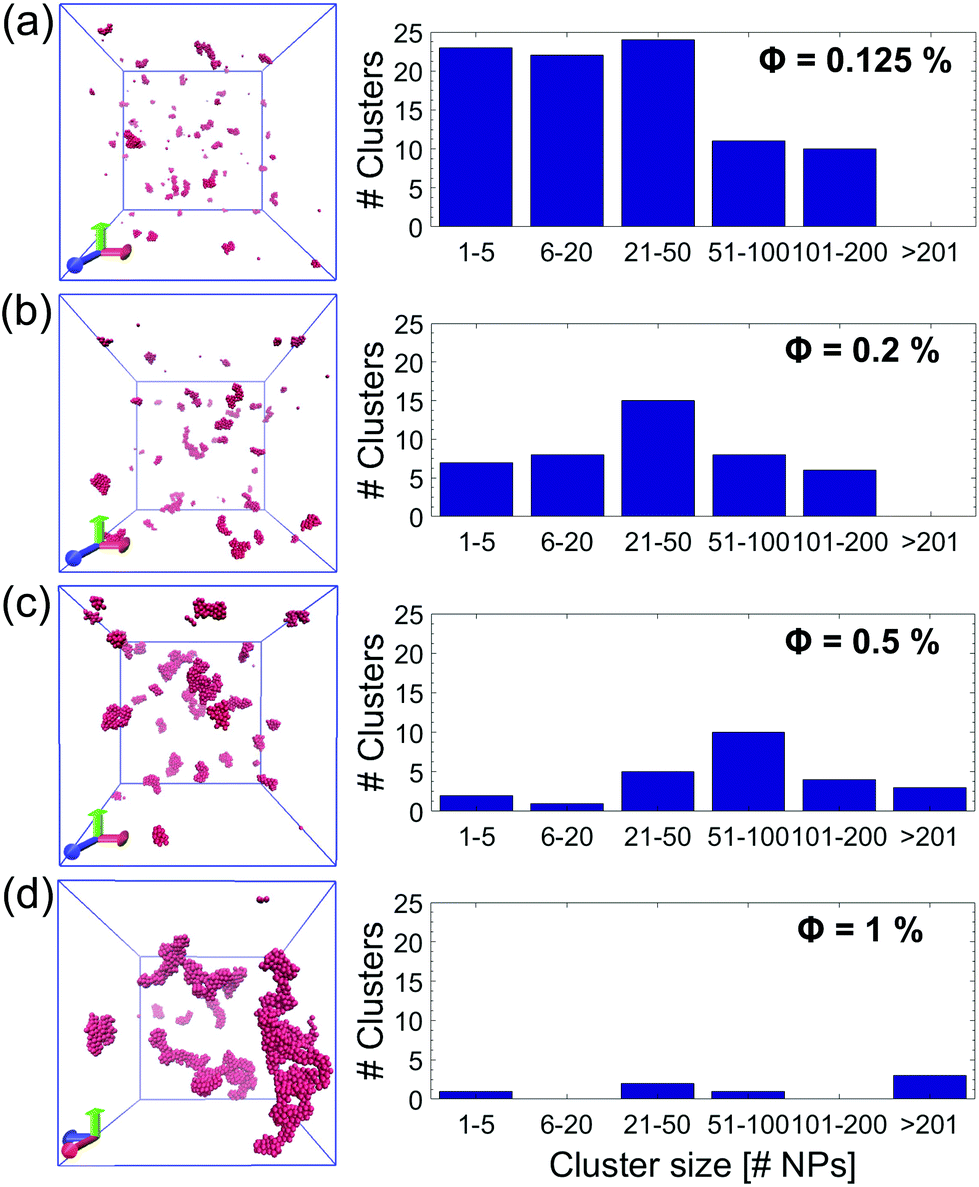
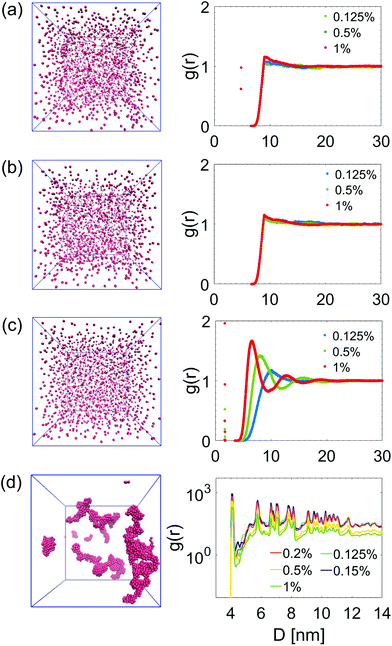
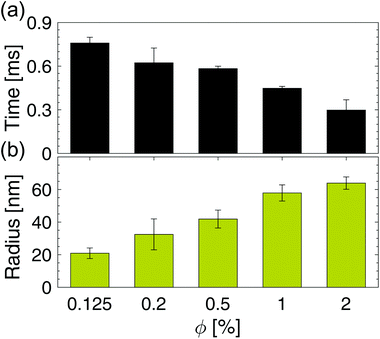
To summarize and compare the central results of the simulated PMFs, the free energy barriers E corresponding to the first repulsive peaks of the PMFs of the 4 types of alumina NPs considered (neutral BNP, charged BNP, SDS CNP, and DTAB CNPs) are shown in Fig. 3(a). Note that, in case of soft repulsive potentials between DTAB and SDS CNPs the primary free energy barrier has been considered as the maximum value of the PMF in the range of short NP separation distance, namely for 4.8 nm < D < 5.2 nm. The bar graph in Fig. 3(a) highlights how the electric surface charges and the addition of surfactants contribute to an increase in the free energy barrier, E, thereby suggesting a reduced rate of aggregation of NPs. To simulate the dynamics of suspended NPs, we carried out SD simulations, based on the inter–particle PMFs simulated above. Specifically, a bottom-up approach was pursued, where as shown in Fig. 3(b), each NP was mapped into a single isotropic bead and the PMF was used as the effective pair potential between NPs in solution to accurately reproduce the net force, Fi, acting on a single NPi during its dynamics (see eqn (6)). This multi-scale approach represents one of the most accurate ways to bridge nanoscale phenomena and mesoscale behavior, providing an atomistic framework to carry out coarse-grained simulations of isotropically interacting NPs. For each NP considered (neutral BNP, charged BNP, SDS CNP, and DTAB CNP), SD simulations were carried out by tuning the NP volume fraction, Φ, from 0.125% to 5%. Note that this range of Φ values is adequate to investigate various regimes of the kinetics of NP aggregation and stability in nano-suspensions, thereby allowing the formulation of guidelines for the design of engineered NPs dispersed in aqueous solutions. Moreover, for each NP volume fraction considered, 3 independent SD simulations were performed to ensure statistical reliability of the results. The simulations start with a random distribution of the NPs and are run for up to 0.8 ms. Fig. 4(a–d), left shows representative simulation snapshots of four NP suspensions at 0.8 ms. Fig. 4(a–d), right shows the radial distribution functions (g(r)) corresponding to the four NP suspensions at various volume fractions. The high free energy barriers encountered in the SDS CNPs and the DTAB CNPs hinder potential NP aggregation, leading to well-dispersed suspensions in both cases (see snapshots in Fig. 4(a) and (b)). Indeed, the radial distribution functions, g(r), corresponding to the SDS CNPs and the DTAB CNPs exhibit a gas-like distribution of the dispersed NPs.45 Moreover, the first peaks, located beyond 7 nm from the center of the reference NP, indicate the absence of any clusters (recall that the radius of a CNP is <2.5 nm). However, rare and isolated aggregates can be observed at D = 4.8 nm in Fig. 4(a). This suggests a slightly more favorable condition for aggregation in the case of SDS CNPs when compared to DTAB CNPs, as confirmed by the observed reduced free energy barrier in the PMF for SDS CNPs (see Fig. 3(a)). Fig. 4(c) shows the resulting distribution of charged NPs of R = 0.85 nm in aqueous solution with added [NaCl] = 0.01 M. The equilibrium simulation snapshot on the left suggest that charged NPs are all unable to overcome the primary potential energy barrier (see the PMF in the ESI†). Therefore, the coupled effect of the surface charge density and the hydration repulsion apparently prevents, at least for this NP radius, NP aggregation, thereby producing a well-dispersed suspension. However, a quantitative analysis of the radial distribution function highlights that, irrespective of the NP volume fraction, the first peak in g(r) is located at r = 1.7 nm, which corresponds precisely to the diameter of a charged BNP (see Fig. 4(c)). This implies a finite probability to overcome the primary potential energy barrier, and to observe two BNPs sticking to each other. Indeed, by comparing the g(r) in Fig. 4(c) with the previously discussed cases (see Fig. 4(a and b)), we observe a more liquid-like distribution function of the dispersed charged BNPs. However, both the enhancement of the NP surface charge density and the addition of surfactants have shown to be highly effective in stabilizing NP suspensions, consistent with experimental observations,10,53 thereby qualitatively validating our modelling approach. On the other hand, when neutral BNPs are dispersed in aqueous solution, NP aggregation is prominently observed (see Fig. 4(d) left side). In this case, the formation of NP clusters is expected because of the low primary energy barrier of around 13 kJ mol−1 (see Fig. 2(d)). The distribution functions of suspended neutral BNPs are reported on the right-hand side of Fig. 4(d). The highest peaks of the radial distribution functions occur when r = 4 nm, namely at one BNP diameter distance, confirming the extremely high probability to find two BNPs stuck together. Moreover, several lower peaks indicate the presence of NP aggregates in the aqueous suspensions. Finally, Fig. 4(d) also shows a decrease in the g(r) values when the volume fraction of the BNPs increases. This observation sheds light on the configurational arrangement of the dispersed NPs: when Φ is increased, the likelihood of radial aggregation decreases, and more elongated NP clusters are observed. In order to develop a thorough understanding of the aggregation phenomena in neutral BNP aqueous suspensions, a cluster analysis was conducted on the last simulation configuration, precisely at 0.8 ms, when all the suspensions having different NP volume fractions reached steady state (see the convergence of the SD simulations in the ESI†). Notably, the time and length scales attained with the SD simulations are substantially larger than those attained with an all-atom description, thereby allowing an accurate prediction of nano-colloidal stability. Fig. 5 left illustrates the distribution of the NP aggregates at (a) Φ = 0.125%, (b) Φ = 0.2%, (c) Φ = 0.5%, and (d) Φ = 1%. As the simulation snapshots highlight qualitatively, the aggregation of NPs occurs irrespective of what the volume fraction of the dispersion is. However, the size of the NP clusters grows progressively as Φ increases. A quantitative description of the cluster size distribution is shown in Fig. 5, right, which displays the number of clusters (# Clusters) as a function of their size (quantified in terms of the number of NPs (# NPs)). Firstly, from the histograms in Fig. 5, right, we observe a reduction in the total number of clusters formed after 0.8 ms, as the NP volume fraction is increased over the range considered. Secondly, moving from Φ = 0.2% to Φ = 1%, the cluster size distributions show a peak which progressively shifts towards aggregates of bigger size. For example, when Φ = 0.2%, the majority of the clusters contain between 21 and 50 NPs, whereas for Φ = 0.5%, the average size of the aggregates is between 50 and 100 NPs. When Φ = 1%, three big clusters of more than 200 nanoparticles each are formed. Very tiny aggregates containing less than 5 NPs are always present, highlighting the possibility of detachment and rearrangement of NPs because of their thermal motion. Moreover, we also evaluated the fractal dimension parameter, df, of the final NP clusters formed in the nano-suspensions and we found average values of df between 1.88 and 2.02 (see eqn (8)). Furthermore, for each volume fraction, we carried out the cluster analysis at several frames along the simulation trajectories, thereby providing a global picture of the kinetics of NP aggregation. A throughout description of the time evolution of NP clusters is detailed in the ESI† and the main outcomes are summarized in Fig. 6. In order to compare the characteristic time scales associated with NP aggregation, we reported in Fig. 6 the formation times of the biggest and longest-lived clusters present in the nano-suspensions considered. Specifically, Fig. 6(a) illustrates the time elapsed to first observe the formation of the largest cluster, including retaining its identity for more than 0.1 ms. The observed trend quantitatively confirms that in a very dilute NP suspension, a longer time is required to form clusters with stable dimensions. For example, in a NP suspension with a volume fraction of 0.125%, the largest cluster reaches a stable size after around 0.76 ± 0.04 ms (see Fig. 6(a)). On the other hand, in a suspension with a volume fraction of 1%, 0.448 ± 0.01 ms are sufficient for the largest cluster to reach a stable
size. This observation is intuitively related to the lower collision probability occurring in dilute suspensions. In Fig. 6(b), we report the equivalent radius of the largest clusters considered above. Specifically, we estimated the radius of aggregates as half of the maximum distance calculated between all possible combinations of NPs i and j inside the cluster, that is, Ra = 1/2 max |ri − rj|, where ri and rj are the position vectors of the NPs i and j. Fig. 6(b) confirms the enhancement of the NP cluster size as the NP suspension volume fraction increases. It is worth noting that NP suspensions having volume fractions larger than 2% exhibit complete NP aggregation, where a single cluster was observed after a few μs of SD simulation (see Fig. S10(c) in the ESI†). This finding clearly defines a design demarcation between stable and unstable suspensions possessing such physical and chemical features.
 |
| | Fig. 3 Rational of the multi-scale model. (a) Free energy barriers, E, corresponding to the simulated PMFs for (i) neutral BNPs of R = 2 nm, (ii) charged BNPs of R = 0.85 nm and surface charge σq = −0.346 C m−2, (iii) SDS CNPs of R = 2.41 nm, and (iv) DTAB CNPs of R = 2.45 nm. Note that some details about the evaluation of CNP radius are shown in the ESI.† (b) Graphical schematic of the multi-scale modelling approach implemented here: first, atomistic simulations are carried out to evaluate the potential of mean force (PMF) between two identical multi-atom NPs, second, each multi-atom NP is coarse grained (CG) into a single bead, where the PMF previously calculated is used as the bead-bead force field, and third, stochastic dynamics (SD) simulations are finally carried out. | |
 |
| | Fig. 4 Nanoparticle (NP) aggregation state. Right, radial distribution functions, (g(r)), of suspended (a) SDS CNPs, (b) DTAB CNPs, (c) charged BNPs, and (d) neutral BNPs at volume fractions Φ = 0.125, 0.5, and 1%. Additional Φ values are reported in case of (d). Left, NP suspensions corresponding to Φ = 1% at t = 0.8 ms, where each NP is depicted as a red dot. | |
 |
| | Fig. 5 Nanoparticle (NP) cluster distribution. Cluster analysis of four NP suspensions after 0.8 ms of stochastic dynamics (SD) simulations. The corresponding frames for (a) Φ = 0.125%, (b) Φ = 0.2%, (c) Φ = 0.5% (c), and (d) Φ = 1% are shown on the left. Note that as the particle volume fraction, Φ, increases, fewer NP clusters with bigger size are formed. The radius of the BNPs is equal to 2 nm for all the simulated NP suspensions. | |
 |
| | Fig. 6 Time scale of aggregation. (a) Formation-time of the biggest, and the longest-lasting NP cluster in each NP aqueous suspension having Φ values ranging from 0.125% to 2%. The error bars were obtained by averaging the time over a sample of 3 SD simulations for each volume fraction. (b) Average radii, Ra, of the clusters identified in (a). Note that the corresponding # of NPs at each Φ are: 99 ± 5 (at 0.125%), 176 ± 40.5 (at 0.2%), 348 ± 35 (at 0.5%), 628 ± 173 (at 1%), and 1480 ± 475.50 (at 2%). | |
Macroscopic properties and comparison with experimental results
The multi-scale approach developed to model the dynamics of NPs dispersed in aqueous solutions was finally used to calculate some characteristic thermo-physical properties of the suspensions. Because of the confirmed dependence of the heat conductive mechanisms in NP suspensions with the NP aggregation status,21,46,47 in this study we focused the attention on the calculation of the overall thermal conductivity (kNS) of the nano-suspensions (NS) in case of the neutral BNP close to the isoelectric point (pH = 9). The viscosity (μNS) and the specific heat capacity (cp,NS) were also considered, and the results are shown in the ESI.† By including the cluster size distribution presented above in the adaptation of the BG model,21 we computed the relative thermal conductivities, (kr = kNS/kbf) of the NP suspensions considered in this paper. The results obtained by the current developed MS model are reported in Fig. 7 with blue dots. A favourable comparison of the predicted thermal conductivity with the experimental data48–51 provides a preliminary validation of the MS approach (see coloured dots in Fig. 7). For the sake of completeness, we also computed the thermal conductivity of the nano-suspensions considered utilizing the classical DLVO theory as the interaction potential energy between the NPs, and the Smoluchowski aggregation theory52 to evaluate the rate of NP aggregation and the cluster distribution (black curves in Fig. 7). A detailed description of the thermal conductivity prediction by coupling the previously mentioned theoretical models is reported in the ESI.† As Fig. 7 demonstrates, the use of the DLVO theory to model the NP interactions and the assumption of a constant fractal dimension parameter, df, result in a strong overestimation of the thermal conductivity prediction. Specifically, the remarkable enhancement of the thermal conductivity predicted by the theoretical models (DLVO + Smoluchowski aggregation or DLVO + SA theory) is mainly due to the underestimation of the free energy barriers in the net NP interactions (see the DLVO curves in Fig. 2(d and e)). This consequentially leads to an increase of the cluster aggregation phenomena and the corresponding thermal conductivity evaluated according to the adaptation of the BG model. In addition, the assumption of a constant fractal dimension parameter, df, in the kinetic of aggregation theory also contributes to a sensible variation of kr between our MS model and the theoretical models (DLVO + SA theory). In fact, a sensitivity analysis of the BG model adopted for the thermal conductivity prediction, demonstrates that a reduction of df from 2 to 1.8 may leads, in case of pH = IEP, to an increase of 20% in the thermal conductivity values. As a consequence, assuming a value of df constant and equal to 1.8 (consistently with the DLCA aggregation theory in case of pH = IEP) may bring to a systematic overestimation of the thermal conductivity (we remind that the results of our SD simulations have shown 1.88 < df < 2.02). Moreover, from an analysis of the data in Fig. 7, we find that the slope of the thermal conductivity variation with the volume fraction of the NP suspension is overestimated by about 2000 times by the DLVO + SA theory, when compared to the proposed MS model. In fact, at a volume fraction of 1%, the DLVO + SA theory leads to a 100% overprediction of the thermal conductivity of the NP suspension, as compared to the proposed MS model, which is in good agreement with the experimental data. In conclusion, the MS model developed in this paper allows to precisely evaluate the fractal dimension parameters (df) of each cluster, thereby assuring a coherent description of the NP volume fraction inside the clusters (Φin), the aggregate volume fraction (Φa), and the thermal conductivity of the nano-suspensions considered. Finally, it is worth noticing that, although the experimental values in Fig. 7 refer to alumina nano-suspensions with various NP radii and solution pHs,48–51 the incorporation of repulsive energy barriers in the classical theoretical models (DLVO + SA theory) also reveals a consistent overprediction of the macroscopic thermal property (dotted, dashed and continuum black curves in Fig. 7). The influence of the interfacial thermal resistance on the overall thermal conductivity75 and additional calculations of macroscopic properties are presented in the ESI.†
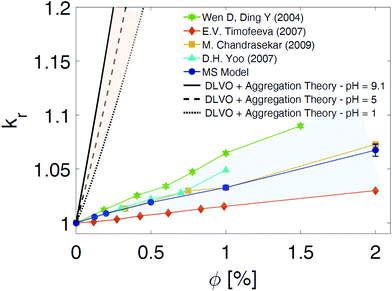 |
| | Fig. 7 Comparison of the relative thermal conductivity. Relative thermal conductivity (kr = kNS/kbf) of suspended alumina BNPs in water as a function of the particle volume fraction, Φ. The blue dots, calculated following the Multi-Scale (MS) model presented in the text, are compared with the experimental data reported in the literature. The green stars are from ref. 49, the light blue triangles from ref. 51, the yellow squares from ref. 50, and the orange diamonds from ref. 48. The relative thermal conductivity values obtained by applying the DLVO theory along with the theory of kinetic aggregation are shown by the black curves. The theoretically predicted values of kr are calculated for nano-suspensions at pH = IEP (isoelectric point; solid black line), pH = 5 (dashed line), and pH = 1 (dotted line). Specifically, we evaluated the relative thermal conductivity, kNS/kbf, by considering nano-suspensions after 12 hours from the initial monodisperse condition (see ESI† for further information). The coloured shadows aim to highlight the discrepancy between the results obtained with the traditional theories (DLVO + Smoluchowski aggregation) and the thermal conductivity values derived from experiments and our MS model. | |
Conclusions
The use of dispersed nanoparticles in aqueous solutions has been recognized as being extremely beneficial in a wide variety of applications. However, engineering nano-sized suspensions remain a challenging task both experimentally and theoretically. In addition to the experimental issues, modelling efforts for suspended nanoparticles have unveiled numerous impediments in terms of reproducing the broad spectrum of multi-scale phenomena in NP suspensions. In this paper, we presented a novel multi-scale (MS) approach to reproduce the dynamics of self-assembly of suspended nanoparticles in aqueous solutions. We implemented a bottom-up coarse-grained (CG) method which allows the incorporation of nanoscale phenomena into the dynamics of suspended NPs, thereby bridging the challenging gap between nanoscopic and macroscopic scales. Starting from all-atomistic simulations, we evaluated the potentials of mean force (PMFs) between several NPs in aqueous solutions. Then, we defined ad-hoc CG force fields to carry out stochastic dynamics (SD) simulations and predict the stability of nanoparticle suspensions and the kinetics of the underlying aggregation processes. The simulated PMFs between both bare and coated nanoparticles have demonstrated that the traditional van der Waals and electrostatic interactions, derived in the context of the DLVO theory, are not able to model the inter–particle interactions realistically, underestimating the repulsive free energy barrier, with important ramifications in modeling of the self-assembly of NPs. Moreover, even the more accurate extensions of the continuum DLVO theory have proven inadequate to describe the NP pair potential. The combined analysis of the PMF and atomistic simulations of interfacial phenomena, involving solid, soft, and liquid matter, shed light on the specific factors influencing the inter–NP interactions, thereby clarifying the multiple, closely coupled phenomena controlling the interactions between NPs in aqueous solutions. More specifically, MD simulations have shown that steric hydration, head-group overlap, and thermal fluctuations of the surfactant tails strongly influence the inter–NP interactions, thereby creating a remarkable inefficiency of the classical DLVO theory. For these reasons, atomistic-simulation-based strategies are recommended to compute the interaction potential between NPs, including correctly capturing the attractive van der Waals and the repulsive electrostatic interactions, as well as entropic effects which are particularly important at the nanoscale.
The calculated PMF curves have been used to simulate the Langevin dynamics of suspended NPs in aqueous media. The results emphasize the crucial role played by the potential energy barrier in yielding well-dispersed NP suspensions. Both the NP surface charge density and the addition of surfactants have shown great potential to stabilize NP suspensions, as demonstrated in some reported experimental papers,10,53 thereby qualitatively validating our modelling approach. On the other hand, in the case of purely attractive interactions, with a very weak potential free energy barrier, we observed a rapid aggregation of single-dispersed NPs. Firstly, suspensions having higher NP concentrations exhibited a faster aggregation kinetics. Indeed, by calculating the formation times of the resulting clusters, we found that moving from Φ = 0.125% to Φ = 1%, the biggest clusters reached a stable dimension in 0.76 ms and 0.448 ms, respectively. Secondly, through our cluster analysis, we demonstrated that nano-dispersions possessing lower particle volume fractions show a higher propensity for stability. In particular, we verified that volume fractions higher than 2% exhibit a critical condition of stability, thereby establishing a design threshold for the samples considered. Finally, our cluster analysis has allowed us to carefully evaluate the overall thermal properties of the NP suspensions, avoiding any erroneous assumptions about the shape and size of the resulting NP aggregates. The results have shown that the multi-scale model developed here demonstrates the best performance to date in predicting the thermal conductivity when compared with standard classical models, namely the DLVO theory and the Smoluchowski aggregation theory. In the present work we validate the MS model on the basis of the resulting thermal conductivity of NP suspensions. A more systematic validation would consist of demonstrating that the PMF obtained by MD simulations can reproduce the bulk structure properties of the nano-suspensions. For example, Small Angle Neutron Scattering (SANS) or Small Angle X-rays Scattering (SAXS) would offer a valid experimental approach to recover the three-dimensional arrangement on the nanoscale. Specifically, in SANS experiments, the scattered intensity signal, that is the coherent differential scattering cross-section per unit solid angle (dΣ/dΩ), can be correlated to the static structure factor. With all of the above in mind, we believe that the multi-scale framework presented in this paper represents the first step towards a systematic, rational design of nanoparticle suspensions. Additional effects like the surfactant passivation, environment pH and solution temperature could be also considered and included in future works to investigate with our MS model a wider sampling of nanoparticle suspensions.
Conflicts of interest
There are no conflicts to declare.
Acknowledgements
A. C. and P. A. thank the Italian Ministry of Education, Universities and Research (MIUR) under the NANO-BRIDGE project (PRIN 2012 call, grant number 2012LHPSJC), the “Fondazione Cassa Risparmio Torino” under the NANOSTEP project (“La Ricerca dei Talenti” call, grant number 911/2015) and the “Compagnia di San Paolo” under the NANOBUBBLE project (MITOR 2016 call). D. B., A. G. R., and R. P. M. acknowledge financial support from the National Science Foundation (NSF) CBET-1511526. The authors thank the CINECA (Iscra C and Iscra B projects), and Politecnico di Torino's High Performance Computing Initiative (http://hpc.polito.it/) for the availability of computing resources and support. The authors acknowledge PRACE (MULTINANO) for awarding them access to HYDRA at RZG in Germany, and EUDAT (MULTINANO) for the data repository service at CINECA in Italy. This work used the Extreme Science and Engineering Discovery Environment (XSEDE), which is supported by NSF grant number ACI-1053575. The authors thank Dr. Hari Katepalli, Professor Eliodoro Chiavazzo and Dr. Matteo Fasano for constructive discussions.
Notes and references
- Y. Zhang, Y. Chen, P. Westerhoff, K. Hristovski and J. C. Crittenden, Water Res., 2008, 42, 2204–2212 CrossRef CAS PubMed.
- I. Ali, Chem. Rev., 2012, 112, 5073–5091 CrossRef CAS PubMed.
- Y. Wang, Y. Zheng, L. Zhang, Q. Wang and D. Zhang, J. Controlled Release, 2013, 172, 1126–1141 CrossRef CAS PubMed.
- B. E. Rabinow, Nat. Rev. Drug Discovery, 2004, 3, 785–796 CrossRef CAS PubMed.
- J. Shi, P. W. Kantoff, R. Wooster and O. C. Farokhzad, Nat. Rev. Cancer, 2017, 17, 20–37 CrossRef CAS PubMed.
- E. Chiavazzo, M. Fasano, P. Asinari and P. Decuzzi, Nat. Commun., 2014, 5, 3565 CrossRef PubMed.
- M. Chieruzzi, G. F. Cerritelli, A. Miliozzi, J. M. Kenny and L. Torre, Sol. Energy Mater. Sol. Cells, 2017, 167, 60–69 CrossRef CAS.
- S. Merabia, S. Shenogin, L. Joly, P. Keblinski and J.-L. Barrat, Proc. Natl. Acad. Sci. U. S. A., 2009, 106, 15113–15118 CrossRef CAS PubMed.
- A. Cardellini, M. Fasano, M. B. Bigdeli, E. Chiavazzo and P. Asinari, J. Phys.: Condens. Matter, 2016, 28, 483003 CrossRef PubMed.
- M. B. Bigdeli, M. Fasano, A. Cardellini, E. Chiavazzo and P. Asinari, Renewable Sustainable Energy Rev., 2016, 60, 1615–1633 CrossRef CAS.
- A. Moradi, E. Sani, M. Simonetti, F. Francini, E. Chiavazzo and P. Asinari, J. Nanosci. Nanotechnol., 2015, 15, 3488–3495 CrossRef CAS PubMed.
- M. d. R. Rodríguez-Laguna,
et al.
, Nanoscale, 2018, 10.32, 15402–15409 RSC.
- L. Ma, J. Wang, A. M. Marconnet, A. C. Barbati, G. H. McKinley, W. Liu and G. Chen, Nano Lett., 2014, 15, 127–133 CrossRef PubMed.
- C. C. Zuoančič, M. Paisana, C. Rodrigues, Z. Porat, A. S. Viana, C. A. Afonso, J. Pinto, R. Gaspar, J. N. Moreira, R. Satchi-Fainarog, S. Jungc and H. F. Florido, J. Controlled Release, 2017, 258, 182–195 CrossRef PubMed.
- H. Katepalli, V. T. John, A. Tripathi and A. Bose, J. Colloid Interface Sci., 2017, 485, 11–17 CrossRef CAS PubMed.
- M. A. Boles, M. Engel and D. V. Talapin, Chem. Rev., 2016, 116, 11220–11289 CrossRef CAS PubMed.
- A. Klinkova, E. M. Larin, E. Prince, E. H. Sargent and E. Kumacheva, Chem. Mater., 2016, 28, 3196–3202 CrossRef CAS.
- N. D. Loh, S. Sen, M. Bosman, S. F. Tan, J. Zhong, C. A. Nijhuis, P. Král, P. Matsudaira and U. Mirsaidov, Nat. Chem., 2017, 9, 77 CAS.
- C.-W. Liao, Y.-S. Lin, K. Chanda, Y.-F. Song and M. H. Huang, J. Am. Chem. Soc., 2013, 135, 2684–2693 CrossRef CAS PubMed.
- B. Cabane, J. Li, F. Artzner, R. Botet, C. Labbez, G. Bareigts, M. Sztucki and L. Goehring, Phys. Rev. Lett., 2016, 116, 208001 CrossRef PubMed.
- R. Prasher, P. E. Phelan and P. Bhattacharya, Nano Lett., 2006, 6, 1529–1534 CrossRef CAS PubMed.
- C. A. S. Batista, R. G. Larson and N. A. Kotov, Science, 2015, 350, 1242477 CrossRef PubMed.
- Y. Min, M. Akbulut, K. Kristiansen, Y. Golan and J. Israelachvili, Nat. Mater., 2008, 7, 527–538 CrossRef CAS PubMed.
- D. M. Kroupa, M. Vörös, N. P. Brawand, B. W. McNichols, E. M. Miller, J. Gu, A. J. Nozik, A. Sellinger, G. Galli and M. C. Beard, Nat. Commun., 2017, 8, 15257 CrossRef CAS PubMed.
- B. Derjaguin and L. Landau, Acta Physicochim. URSS, 1941, 14, 633–652 Search PubMed.
- E. Verwey and J. T. G. Overbeek, J. Colloid Sci., 1955, 10, 224–225 CrossRef CAS.
- J. N. Israelachvili and R. M. Pashley, Nature, 1983, 306, 249–250 CrossRef CAS.
- R. Prasanna Misra, S. Das and S. K. Mitra, J. Chem. Phys., 2013, 138, 114703 CrossRef PubMed.
- S. Lin, C.-J. Shih, M. S. Strano and D. Blankschtein, J. Am. Chem. Soc., 2011, 133, 12810–12823 CrossRef CAS PubMed.
- W. Lv and R. Wu, Nanoscale, 2013, 5.7, 2765–2775 RSC.
- S. T. Milner, T. Witten and M. Cates, Macromolecules, 1988, 21, 2610–2619 CrossRef CAS.
- M. Moazzami-Gudarzi, T. Kremer, V. Valmacco, P. Maroni, M. Borkovec and G. Trefalt, Phys. Rev. Lett., 2016, 117, 088001 CrossRef PubMed.
- S. Alexander, P. Chaikin, P. Grant, G. Morales, P. Pincus and D. Hone, J. Chem. Phys., 1984, 80, 5776–5781 CrossRef CAS.
- J.-S. Sin, J. Chem. Phys., 2017, 147, 214702 CrossRef PubMed.
- V. Lobaskin and B. Dünweg, New J. Phys., 2004, 6, 54 CrossRef.
- P. Espanol and P. Warren, EPL, 1995, 30, 191 CrossRef CAS.
- T. Witten Jr. and L. M. Sander, Phys. Rev. Lett., 1981, 47, 1400 CrossRef.
- Y. Feng, G. Wang, L. Ruan and A. Du, AIP Advances, 2017, 7, 035017 CrossRef.
- N. Schwierz, D. Horinek and R. R. Netz, Langmuir, 2013, 29, 2602–2614 CrossRef CAS PubMed.
- Z. Xu, X. Yang and Z. Yang, Nano Lett., 2010, 10, 985–991 CrossRef CAS PubMed.
- Z. Liu, J.-G. Yu, E. A. O'Rear and A. Striolo, J. Phys. Chem. B, 2014, 118, 9695–9707 CrossRef CAS PubMed.
- A. Luzar and D. Chandler, Nature, 1996, 379, 55 CrossRef CAS.
-
J. N. Israelachvili, Intermolecular and Surface Forces, Academic press, 2011 Search PubMed.
- S. H. Donaldson, C. T. Lee, B. F. Chmelka and J. N. Israelachvili, Proc. Natl. Acad. Sci. U. S. A., 2011, 108, 15699–15704 CrossRef CAS PubMed.
- B. Nijboer and L. Van Hove, Phys. Rev., 1952, 85, 777 CrossRef CAS.
- W. Evans, R. Prasher, J. Fish, P. Meakin, P. Phelan and P. Keblinski, Int. J. Heat Mass Transfer, 2008, 51, 1431–1438 CrossRef CAS.
- V. Starov, V. Zhdanov, M. Meireles and C. Molle, Adv. Colloid Interface Sci., 2002, 96, 279–293 CrossRef CAS PubMed.
- E. V. Timofeeva, A. N. Gavrilov, J. M. McCloskey, Y. V. Tolmachev, S. Sprunt, L. M. Lopatina and J. V. Selinger, Phys. Rev. E, 2007, 76, 061203 CrossRef PubMed.
- D. Wen and Y. Ding, Int. J. Heat Mass Transfer, 2004, 47, 5181–5188 CrossRef CAS.
- M. Chandrasekar, S. Suresh and A. C. Bose, Exp. Therm. Fluid Sci., 2010, 34, 210–216 CrossRef CAS.
- D.-H. Yoo, K. Hong and H.-S. Yang, Thermochim. Acta, 2007, 455, 66–69 CrossRef CAS.
- M. V. Smoluchowski, Z. Phys. Chem., 1918, 92, 129–168 Search PubMed.
- A. A. Keller, H. Wang, D. Zhou, H. S. Lenihan, G. Cherr, B. J. Cardinale, R. Miller and Z. Ji, Environ. Sci. Technol., 2010, 44, 1962–1967 CrossRef CAS PubMed.
- R. T. Cygan, J.-J. Liang and A. G. Kalinichev, J. Phys. Chem. B, 2004, 108, 1255–1266 CrossRef CAS.
- M. J. Abraham, T. Murtola, R. Schulz, S. PÃ ll, J. C. Smith, B. Hess and E. Lindahl, SoftwareX, 2015, 1, 19–25 CrossRef.
- H. Berendsen, J. Grigera and T. Straatsma, J. Phys. Chem., 1987, 91, 6269–6271 CrossRef CAS.
- S. Miyamoto and P. A. Kollman, J. Comput. Chem., 1992, 13, 952–962 CrossRef CAS.
- U. Essmann, L. Perera, M. L. Berkowitz, T. Darden, H. Lee and L. G. Pedersen, J. Chem. Phys., 1995, 103, 8577–8593 CrossRef CAS.
- G. Bussi, D. Donadio and M. Parrinello, J. Chem. Phys., 2007, 126, 014101 CrossRef PubMed.
- H. J. Berendsen, J. V. Postma, W. F. van Gunsteren, A. DiNola and J. Haak, J. Chem. Phys., 1984, 81, 3684–3690 CrossRef CAS.
- S. Nosé and M. Klein, Mol. Phys., 1983, 50, 1055–1076 CrossRef.
- M. Parrinello and A. Rahman, J. Appl. Phys., 1981, 52, 7182–7190 CrossRef CAS.
- R. M. Neumann, Am. J. Phys., 1980, 48, 354–357 CrossRef CAS.
- H. Flyvbjerg and H. G. Petersen, J. Chem. Phys., 1989, 91, 461–466 CrossRef CAS.
-
M. J. Rosen and J. T. Kunjappu, Surfactants and interfacial phenomena, John Wiley & Sons, 2012 Search PubMed.
- L. Martínez, R. Andrade, E. G. Birgin and J. M. Martínez, J. Comput. Chem., 2009, 30, 2157–2164 CrossRef PubMed.
- W. L. Jorgensen, D. S. Maxwell and J. Tirado-Rives, J. Am. Chem. Soc., 1996, 118, 11225–11236 CrossRef CAS.
- B. Hess, H. Bekker, H. J. Berendsen and J. G. Fraaije, J. Comput. Chem., 1997, 18, 1463–1472 CrossRef CAS.
- J. E. Sader, S. L. Carnie and D. Y. Chan, J. Colloid Interface Sci., 1995, 171, 46–54 CrossRef CAS.
- D. S. Lemons and A. Gythiel, Paul Langevin's 1908 paper “On the Theory of Brownian Motion” [“Sur la théorie du mouvement brownien” CR Acad. Sci. (Paris) 146, 530–533 (1908)], Am. J. Phys., 1997, 65, 1079–1081 CrossRef.
- J. C. M. Garnett, Philos. Trans. R. Soc. London, Ser. A, 1906, 205(387-401), 237–288 CrossRef CAS.
- V. D. Bruggeman, Ann. Phys., 1935, 416, 636–664 CrossRef.
- R. Hamilton and O. Crosser, Ind. Eng. Chem. Fundam., 1962, 1, 187–191 CrossRef CAS.
- D. Weitz, J. Huang, M. Lin and J. Sung, Phys. Rev. Lett., 1985, 54, 1416 CrossRef CAS PubMed.
- C.-W. Nan, R. Birringer, D. R. Clarke and H. Gleiter, J. Appl. Phys., 1997, 81, 6692–6699 CrossRef CAS.
Footnote |
| † Electronic supplementary information (ESI) available. See DOI: 10.1039/c8nr08782b |
|
| This journal is © The Royal Society of Chemistry 2019 |
Click here to see how this site uses Cookies. View our privacy policy here. 
 Open Access Article
 This Open Access Article is licensed under a
  b,
Rahul Prasanna
Misra
b,
Rahul Prasanna
Misra


 being ρi and z the number density of ion species i and its valence, respectively. The function Y(D) in eqn (4) is given by:69