
 Open Access Article
 This Open Access Article is licensed under a
 Creative Commons Attribution 3.0 Unported Licence
2D WS2 liquid crystals: tunable functionality enabling diverse applications†
Benjamin T.
Hogan
 *a,
Evgeniya
Kovalska
a,
Maria O.
Zhukova
b,
Murat
Yildirim
c,
Alexander
Baranov
b,
Monica F.
Craciun
a and
Anna
Baldycheva
*a
*a,
Evgeniya
Kovalska
a,
Maria O.
Zhukova
b,
Murat
Yildirim
c,
Alexander
Baranov
b,
Monica F.
Craciun
a and
Anna
Baldycheva
*a
aUniversity of Exeter, North Park Road, Exeter, UK EX4 4QF. E-mail: bh341@exeter.ac.uk; a.baldycheva@exeter.ac.uk
bITMO University, Kronverksky Pr., St. Petersburg, 197101, Russia
cMassachusetts Institute of Technology, Cambridge, MA 02139-4307, USA
First published on 4th September 2019
Abstract
The first observation of liquid crystalline dispersions of liquid phase-exfoliated tungsten disulfide flakes is reported in a range of organic solvents. The liquid crystals demonstrate significant birefringence as observed in the linear and circular dichroism measurements respectively. In particular, linear dichroism is observed throughout the visible range while broad-band circular dichroism can be observed in the range from 500–800 nm. Under an applied magnetic field of ±1.5 T the circular dichroism can be switched ON/OFF, while the wavelength range for switching can be tuned from large to narrow range by the proper selection of the host solvent. In combination with photoluminescence capabilities of WS2, this opens a pathway to a wide variety of applications, such as deposition of highly uniform films over large areas for photovoltaic and terahertz devices.
Introduction
Two-dimensional (2D) material-based liquid crystals with dynamically tunable properties are currently emerging as a promising- and desirable-class of novel functional materials, owing to the diverse properties that they can possess.1–3 By producing liquid crystals based on 2D materials, structural reconfigurability with associated tailoring of properties has recently been achieved.4–9 However, until now, such lyotropic (and typically nematic) liquid crystal phases2 have been reported predominantly for graphene oxide dispersions10–16 with some limited reports for carbon allotropes such as graphene7,17,18 and carbon nanotubes6 as well as for one transition metal dichalcogenide (TMD), molybdenum disulfide.8 The possibility of liquid crystalline states in dispersions of 2D materials is owing to their intrinsic shape anisotropy. It has long been known (from theory described by Onsager in the 1940s) that both rigid and flexible anisotropic molecules or particles undergo an isotropic/liquid-crystalline transition as their concentration is raised,19 forming a lyotropic liquid crystal (LC). The main condition for this phase to be observed is that a significant anisotropy of the mesogens must exist; i.e. a large aspect ratio. This transition was initially observed with clay particles and variations on Onsager theory used to determine the phase diagram.20,21Comparing existing examples of liquid crystals based on two-dimensional materials (see ESI†) to the breadth of such materials known, one can immediately see the limitations of the range of materials explored; while there are in excess of 1000 known exfoliatable two-dimensional materials,22 there are only liquid crystalline dispersions known for three of them.7,8,14 Of significant intrigue are reports that such liquid crystalline phases can also show chirality17,23 as reconfigurable chiral materials are in strong demand for photonics applications.24,25 One of the most desirable methods for chiral material reconfiguration is magnetic tuning, due to the possibility for either in situ or ex situ switching with favourable power requirements.26,27
Of particular interest, tungsten disulfide (WS2) is a TMD with significant potential for applications in a variety of areas. Its various exciting properties have led to widescale integration of WS2 in heterostructures and junctions28–32 amongst other applications such as field effect transistors,31 hydrogen evolution,33 saturable absorbers,34 supercapacitors32 and battery anodes.35 In particular, strong room temperature photoluminescence makes it an ideal candidate for applications in solar power,28,36 for instance, while second harmonic generation allows use in non-linear photonic devices.30
In its bulk crystalline form, WS2 consists of dark grey hexagonal crystals built up of layered sheets held together by van der Waals forces. Within each individual sheet (Fig. 1a), the tungsten has a trigonal prismatic co-ordination geometry, while the sulfur has a pyramidal co-ordination, such that each sulfur bridges between three tungsten centres, whilst each tungsten is bonded to six sulfurs. Dating back 60 years, the bulk crystalline form found applications as a catalyst for numerous reactions.37,38 More recently, significant interest was generated from the discovery that WS2 can form nanotube structures analogous to carbon nanotubes, representing the first inorganic nanotubes to be discovered.39 However, with the current explosion in the investigation of 2D materials, it is the van der Waals layered nature of WS2 that generates the greatest interest.3,40 The weak nature of the interlayer bonding makes it a prime candidate for exfoliation to few- or single-layered flakes of high aspect ratio. Whereas bulk WS2 is an indirect bandgap semiconductor, with a bandgap of around 1 eV, monolayers possess a direct bandgap of 1.8 eV. This direct bandgap presents a significant advantage for applications over graphene which has no bandgap.
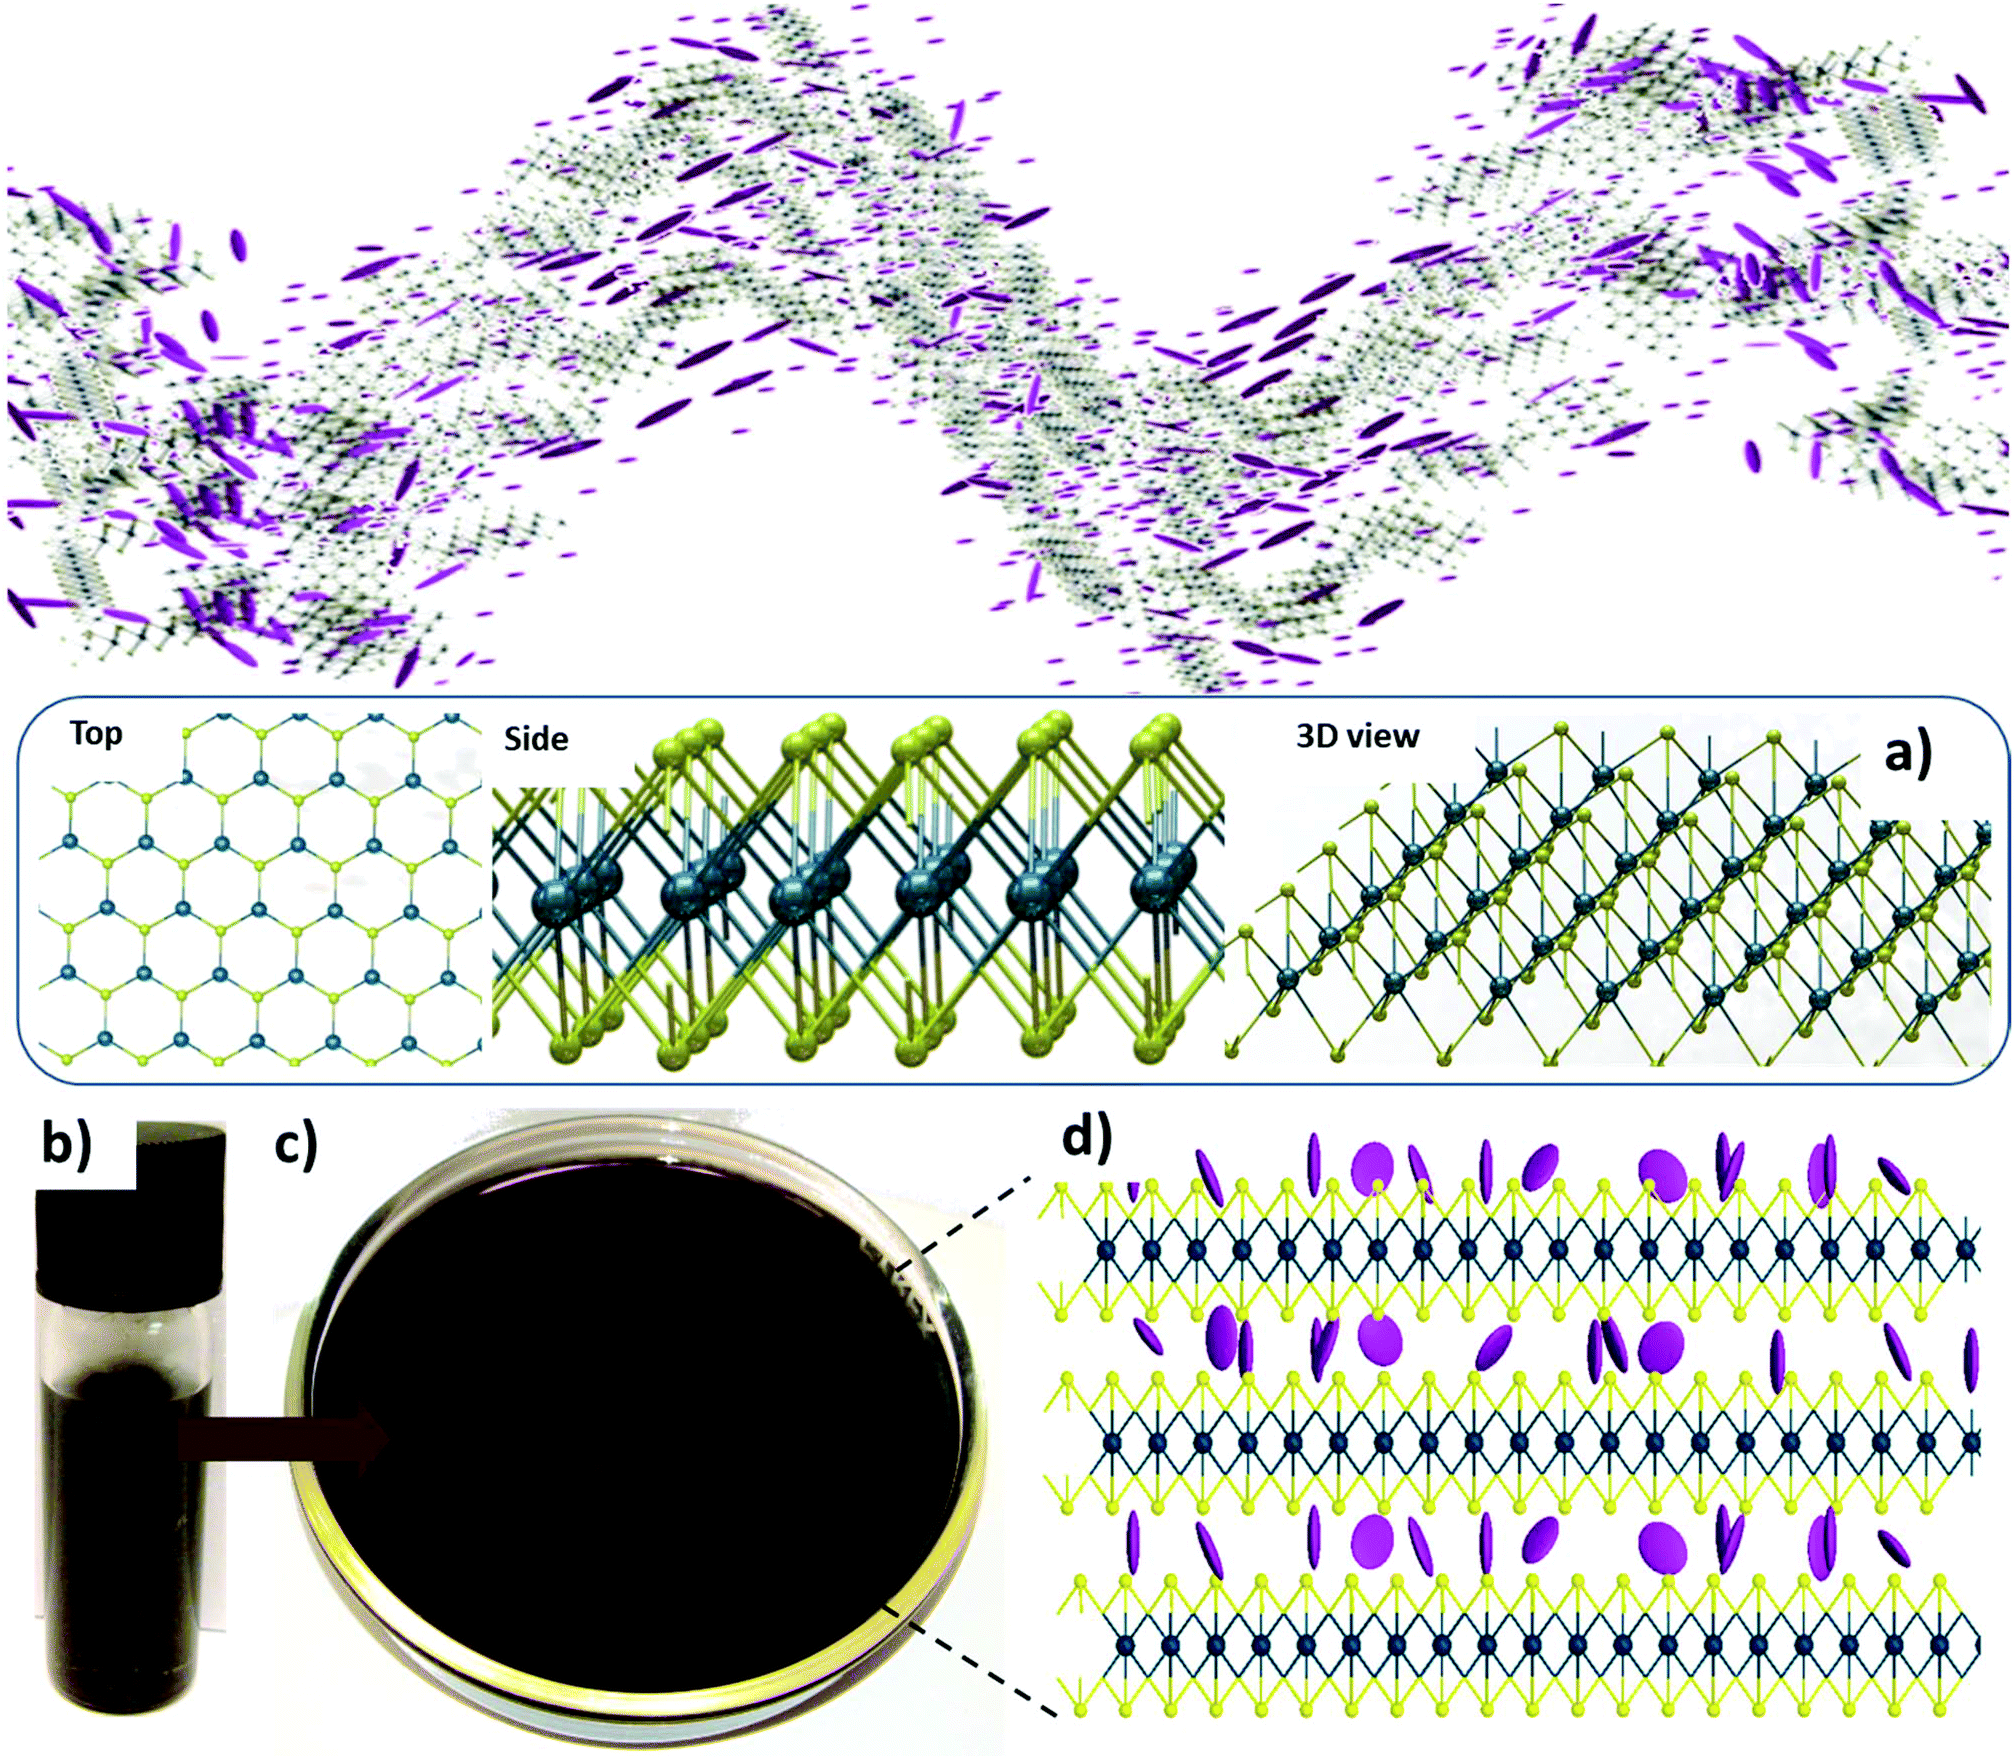 | ||
| Fig. 1 Schematic representations of liquid crystalline dispersions of tungsten disulfide. (a) Top, side and 3D views of the bonding structure of tungsten disulfide. Tungsten atoms are represented in blue and sulfur in yellow. (b and c) Vial and Petri dish containing a tungsten disulfide dispersion in solvent. (d) Liquid crystalline assembly of monolayers of tungsten disulfide, separated by intercalating solvent molecules (purple), retaining crystalline ordering between sheets. | ||
Herein, we demonstrate – for the first time – the possibility of a liquid crystalline phase of dispersions of WS2 particles (Fig. 1b–d) in a variety of solvents. Of particular interest is the emergence under applied magnetic field, or without applied field, of circular dichroism of dispersions in particular solvents. This observation is particularly unexpected due to the achiral nature of both WS2 and the solvents used. As such we demonstrate a material with reconfigurable circular dichroism that can be readily integrated or applied within photonic and optoelectronic devices by a variety of different means.
Results and discussion
Starting from bulk WS2 particles, with dimensions around 1–10 microns, dispersions were produced in a range of solvents (most importantly isopropanol, chloroform and tetrahydrofuran), with a range of concentrations (from 0.1 mg mL−1 to 5 mg mL−1). To accurately compare the effect of different solvents, it was necessary to have homogeneous particle size distributions between samples. Hence, an initial dispersion was prepared with IPA as the solvent. To break down the material a process of ultrasonication (see ESI Methods†) was used with five, hour-long periods separated by 30 minutes each to prevent excessive heating of the solvents. The resultant dispersions were then put through a process of centrifugation to remove residual bulk material and narrow the distribution of particle sizes present in the dispersions and fractioned to ensure only suitably exfoliated particles remained. The resultant dispersion was then dried under vacuum to fully remove the solvent, before being re-dispersed in the required solvents for the final dispersions. After re-dispersion, the dispersions were again ultrasonicated (for a few minutes) to prevent any aggregated exfoliated particles remaining in the dispersions. As the concentration is changed significantly following the centrifugation step, it is necessary to re-establish the concentration following that step. The re-dispersion process also allowed for accurate knowledge of the concentrations of the dispersions, as a known mass could be directly added to a known volume of the solvent.Schlieren-like textures can be observed in the liquid crystals without the need for polarising optics with bright and dark regions corresponding to changes in reflectance of the sample due to alignment of the particles relative to the incident light used for imaging – shown here for dispersions in isopropanol- (Fig. 2) across a range of concentrations, from 5 mg mL−1 to 0.1 mg mL−1, with textures observed for all concentrations except the lowest. Similar textures are observed in other solvents. Such textures are equally observed in liquid crystals based on graphene oxide without requiring polarising optics.12 Under cross-polarised optical microscopy, after suitable control of the concentration by solvent evaporation, some evidence of liquid crystallinity was observed (ESI Fig. 4 and 5†).
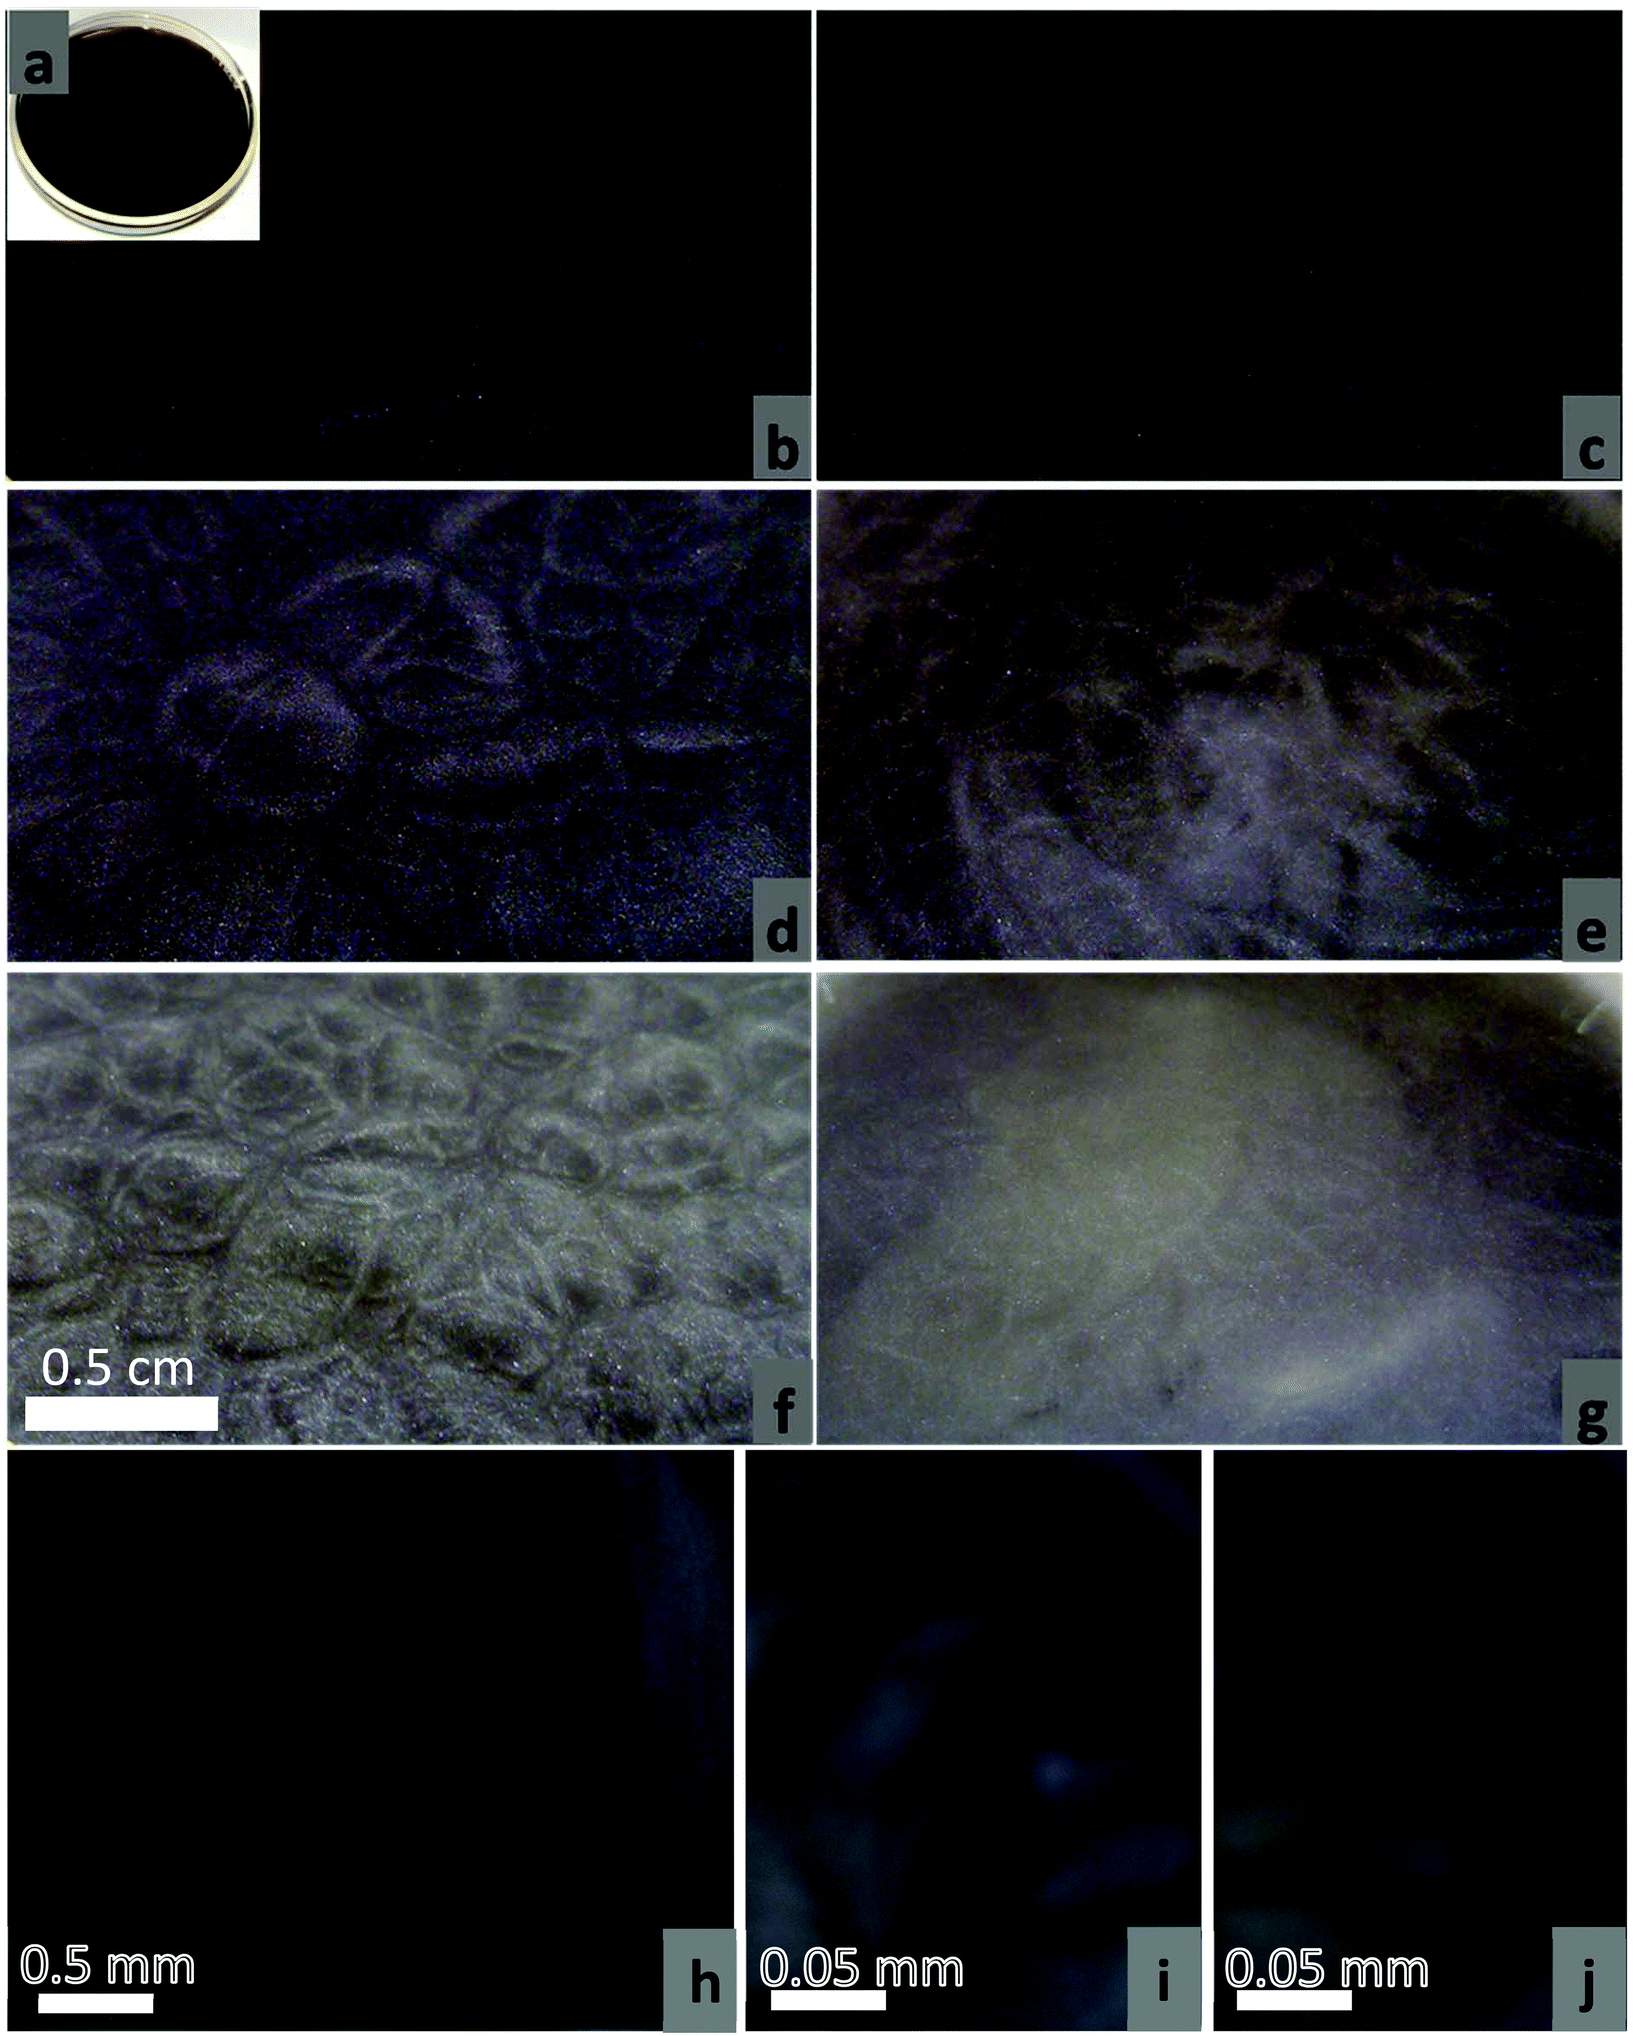 | ||
| Fig. 2 (a–g) Optical images of WS2 dispersions in isopropanol with clear bright and dark states visible depending on flake orientation relative to the incident light; (a) shows the texture across a large surface of the dispersion, (b–g) give a closer look at the surface for concentrations of 5 mg mL−1, 2.5 mg mL−1, 1 mg mL−1, 0.5 mg mL−1, 0.25 mg mL−1, and 0.1 mg mL−1 respectively. (h–j) Optical images (no polarisation) of tungsten disulfide dispersions in isopropanol at 5 mg mL−1 with clear bright and dark states visible depending on flake orientation relative to the incident light. | ||
In particular, samples in tetrahydrofuran (THF), isopropanol (IPA) and chloroform demonstrated promising properties with the dispersions showing general alignment of the individual particles when observed under optical microscopy (ESI Fig. 5†), and birefringent textures as would be expected for a liquid crystal (Fig. 2), hence these samples were chosen for further investigation. The linear dichroism spectra of the dispersions in THF, IPA and chloroform were measured in the visible range (200–800 nm). For these measurements, a quartz cuvette with a path length of 2 mm was filled with the dispersion and the transmission of light through it analysed. Bulk WS2 has no dichroic response, however dichroism can be induced after exfoliation due to the shape anisotropy of the resultant board-like particles (see ESI Methods†). In an isotropic distribution of particles in the dispersion, no dichroism would be observed as the orientation of the particles would be random. However, where there is an ordering of the particles relative to one another, a dichroic response can be observed; such ordering is the principle property determining liquid crystallinity. The dichroism is a product of the different effective refractive indices produced by particles being aligned with their short axes either parallel or perpendicular to the polarisation of the incident light. The dichroism is induced by self-assembly in the solvent, therefore we look at the composite effects of both the solvent and the dispersed particles. As such, the absorbance of the cuvette and solvents below 225 nm may mask any dichroism (see ESI Fig. 6b†). However, from a material application viewpoint, the dichroism can therefore be considered negligible in this region in any case. For reference, linear dichroism spectra for the pure solvents are presented in ESI Fig. 6a.†
As seen in Fig. 3a, linear dichroism can be observed across a broad range of wavelengths for dispersions in all three solvents. For these measurements, a concentration of 1 mg mL−1 was used for THF and a concentration of 5 mg mL−1 for IPA and chloroform. However, there is expected to be a significant concentration dependence of the liquid crystallinity. Hence, dispersions with a range of concentrations were measured, to establish where the onset occurs. Significant increases can be observed in the linear dichroism of dispersions in IPA (Fig. 3b) and chloroform (ESI Fig. 7†) as the concentration is increased from 0.1 mg mL−1 to 5 mg mL−1. However, no clear transition concentration from isotropic to liquid crystalline is observed. This is likely due to the non-homogeneous distribution of particle sizes present in the dispersion, leading to a broad region of biphasic stability where liquid crystallinity occurs in localised isolation rather than throughout the entirety of the dispersion. The effect of the particle size was investigated by comparing dispersions of exfoliated particles, with those of largely unexfoliated bulk material (see ESI Methods†) which still possessed some shape anisotropy. Unexfoliated particles dispersed in chloroform had typical sizes of 1–10 μm, with the mean size around 5 μm × 5 μm, determined from optical microscopy. Thickness was determined to be predominantly bulk-like from Raman spectroscopy by comparing the intensities of the E2g and A1g peaks and their corresponding shift frequencies.41–44 This method involves taking the ratio of the intensities of the two peaks, and the separation of the two in terms of wavenumber. These two values can then be compared to literature values which have been both calculated ab initio and corroborated by experiment for different layer thicknesses.41–44 The available data in the literature means that only numbers of layers from one to six can be differentiated accurately from bulk material. Determination of any shape anisotropy was not possible with Raman spectroscopy for which accurate determination of thickness is limited beyond ∼6 layers. Exfoliated particles dispersed in chloroform had typical dimensions of around 500 nm up to a few microns in length and width (as observed in microscopy characterisation) with mean size around 2 μm × 2 μm, and typical thicknesses of 1–6 layers as observed in Raman measurements again by comparing the intensities of the E2g and A1g peaks and their corresponding shift frequencies.41–44 However, characterisation also revealed the presence of occasional much larger particles with bulk like characteristics, and some particles <500 nm in length or width. Microscopy and Raman spectroscopy observations of sizes were also corroborated by dynamic light scattering measurements in the liquid phase dispersion (Fig. 3d). Dynamic light scattering (DLS) measurements were performed to analyse the particle sizes in the liquid phase dispersion, in addition to microscopy and Raman spectroscopy of individual drop-cast flakes. Sizes found from dynamic light scattering were in agreement with those obtained by the other methods. For example, for the dispersion in chloroform, broad peaks were observed at four different particle sizes: 3.98 nm; 93.9 nm; 320 nm; 1610 nm. The first peak is indicative of flakes on the order of few-layer thickness being present in the dispersion. The last peak is in agreement with the average flake lateral sizes being on the order of a micron. The other two peaks are consistent with the flakes <500 nm that were also observed. However, this technique cannot quantitatively analyse the numbers of particles possessing each size measured. Therefore, scanning electron microscopy (SEM) (ESI Fig. 1†) and atomic force microscopy (AFM) (ESI Fig. 2†) were used to corroborate the sizes determined, as discussed in the ESI.† Using SEM, the mean lateral particle size was determined to be 2.61 μm, while the mode of the particle size distribution was determined as 1.63 μm. This is in close agreement with the 1610 nm peak seen in the DLS spectrum. It was also noticed that there were some significantly smaller particles (<500 nm), which are likely responsible for the DLS peaks at 93.9 nm and 320 nm. These particles were excluded from the size analysis. From AFM analysis of a large number (578) of particles, a mean thickness of around 4.03 nm was observed (corresponding to 6.63 layers), again in close agreement with the peak in the DLS spectrum attributed to the particle thickness. Dispersions in other solvents showed very similar size distributions, as expected. It was also observed that there were significant differences in the shapes of the exfoliated particles produced.
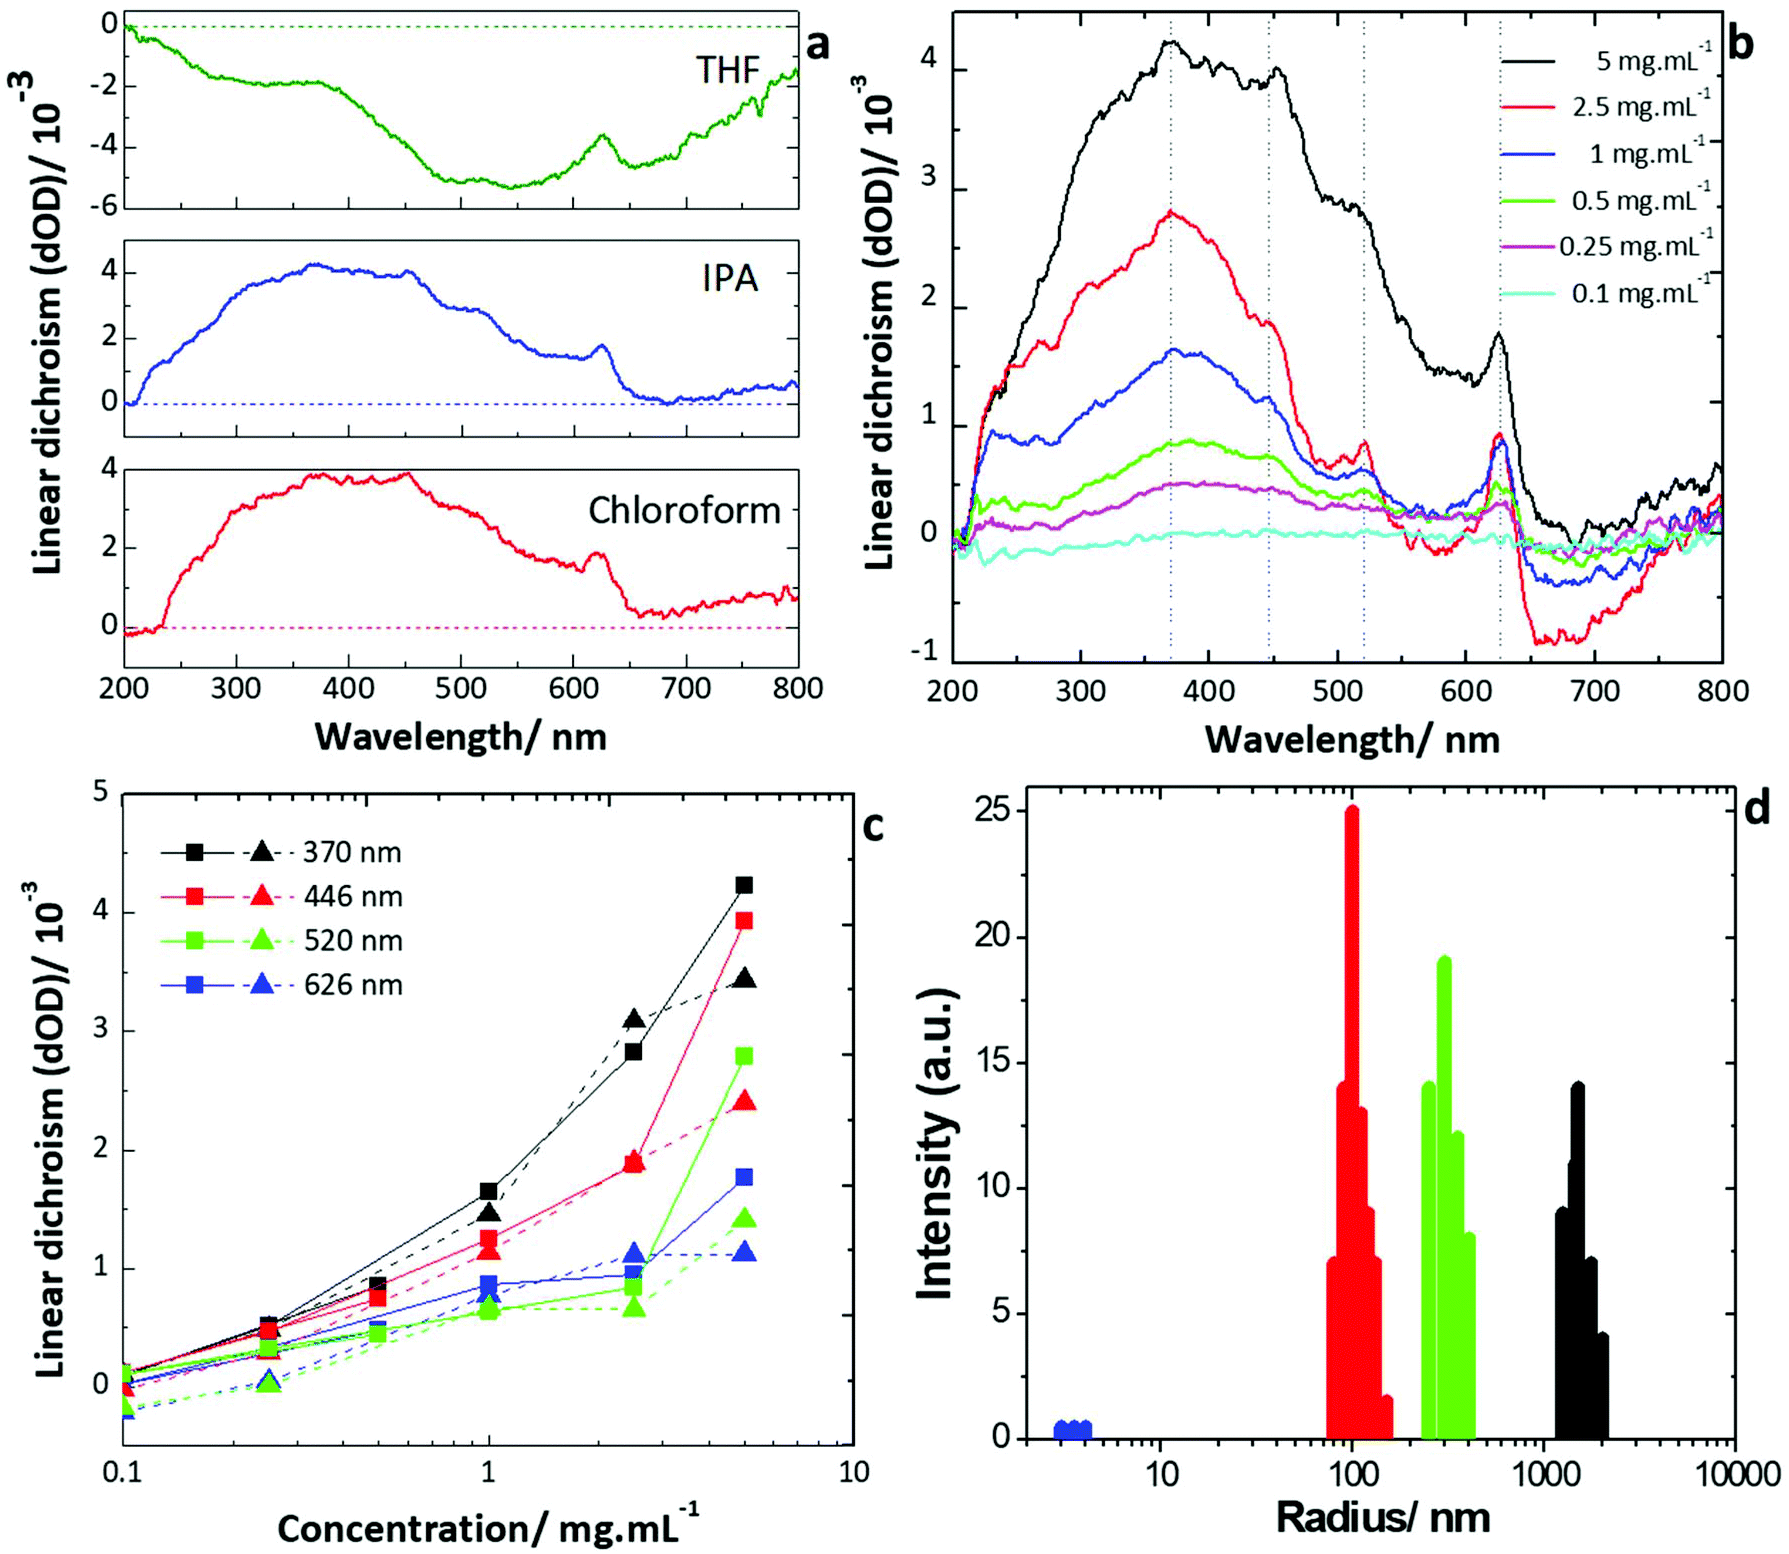 | ||
| Fig. 3 (a) Linear dichroism of WS2 dispersions in THF (1 mg mL−1), IPA (5 mg mL−1) and chloroform (5 mg mL−1). (b) Linear dichroism of dispersions of WS2 in IPA at different concentrations: 5 mg mL−1 (black); 2.5 mg mL−1 (red); 1 mg mL−1 (blue); 0.5 mg mL−1 (green); 0.25 mg mL−1 (magenta); 0.1 mg mL−1 (cyan). (c) Linear dichroism of dispersions of WS2 in IPA at specific wavelengths: 370 nm (black); 446 nm (red); 520 nm (green); 626 nm (blue). Solid lines (and squares) are for samples that had been exfoliated as described whereas dashed lines (and triangles) are for dispersions of much larger (unexfoliated) particles. Error bars are smaller than the symbol size. (d) Dynamic light scattering measurements of the sizes of the tungsten disulfide particles dispersed in chloroform. Four separate broad peaks are observed, centred at 3.98 nm (blue); 93.9 nm (red); 320 nm (green); 1610 nm (black). | ||
For lower concentrations, little difference is observed between the values of the linear dichroism recorded for the exfoliated and unexfoliated samples respectively (Fig. 3c, ESI Fig. 7b†). For all concentrations below 5 mg mL−1, the recorded difference is less than the noise level in the measurements. However, as the concentration was increased to 5 mg mL−1, significant increases in the linear dichroism were observed for both the exfoliated and unexfoliated dispersions. At this concentration, the exfoliated dispersion showed much stronger dichroism (up to two times greater) than the unexfoliated across the full wavelength range (Fig. 3c). For all samples, nanoparticle precipitation partially occurred due to the containment in the confined geometry of the cuvette, as observed from sedimentation after measurements. With continued precipitation over time, a trend towards the pure solvent spectrum would be expected and hence for the spectra to tend towards zero after normalisation. This is not observed in the spectra recorded and the results were consistent over time, hence there is negligible effect of the precipitation on the dichroism results obtained. It is suggested that the least colloidally stable tungsten disulfide particles precipitate rapidly within the confined geometry of the cuvette but that the resultant dispersion is then stable with time.
The circular dichroism of the samples was also analysed for the dispersions in THF, IPA and chloroform (spectra for the pure solvents are given in ESI Fig. 6c–e†). As can be seen in Fig. 4, circular dichroism was observed for all three solvents. Similar circular dichroism has previously been observed for liquid crystals of graphene oxide,1,23,45–48 where a twisted lamellar structure is proposed (Fig. 4d). In this structure, sheets of the 2D material form lamellar blocks of concentration dependent sizes. Separate blocks then arrange with a helical pitch between them, giving rise to a twisted ordering over long ranges; thus leading to circular dichroism. However, this mechanism is currently both disputed and unproven.2 Here, the inherent noise in the measurements due to absorption and scattering makes any qualitative analysis difficult. Whereas molecular chirality is related directly to the electronic transitions as seen in the absorption spectra of the molecule, for supramolecular chiral assemblies the chirality is related to the helical pitch of the structures – hence the chirality is unrelated to the absorption band of tungsten disulfide (measured in the liquid phase dispersion at 635 nm). By applying a magnetic field to the dispersions during measurement, significant (up to 6×) enhancement of the circular dichroism is observed for IPA, with a clear broad band emerging for wavelengths >500 nm. However, for the dispersion in THF, the application of the magnetic field is seen to have a negligible effect on the circular dichroism. The magnetic field was applied parallel to the incident light in the measurements (Faraday geometry), i.e. at normal incidence to the face of the cuvette. Under applied magnetic field, especially for dispersions in IPA, the circular dichroism can be enhanced due to an aligning force giving a preferred directional axis for the helicity (Fig. 4d). Enhancement of the circular dichroism by up to six times is observed in the dispersion in IPA in the region from 500–800 nm where the strongest circular dichroism is observed. The dispersion in THF however, shows negligible enhancement under magnetic field. The dispersion in chloroform also shows negligible enhancement in the region from 500–800 nm. Broad widths of the circular dichroic bands are expected due to the non-homogeneity of the particle sizes present in the dispersion.
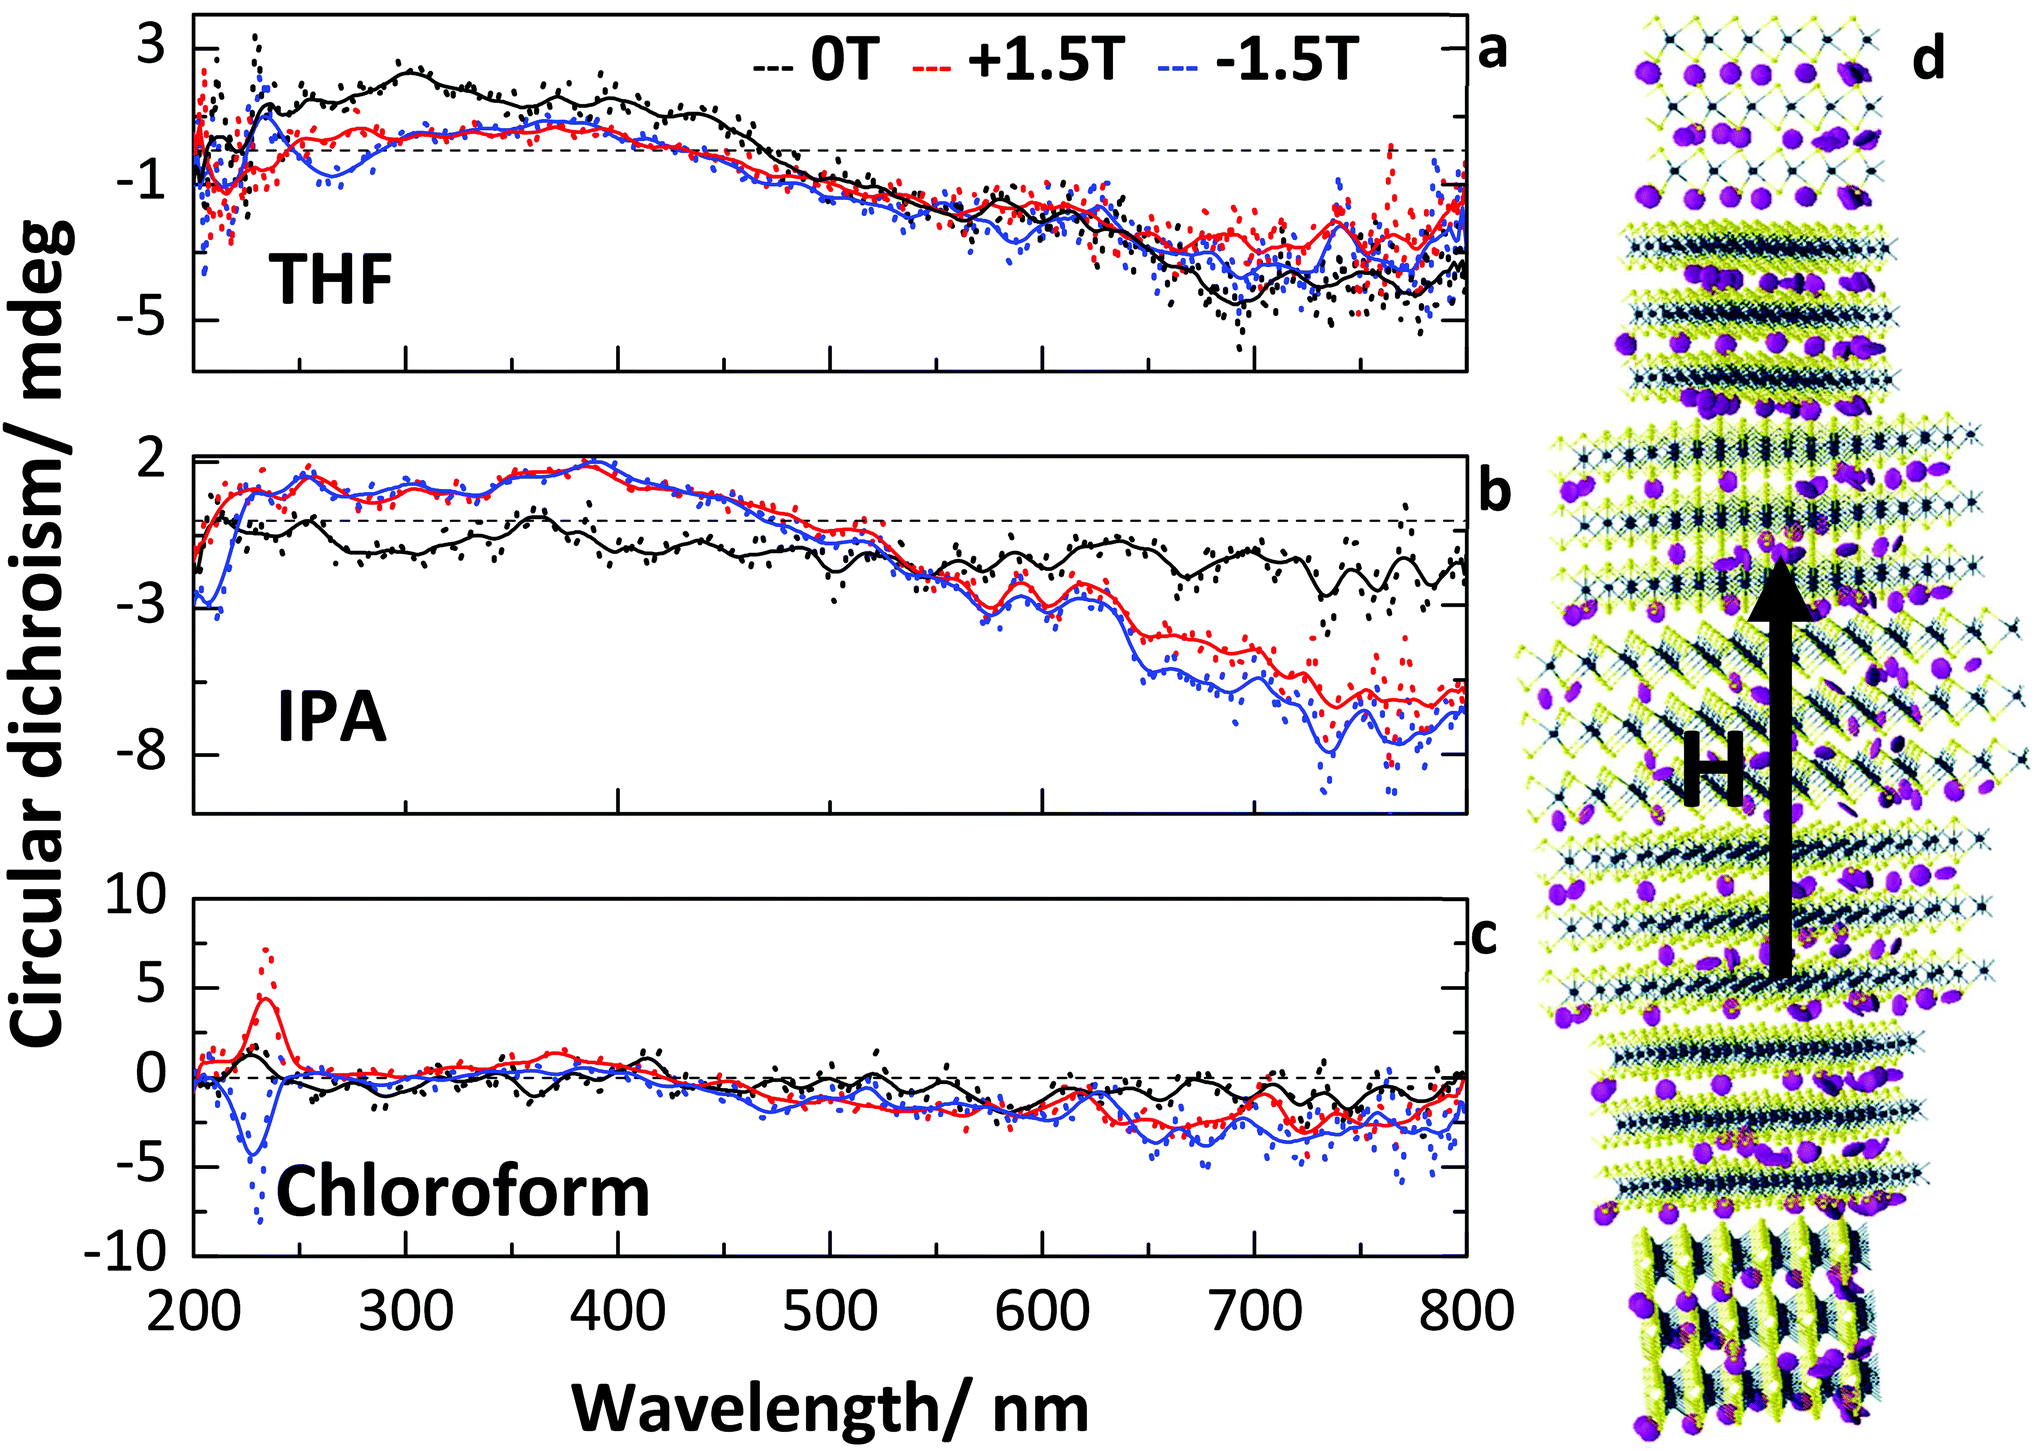 | ||
| Fig. 4 Circular dichroism of dispersions of WS2in different solvents: (a) THF, (b) IPA and (c) chloroform, under applied fields of 0 T (black), +1.5 T (red) and −1.5 T (blue). Dashed lines are normalised data including noise, solid lines give an indication of the general trend of the circular dichroism accounting for the noise. (d) A possible structure of the circular dichroic self-assembly of tungsten disulfide liquid crystalline dispersions under applied magnetic field. | ||
Additionally, for the dispersion in chloroform under the applied magnetic field, a very strong peak in the circular dichroism is observed at around 230 nm. This peak switches sign with the applied field. The peak can also be observed in the pure solvent, however, as results are normalized versus the pure solvent spectrum there is enhancement observed due to the presence of the dispersed nanoparticles. However, it is the properties of the composite liquid crystalline system that are of interest, hence it is justifiable that the composite system of tungsten disulfide dispersed in chloroform represents a magnetically reconfigurable chiral material.
While different solvents can affect the rate, efficiency and quality of particles obtained by liquid phase exfoliation, due to the fact that controlling the concentration generally relies on drying and redispersion the solvent choice for obtaining a liquid crystalline state can be independent of that for exfoliation. The different properties achievable with different solvents show that there is no single definable ‘best’ solvent for use. Rather, the choice of solvent should be application driven. For example, to achieve reconfigurable circular dichroism at 750 nm, IPA would be the best choice, whereas at 230 nm chloroform is preferable. The single condition is that WS2 should be soluble enough to allow dispersion at the necessary concentrations, which is broadly true for all organic solvents.
To demonstrate one area where the liquid crystalline dispersions could find application, dispersions were filtered from the dispersion in IPA at 5 mg mL−1, to produce homogeneous thin films from stacked layers of few-layer WS2. Such films have been widely explored for different two-dimensional materials, and liquid crystalline dispersions of graphene oxide and molybdenum disulfide have been shown to produce higher quality films than non-LC dispersions.8,10,49 These thin films were then readily transferred to substrates (Fig. 5a–c), following the methodology described by Shin et al.,50 marking a facile and scalable method towards large scale integration of the two-dimensional material. Films transferred from the LC state show far greater homogeneity than those from non-LC (see ESI Methods†) dispersions (Fig. 5c). By using liquid crystalline dispersions for filtering, as opposed to non-liquid crystalline dispersions, a significant increase in the homogeneity of the deposited films is observed. Importantly, individual flakes of WS2 exfoliated by liquid phase exfoliation can be photoluminescent when deposited from the liquid crystal state (Fig. 5d), as is also observed for flakes produced by other methods. After transfer to a substrate, Raman spectroscopy mapping (Fig. 5e and f, ESI Fig. 8 and 9†) of the surface shows complete coverage across large areas – evidenced by the presence of both the A1g and E2g peaks expected for WS2 – with the variation in signal owing to differing numbers of layers present and surface roughness causing changes in focus. The ability to cover large areas with few- or monolayer WS2 opens up great possibilities in photovoltaic devices, owing to the photoluminescence of WS2 in the visible range. WS2 is also a promising material for terahertz (THz) applications51 as this field is currently experiencing both rapid growth, while also suffering from a lack of suitable materials for laser-induced generation, detection, and conversion of terahertz radiation. The terahertz frequency range has noteworthy applications for use in non-invasive medicine control, safety and ultrafast information transfer systems. Using the methods discussed in the ESI (ESI Fig. 10 and 11†), the transmission of a thin WS2 film transferred to a Kapton substrate was measured (Fig. 5g). The Kapton substrate was chosen due to its low absorption in the terahertz region from 0.1 to 2.5 THz. It can be observed that the WS2 film is transparent in the broadband region from 0.1 to 1.0 THz. Transparency in the THz range is very useful for generation, detection and modulation applications in THz devices. Drawing on the example of another common transparent 2D material, graphene, the use of such thin layers has been shown to increase the efficiency of the optic-THz conversion,52 allow control of the polarization and modulate THz radiation.53 WS2 is also interesting to consider in terms of another effect; the influence of the magnetic part of the electromagnetic field in the THz range is more perceptible than in visible range, so theoretically the influence of the terahertz magnetic field in such magnetically sensitive materials (WS2) can be determined. If chirality exists in the visible range, it also can be present in the THz region. We can assume that with the help of WS2 it will be possible to control the magnetic field of a THz pulse, as shown in the concept of spin-current driven THz oscillator devices.54
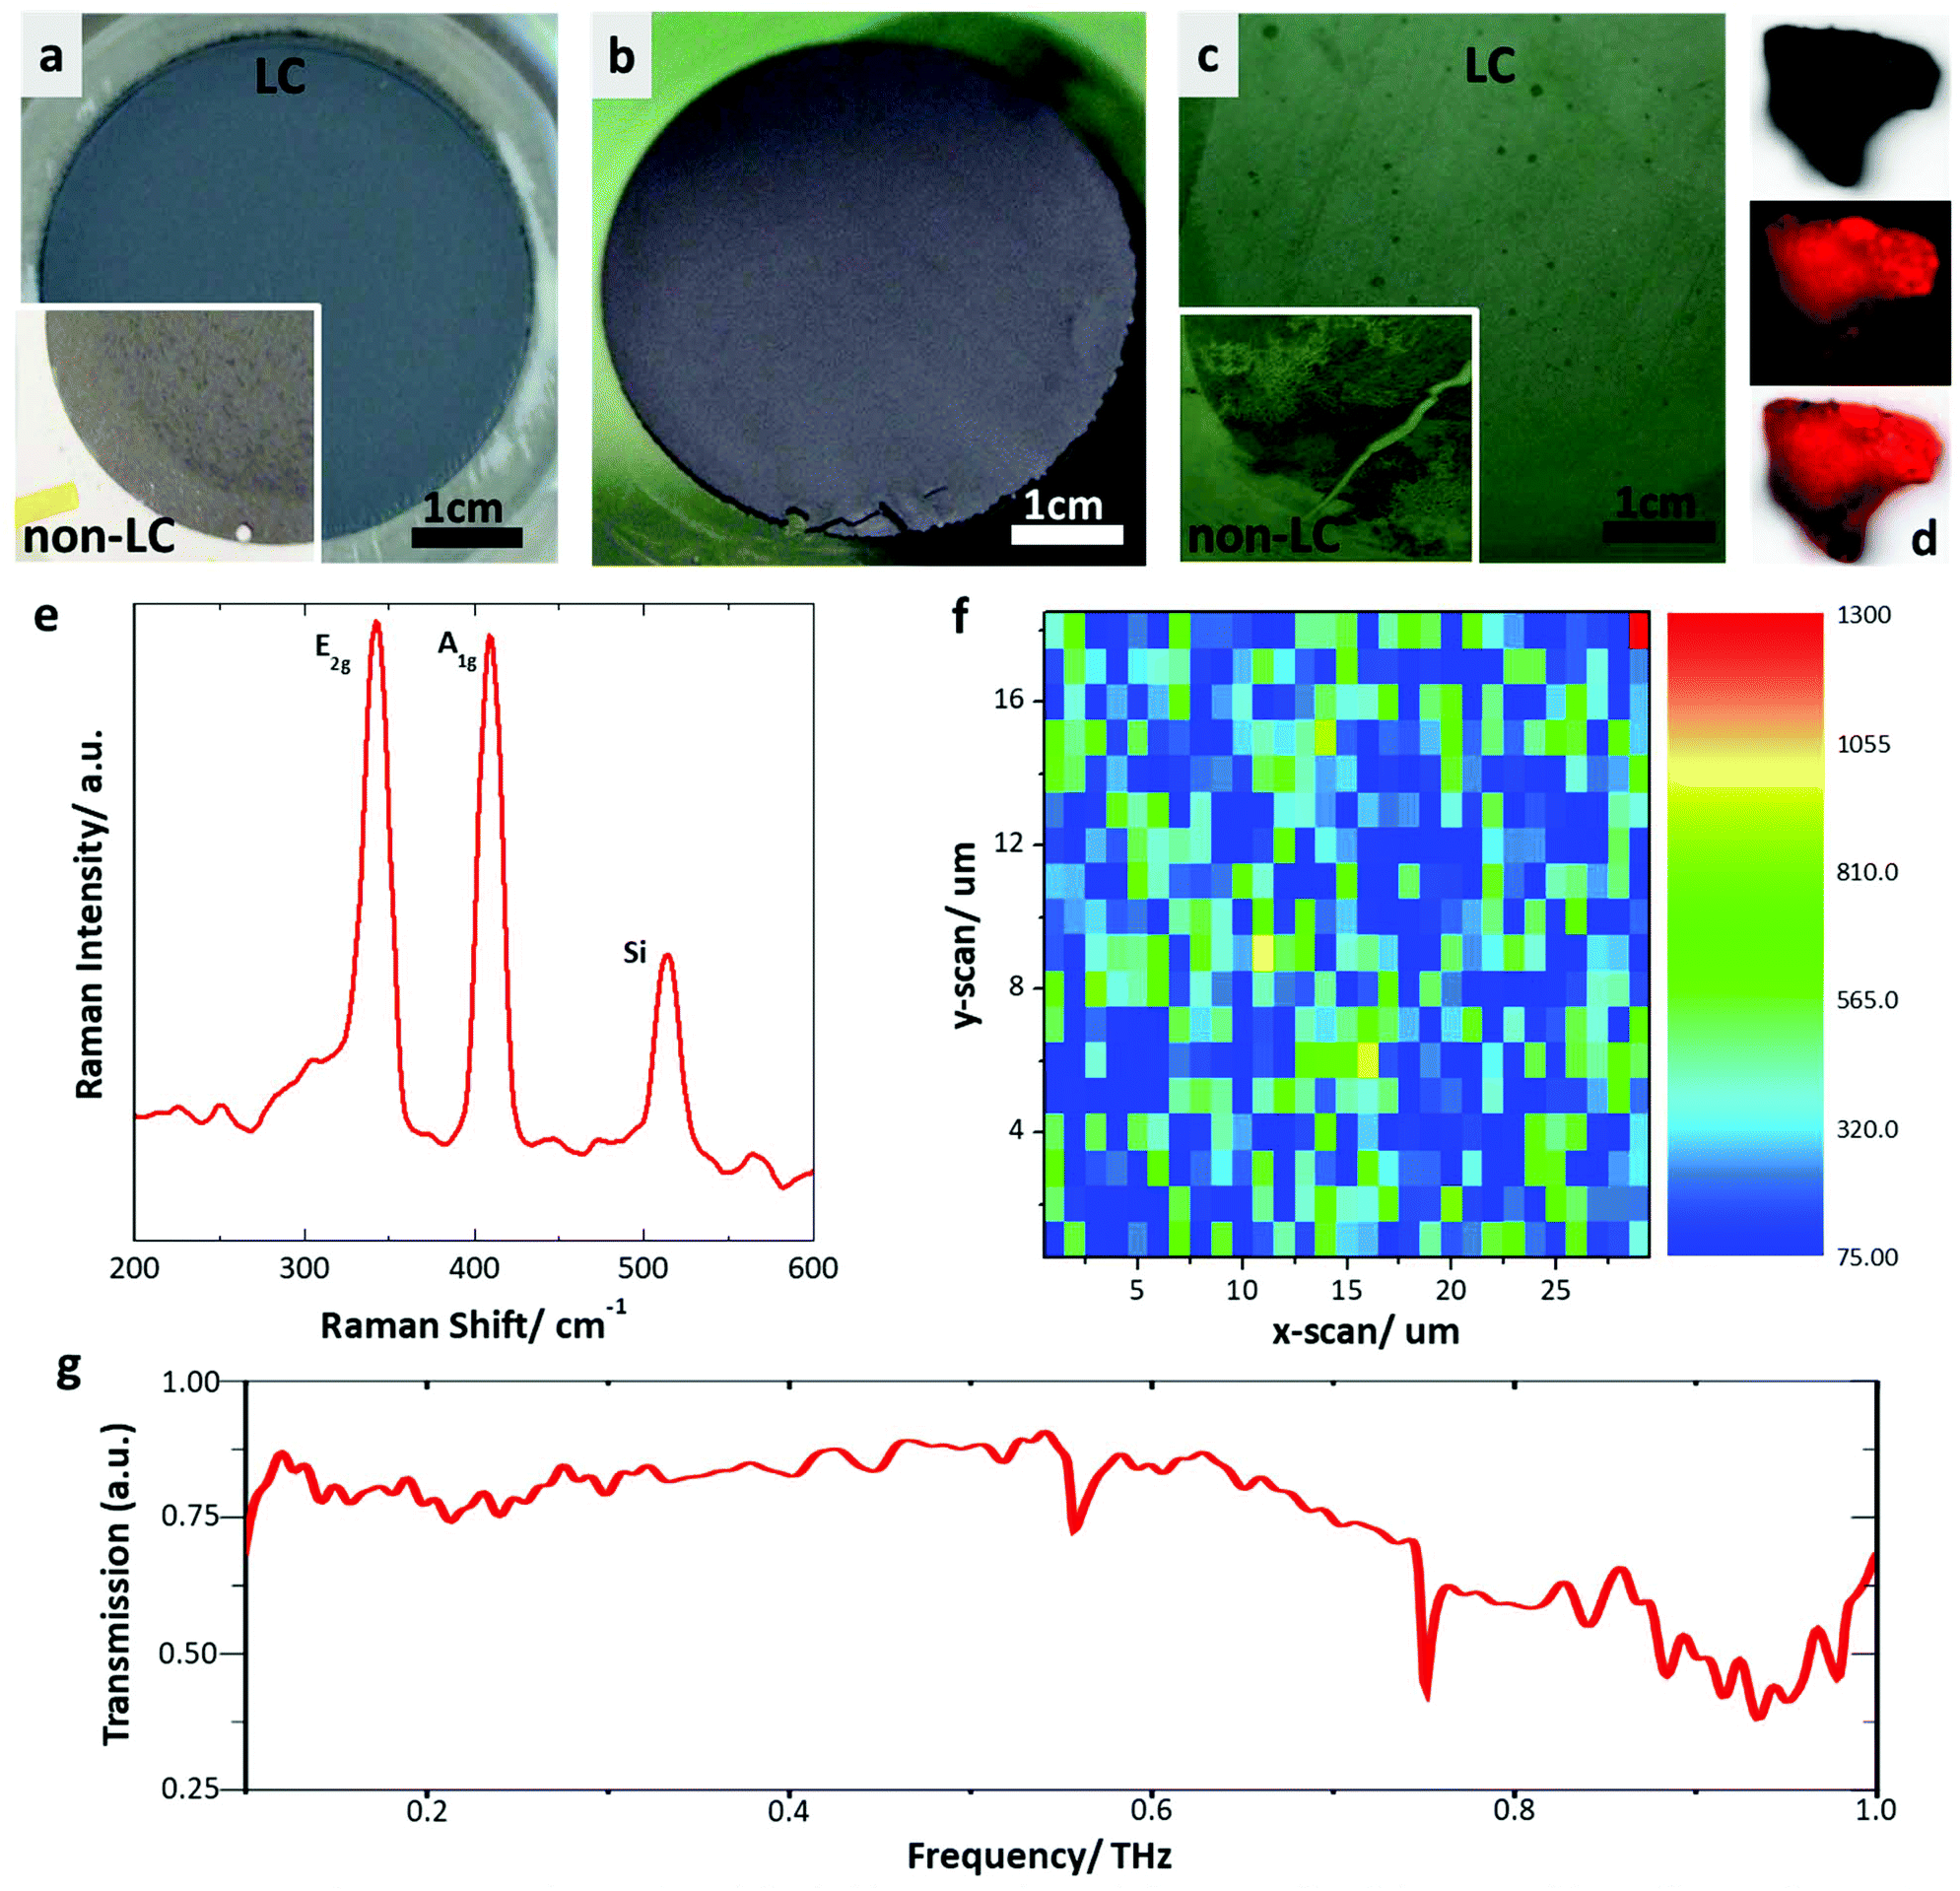 | ||
| Fig. 5 (a–c) Progression of a dried film produced from a liquid crystalline dispersion of tungsten disulphide: (a) deposition onto filter from an LC dispersion, inset-a deposition onto the filter from a non-LC dispersion, (b) the resultant film; (c) a considerably thinner film produced by the same method from the liquid crystalline phase, inset-the film produced from the non-LC filtrate. (d) Photoluminescence of a single representative flake from the liquid crystalline phase. (e) Raman spectrum of few-layer WS2 showing the two expected peaks in addition to a silicon peak. (f) Raman map of the E2g peak of WS2 showing coverage across the whole surface for an area of 29 μm × 18 μm. (g) Transmission in the terahertz regime, through a thin film of WS2 transferred onto a Kapton substrate. Measurement is relative to an air reference. | ||
The films give comparable results to those produced previously by other methods such as chemical vapour deposition, but also have significant further benefits such as: greater scalability; reduced cost; high homogeneity; and a fine control of the film thickness spanning multiple orders of magnitude. Such films could therefore find applications in Terahertz modulation devices.
This work demonstrates that using only standard liquid phase exfoliation processes (ultrasonication, centrifugation and control of concentration) a liquid crystalline state of WS2 particles can be achieved in a range of solvents. The discovery that WS2 LC dispersions can simultaneously demonstrate reconfigurability under applied magnetic field and circular dichroism, while also combining the intrinsic optical and electrical properties of the 2D WS2 flakes is of significant interest, opening the way towards countless applications in opto-electronics and photonics such as switchable filtering devices. Future optimisation and tuning of the synthesis holds great potential for the generation of a new class of true reconfigurable ‘wonder materials’, with applications encompassing: thin film and membrane depositions; display devices; inks; terahertz modulators; and others. The discovery of this novel reconfigurable phase could lead to a marked expansion in the uptake of WS2 for device-based applications, due to the increased scope for scalable integration with reduced drawbacks such as time, cost and quality as well as the significant boost in the range of potential uses with the observation of reconfigurable circular dichroism.
Author contributions
The manuscript was written through contributions of all authors. All authors have given approval to the final version of the manuscript.Abbreviations
| 2D | Two-dimensional |
| TMD | Transition metal dichalcogenide |
| WS2 | Tungsten disulfide |
| IPA | Isopropanol |
| THF | Tetrahydrofuran |
| LC | Liquid crystal |
Conflicts of interest
There are no conflicts to declare.Acknowledgements
We acknowledge financial support from: The Engineering and Physical Sciences Research Council (EPSRC) of the United Kingdom via the EPSRC Centre for Doctoral Training in Electromagnetic Metamaterials (Grant No. EP/L015331/1) and via Grant No. EP/N035569/1, EP/G036101/1 and EP/M002438/1, and the Royal Society International Exchange Grant 2016/R1.References
- B. T. Hogan, E. Kovalska, M. F. Craciun and A. Baldycheva, 2D material liquid crystals for optoelectronics and photonics, J. Mater. Chem. C, 2017, 5, 11185–11195 RSC.
- I. Dierking and S. Al-Zangana, Lyotropic Liquid Crystal Phases from Anisotropic Nanomaterials, Nanomaterials, 2017, 7, 305 CrossRef PubMed.
- A. C. Ferrari, et al., Science and technology roadmap for graphene, related two-dimensional crystals, and hybrid systems, Nanoscale, 2015, 7, 4598–4810 RSC.
- B. T. Hogan, et al., Dynamic in situ sensing of fluid-dispersed 2D materials integrated on microfluidic Si chip, Sci. Rep., 2017, 7, 42120 CrossRef CAS PubMed.
- Y. H. Fu, et al., A Micromachined Reconfigurable Metamaterial via Reconfiguration of Asymmetric Split-Ring Resonators, Adv. Funct. Mater., 2011, 21, 3589–3594 CrossRef CAS.
- C. Zakri, et al., Liquid crystals of carbon nanotubes and graphene, Philos. Trans. R. Soc., A, 2013, 371, 20120499 CrossRef PubMed.
- N. Behabtu, et al., Spontaneous high-concentration dispersions and liquid crystals of graphene, Nat. Nanotechnol., 2010, 5, 406–411 CrossRef CAS PubMed.
- R. Jalili, et al., Processable 2D materials beyond graphene: MoS 2 liquid crystals and fibres, Nanoscale, 2016, 8, 16862–16867 RSC.
- V. G. Kravets, et al., Engineering optical properties of a graphene oxide metamaterial assembled in microfluidic channels, Opt. Express, 2015, 23, 1265 CrossRef CAS PubMed.
- A. Akbari, et al., Large-area graphene-based nanofiltration membranes by shear alignment of discotic nematic liquid crystals of graphene oxide, Nat. Commun., 2016, 7, 10891 CrossRef CAS PubMed.
- F. Lin, X. Tong, Y. Wang, J. Bao and Z. M. Wang, Graphene oxide liquid crystals: synthesis, phase transition, rheological property, and applications in optoelectronics and display, Nanoscale Res. Lett., 2015, 10, 435 CrossRef PubMed.
- L. He, et al., Graphene oxide liquid crystals for reflective displays without polarizing optics, Nanoscale, 2015, 7, 1616–1622 RSC.
- T.-Z. Shen, S.-H. Hong and J.-K. Song, Electro-optical switching of graphene oxide liquid crystals with an extremely large Kerr coefficient, Nat. Mater., 2014, 13, 394–399 CrossRef CAS PubMed.
- Z. Xu and C. Gao, Aqueous Liquid Crystals of Graphene Oxide, ACS Nano, 2011, 5, 2908–2915 CrossRef CAS PubMed.
- J. E. Kim, et al., Graphene Oxide Liquid Crystals, Angew. Chem., Int. Ed., 2011, 50, 3043–3047 CrossRef CAS PubMed.
- R. Narayan, J. E. Kim, J. Y. Kim, K. E. Lee and S. O. Kim, Graphene Oxide Liquid Crystals: Discovery, Evolution and Applications, Adv. Mater., 2016, 28, 3045–3068 CrossRef CAS PubMed.
- Z. Xu and C. Gao, Graphene in macroscopic order: Liquid crystals and wet-spun fibers, Acc. Chem. Res., 2014, 47, 1267–1276 CrossRef CAS PubMed.
- M. J. Kim, J. H. Park, J. Yamamoto, Y. S. Kim and G. Scalia, Electro-optic switching with liquid crystal graphene, Phys. Status Solidi RRL, 2016, 10, 397–403 CrossRef CAS.
- L. Onsager, The effects of shape on the interaction of colloidal particles, Ann. N. Y. Acad. Sci., 1949, 51, 627–659 CrossRef CAS.
- H. N. W. Lekkerkerker, F. M. van der Kooij and K. Kassapidou, Liquid crystal phase transitions in suspensions of polydisperse plate-likeparticles, Nature, 2000, 406, 868–871 CrossRef PubMed.
- M. A. Bates and D. Frenkel, Nematic–isotropic transition in polydisperse systems of infinitely thin hard platelets, J. Chem. Phys., 1999, 110, 6553 CrossRef CAS.
- N. Mounet, et al. Two-dimensional materials from high-throughput computational exfoliation of experimentally known compounds, Nat. Nanotechnol., 2018, 13, 246–252 CrossRef CAS PubMed.
- Z. Xu and C. Gao, Graphene chiral liquid crystals and macroscopic assembled fibres, Nat. Commun., 2011, 2, 571 CrossRef PubMed.
- A. Zannotti, F. Diebel, M. Boguslawski and C. Denz, Chiral Light in Helically Twisted Photonic Lattices, Adv. Opt. Mater., 2017, 5, 1600629 CrossRef.
- A. Passaseo, M. Esposito, M. Cuscunà and V. Tasco, Materials and 3D Designs of Helix Nanostructures for Chirality at Optical Frequencies, Adv. Opt. Mater., 2017, 5, 1601079 CrossRef.
- J. Ge, L. He, J. Goebl and Y. Yin, Assembly of Magnetically Tunable Photonic Crystals in Nonpolar Solvents, J. Am. Chem. Soc., 2009, 131, 3484–3486 CrossRef CAS PubMed.
- C.-Y. Chen, C.-F. Hsieh, Y.-F. Lin, R.-P. Pan and C.-L. Pan, Magnetically tunable room-temperature 2 pi liquid crystal terahertz phase shifter, Opt. Express, 2004, 12, 2625 CrossRef PubMed.
- Y. Yu, P. W. K. Fong, S. Wang and C. Surya, Fabrication of WS2/GaN p-n Junction by Wafer-Scale WS2 Thin Film Transfer, Sci. Rep., 2016, 6, 37833 CrossRef CAS PubMed.
- J.-G. Song, et al., Layer-Controlled, Wafer-Scale, and Conformal Synthesis of Tungsten Disulfide Nanosheets Using Atomic Layer Deposition, ACS Nano, 2013, 7, 11333–11340 CrossRef CAS PubMed.
- F. Xia, H. Wang, D. Xiao, M. Dubey and A. Ramasubramaniam, Two-dimensional material nanophotonics, Nat. Photonics, 2014, 8, 899–907 CrossRef CAS.
- T. Georgiou, et al., Vertical field-effect transistor based on graphene–WS2 heterostructures for flexible and transparent electronics, Nat. Nanotechnol., 2012, 8, 100–103 CrossRef PubMed.
- S. Ratha and C. S. Rout, Supercapacitor Electrodes Based on Layered Tungsten Disulfide-Reduced Graphene Oxide Hybrids Synthesized by a Facile Hydrothermal Method, ACS Appl. Mater. Interfaces, 2013, 5, 11427–11433 CrossRef CAS PubMed.
- D. Merki and X. Hu, Recent developments of molybdenum and tungsten sulfides as hydrogen evolution catalysts, Energy Environ. Sci., 2011, 4, 3878 RSC.
- P. Yan, et al., Microfiber-based WS_2-film saturable absorber for ultra-fast photonics, Opt. Mater. Express, 2015, 5, 479 CrossRef.
- R. Bhandavat, L. David and G. Singh, Synthesis of Surface-Functionalized WS 2 Nanosheets and Performance as Li-Ion Battery Anodes, J. Phys. Chem. Lett., 2012, 3, 1523–1530 CrossRef CAS PubMed.
- S. M. Notley, High yield production of photoluminescent tungsten disulphide nanoparticles, J. Colloid Interface Sci., 2013, 396, 160–164 CrossRef CAS PubMed.
- R. L. Wilson, C. Kemball and A. K. Galwey, Catalytic exchange of hydrogen sulphide and of hydrogen with deuterium on disulphides of molybdenum and tungsten, Trans. Faraday Soc., 1962, 58, 583 RSC.
- P. Kieran and C. Kemball, Some catalytic reactions of thiophene on disulfides of tungsten and molybdenum, J. Catal., 1965, 4, 394–402 CrossRef CAS.
- R. Tenne, L. Margulis, M. Genut and G. Hodes, Polyhedral and cylindrical structures of tungsten disulphide, Nature, 1992, 360, 444–446 CrossRef CAS.
- E. D. Grayfer, M. N. Kozlova and V. E. Fedorov, Colloidal 2D nanosheets of MoS 2 and other transition metal dichalcogenides through liquid-phase exfoliation, Adv. Colloid Interface Sci., 2017, 245, 40–61 CrossRef CAS PubMed.
- M. R. Molas, K. Nogajewski, M. Potemski and A. Babiński, Raman scattering excitation spectroscopy of monolayer WS2, Sci. Rep., 2017, 7, 5036 CrossRef PubMed.
- Y. Li, et al., Accurate identification of layer number for few-layer WS2 and WSe2 via spectroscopic study, Nanotechnology, 2018, 29, 124001 CrossRef PubMed.
- L. Liang and V. Meunier, First-principles Raman spectra of MoS2, WS2 and their heterostructures, Nanoscale, 2014, 6, 5394 RSC.
- A. Berkdemir, et al., Identification of individual and few layers of WS2 using Raman Spectroscopy, Sci. Rep., 2013, 3, 1755 CrossRef.
- S. Padmajan Sasikala, et al. Graphene oxide liquid crystals: a frontier 2D soft material for graphene-based functional materials, Chem. Soc. Rev., 2018, 47, 6013–6045 RSC.
- P. Kumar, U. N. Maiti, K. E. Lee and S. O. Kim, Rheological properties of graphene oxide liquid crystal, Carbon, 2014, 80, 453–461 CrossRef CAS.
- K. E. Lee and S. O. Kim, Graphene Oxide Liquid Crystals Special Issue, Editorial. Part, Part. Syst. Charact., 2017, 34, 1700261 CrossRef.
- K. E. Lee, et al., Liquid Crystal Size Selection of Large-Size Graphene Oxide for Size-Dependent N-Doping and Oxygen Reduction Catalysis, ACS Nano, 2014, 8, 9073–9080 CrossRef CAS PubMed.
- K. Fu, et al., Graphene Oxide-Based Electrode Inks for 3D-Printed Lithium-Ion Batteries, Adv. Mater., 2016, 28, 2587–2594 CrossRef CAS PubMed.
- D.-W. Shin, et al., A New Facile Route to Flexible and Semi-Transparent Electrodes Based on Water Exfoliated Graphene and their Single-Electrode Triboelectric Nanogenerator, Adv. Mater., 2018, 30, 1802953 CrossRef PubMed.
- D.-S. Yang, T. Jiang and X.-A. Cheng, Optically controlled terahertz modulator by liquid-exfoliated multilayer WS_2 nanosheets, Opt. Express, 2017, 25, 16364 CrossRef CAS PubMed.
- J. Tong, M. Muthee, S.-Y. Chen, S. K. Yngvesson and J. Yan, Antenna Enhanced Graphene THz Emitter and Detector, Nano Lett., 2015, 15, 5295–5301 CrossRef CAS PubMed.
- P. P. Kuzhir, et al., Main principles of passive devices based on graphene and carbon films in microwave—THz frequency range, J. Nanophotonics, 2017, 11, 032504 CrossRef.
- J. Walowski and M. Münzenberg, Perspective: Ultrafast magnetism and THz spintronics, J. Appl. Phys., 2016, 120, 140901 CrossRef.
Footnote |
| † Electronic supplementary information (ESI) available: Supplementary discussion of methods and theory. See DOI: 10.1039/c8nr07205a |
| This journal is © The Royal Society of Chemistry 2019 |