Exploitation of localized surface plasmon resonance of silver/gold nanoparticles for the fluorescence quantification of angiotensin II receptor antagonists in their tablets and bio-samples
N. A.
Alarfaj
,
S. A.
Altamimi
,
M. F.
El-Tohamy†
 * and
A. M.
Almahri
Department of Chemistry, College of Science, King Saud University, P.O. Box 22452, Riyadh 11495, Saudi Arabia. E-mail: nalarfaj@hotmail.com; Saltamimi@ksu.edu.sa; bandor_2003@hotmail.com; star2000star@gmail.com
First published on 4th December 2018
Abstract
The present study suggested six different fluorimetric systems for the determination of three angiotensin II receptor antagonists, candesartan cilexetil (CDC), valsartan (VAL) and telmisartan (TEL) in their bulk and pharmaceutical dosage forms. The fluorescence intensities (FIs) were recorded by measuring the high catalytic potential activity of silver or gold nanoparticles (AgNPs or AuNPs) at λex 525, 420 and 330 nm and λem 555, 490 and 400 nm for CDC, VAL and TEL, respectively. All experimental measurements were carried out under optimum conditions using the CDC–Tb(III)–AgNPs, CDC–Tb(III)–AuNPs, VAL–Eu(III)–AgNPs, VAL–Eu(III)–AuNPs, TEL–SDS–AgNPs and TEL–SDS–AuNPs systems. The fluorescence (FL) signals displayed linear concentration ranges of 0.01–300, 0.02–120 and 2.0–30 ng mL−1 for CDC, VAL and TEL in the presence of AgNPs, respectively, and 0.05–60, 0.1–80 and 0.1–250 ng mL−1 for the same drugs in the presence of AuNPs, respectively. The influence of possible coexisting species and additives was tested. ICH guidelines were followed to validate the developed methods. All suggested FL systems were successfully used to monitor the investigated drugs in bulk, tablets and bio-samples. The obtained data were compared with those of other reported methods revealing high agreement.
1. Introduction
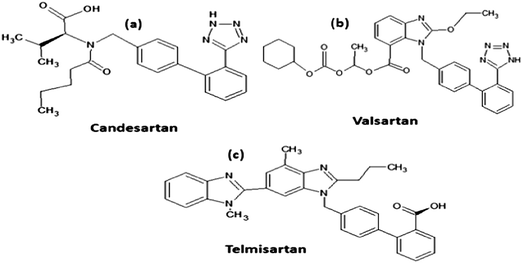
Hypertension is a term used to describe the elevation of blood pressure that is conducted by the flow of blood at different levels and does not stay at the same level at all times. It is regarded as a mortal disease, due to its association with other diseases such as coronary heart disease, and brain and renal diseases.1Angiotensin II receptor antagonist medication is a newer group of medicines that is recommended to control and reduce the elevation of arterial blood pressure.2 This study determined three different angiotensin II receptor antagonist drugs (Fig. 1a–c), candesartan cilexetil (CDC), valsartan (VAL) and telmisartan (TEL).
Both CDC and VAL are recommended orally and used to lower the blood pressure by decreasing the contraction of blood vessels. They are also effective in the treatment of myocardial infarction and heart failure.3,4 However, TEL facilitates the blood movement by preventing the action of certain chemicals that tighten the blood vessels.5
Up to now, the reported articles revealed several analytical approaches for the quantification of the investigated drugs, including, chromatographic separation techniques such as high performance liquid chromatography6–11 and capillary electrophoresis.12–14 However, these chromatographic approaches still have many drawbacks. They are complicated techniques, time consuming and require highly skilled analysts. Some electrochemistry articles concerned with the determination of the investigated drugs have suggested techniques such as voltammetricmethods.15–17
But unfortunately, these techniques displayed environmental toxicity and some errors in analysis.
Various spectroscopic methods for the determination of CDC, VAL and TEL were published, including spectrophotometric methods,18–20 spectrofluorometric methods21–26 and chemiluminescence.27 These spectroscopic approaches were based on first derivative synchronous, or direct native measurements.
Recently, nanoscience or the impact role of nanoscale materials has become one of the most prominent areas of research in analytical science. Many scientists began to concentrate their studies on the unique features of these nanomaterials and their wide applications in our life.28 It should be mentioned that, when a light with a specific wavelength falls on nanoparticles, the conduction features of electrons on the metal surface undergo a collective oscillation inducing surface plasmon resonance (SPR) which is responsible for the unique characteristics of nanoparticles and the change in color of the particles as a result of the particle size reduction and the alternation of refractive index.29 The catalytic activities of AgNPs and AuNPs and their optical properties have been reported in various articles which are concerned with their unique features in the field of analytical chemistry.30–33 Currently, FL spectroscopy methods find their application in the fields of biomedical, medical and chemical research for analyzing pharmaceutical compounds.
This analytical approach aimed to suggest different FL systems based on the catalytic effect of synthesized AgNPs and AuNPs on the FL signals through the determination of the selected angiotensin II antagonist drugs (CDC, VAL and TEL). The FL methods were validated and utilized for the determination of the selected drugs in their pharmaceutical tablets and bio-samples.
2. Experimental
2.1. Equipment
The FIs were measured using a Shimadzu RF-5301 luminescence spectrometer (Kyoto, Japan), equipped with a 150W Xenon arc lamp, excitation grating and emission monochromators. A 1 cm quartz cell was used. The slit widths for both the excitation and emission monochromators were set at 5 nm. A HANNA pH meter (Romania) was used for pH adjustment. The obtained data were PC controlled and data acquisition was performed by FI Winlab software, version 4.00.03. A transmission electron microscope (TEM) model JEM-1400 plus (JEOL, USA) and a scanning electron microscope (SEM) model JSM-7610F (JEOL, USA) were employed to ensure and detect the formation of the nanoparticles.2.2. Materials and reagents
Pure grade of each of CDC, VAL and TEL and their pharmaceutical preparations (Atacand® 16 mg per tablet, Diovan® 40 mg per tablet and Micardis® 40 mg per tablet) were kindly supplied by Tabuk Pharmaceutical Co., Saudi Arabia. Isopropanol (99.5%), methanol (99.8%), ethanol (96.0%), acetonitrile, acetone, dimethysulfoxide (DMSO), boric acid, sodium tetraborate, acetic acid, sodium acetate, sodium hydroxide, sodium dihydrogen phosphate, sodium carbonate, sodium bicarbonate, sodium borohydride and silver nitrate were purchased from BDH Ltd (Poole, UK). Chloroform was purchased from Fluka (Solothurn, Switzerland). Sodium dodecyl sulfate (SDS 95.0%), cetyltrimethyl ammonium bromide (CTAB, 99.0%), methyl cellulose (MC), Tween-80, cetylpridinium chloride, chloroaurate hexahydrate, europium chloride (EuCl3) and terbium(III) chloride (TbCl3) were acquired from Sigma-Aldrich (Hamburg, Germany). Multi-Serum Normal, Randox Laboratories (Crumlin, Antrim, UK) is the supplier of commercial serum samples. All urine samples were collected from healthy volunteers and informed consent was obtained from all of them prior to the start of the study. The medical ethics committee in the College of Medicine, King Saud University, approved this study. Distilled water was used throughout this study.2.3. Standard solutions of CDC, VAL and TEL
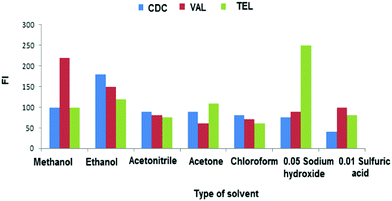
A stock solution (100 μg mL−1) of each of CDC, VAL and TEL was prepared by dissolving 10 mg of each drug in 100 mL of ethanol, methanol and 0.05 mol L−1 sodium hydroxide, respectively. The prepared solutions were kept stable in the refrigerator for at least 3 weeks. Working solutions were obtained by further dilution of the previously prepared stock solutions using the same solvents.2.4. Preparation of tablet samples
Not less than 10 tablets of each of Atacand®, Diovan® and Micards® were weighed and finely powdered. An accurate amount equivalent to 10 mg was dissolved in 5 mL of ethanol or methanol, or 0.05 mol L−1 sodium hydroxide. The contents were made up to 100 mL with distilled water and filtered after sonication for 10 min. The nominal contents of the tablets were calculated using calibration graphs.2.5. Preparation of bio-sample solutions
The proposed FL method was employed to determine the investigated CDC, VAL and TEL in bio-samples such as human serum and urine in the presence of potential catalytic activity of AgNPs or AuNPs using the spiking technique. An accurate amount of the tested drugs was added to serum and urine samples. The previously spiked human serum (1.0 mL) was deproteinated by adding a mixture of 1.0 mL acetronitrile, 0.1 mL of 0.1 mol L−1 sodium hydroxide and 1.0 mL ZnSO4·7H2O (5.0% w/v). The sample was centrifuged at 3500 rpm for 30 min and filtered and made up to volume to prepare the working solutions of the investigated drugs in the ranges of 1.0–100, 0.02–120 and 2.0–30 ng mL for the three FL systems in the presence of AgNPs. Furthermore, in the presence of AuNPs the previously mentioned drugs were tested in the concentration ranges of 1.0–60, 0.1–80 and 0.1–250 ng mL−1. Human urine samples were diluted with distilled water and the investigated drugs were subjected to analysis using these concentration ranges, with no further treatment.2.6 Synthesis of AgNPs and AuNPs
Chemical reduction of silver nitrate using sodium borohydride was utilized for the synthesis of AgNPs.34 The process was carried out by adding 5 mL of 2.0 × 10⁻³ mol L−1 sodium borohydride to 30 mL of 1.0 × 10⁻³ mol L−1 silver nitrate, dropwise under continuous stirring. The color of the mixture turned yellow after 5 min, indicating the formation of Ag˙. To stabilize the prepared AgNPs, 5 mL of 2.0 × 10⁻³ mol L−1 trisodium citrate dihydrate was added.The synthesis of AuNPs was performed by chemical reduction of HAuCl4 using 0.5% trisodium citrate dihydrate solution.34 The reduction process was accomplished by adding 1.0 mL of 5.0 × 10⁻³ mol L−1 HAuCl4 solution to 18 mL of distilled water, boiling, and then adding 3 mL of 0.5% trisodium citrate dihydrate solution. The mixture was heated at 60 °C until a significant pale purple color of AuNPs was formed.
2.7. General FL procedure
The FIs for the determination of CDC, VAL and TEL in the presence of AgNPs and AuNPs were examined at optimum FL conditions at room temperature as summarized in Table 1. To quantify the investigated drugs in their bulk and tablets, aliquots of the working solutions were transferred into 10 mL volumetric flasks and the pH of each solution was adjusted using phosphate buffer.| FL-system | Conc. range, ng mL−1 | pH | Added reagent | Added sample | Added NPs | λ ex, nm | λ em, nm | Time |
|---|---|---|---|---|---|---|---|---|
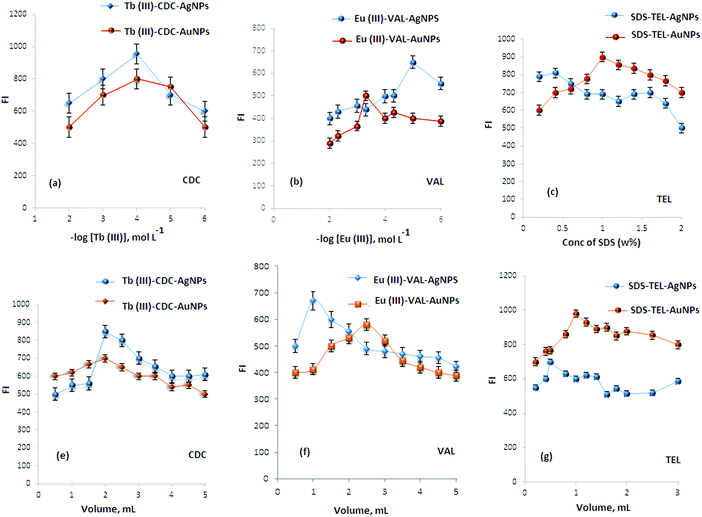
| CDC–Tb(III)–AgNPs | 0.01–300 | 2.0 mL of 0.1 mol L−1 phosphate buffer pH 6 | 2.0 mL 1.0 × 10⁻⁴ mol L−1 Tb(III) | 2.0 mL CDC | 2.0 mL AgNPs | 525 | 555 | 15 min |
| CDC–Tb(III)–AuNPs | 0.05–60 | 3.0 mL of 0.1 mol L−1 phosphate buffer pH 6 | 1.0 mL 1.0 × 10⁻⁴ mol L−1 Tb(III) | 2.0 mL CDC | 2.0 mL AuNPs | 525 | 555 | 15 min |
| VAL–Eu(III)–AgNPs | 0.02–120 | 1.0 mL of 0.1 mol L−1 phosphate buffer pH 4 | 2.0 mL 1.0 × 10⁻⁵ mol L−1 Eu(III) | 2.0 mL VAL | 1.0 mL AgNPs | 420 | 490 | 20 min |
| VAL–Eu(III)–AuNPs | 0.1–80 | 1.0 mL of 0.1 mol L−1 phosphate buffer pH 4 | 2.0 mL 5.0 × 10⁻⁴ mol L−1 Eu(III) | 2.0 mL VAL | 2.5 mL AuNPs | 420 | 490 | 20 min |
| TEL–SDS–AgNPs | 2.0–30 | 1.5 mL of 0.1 mol L−1 phosphate buffer pH 5 | 0.5 mL of 0.5% SDS | 2.0 mL TEL | 0.8 mL AgNPs | 330 | 400 | 10 |
| TEL–SDS–AuNPs | 0.1–250 | 2.0 mL of 0.1 mol L−1 phosphate buffer pH 5 | 1.0 mL of 1.0% SDS | 2.0 mL TEL | 1.0 mL AuNPs | 330 | 400 | 10 |
The luminescence detection was conducted at room temperature using λem 555, 490 and 400 after λex 525, 420 and 330 for CDC–Tb(III), VAL–Eu(III) and TEL–SDS in the presence of AgNPs or AuNPs, respectively. The calibration graphs were plotted and the concentration of each drug was evaluated using the regression equation.
3. Results and discussion
3.1. Characterization of AgNPs and AuNPs
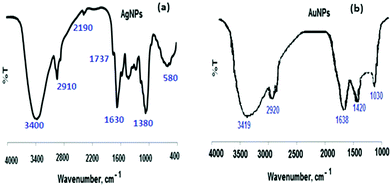
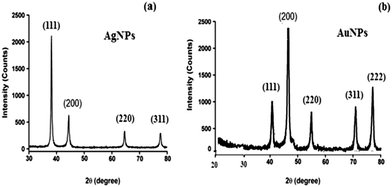
Also, the chemical surface of the AuNPs was studied using FT-IR spectroscopy. Two different vibrational bands at 3419 and 1638 cm−1 were observed for N–H stretching. The recorded spectrum revealed two vibration bands at a wavelength of 3419 cm−1 for amide vibration and bending bands, respectively. The appearance of the bands at 2920, 1420 and 1030 cm−1 can be attributed to the formation of AuNPs (Fig. 3b).
3.2. Characterization using TEM and SEM
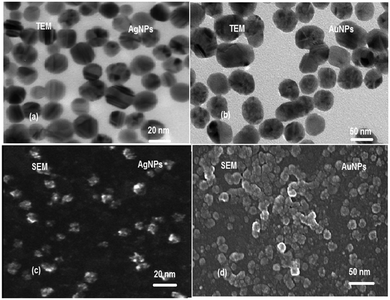
The microscopic evaluation of the synthesized AgNPs and AuNPs was carried out using TEM and SEM. The selected TEM images of the synthesized AgNPs and AuNPs (Fig. 4a and b) demonstrated the uniform distribution of the nanoparticles. Spherical nanoparticles were observed and their sizes are 20 and 50 nm for AgNPs and AuNPs, respectively. Additionally, the surface morphology of AgNPs and AuNPs was studied using SEM images (Fig. 4c and d).3.2. Spectral characteristics
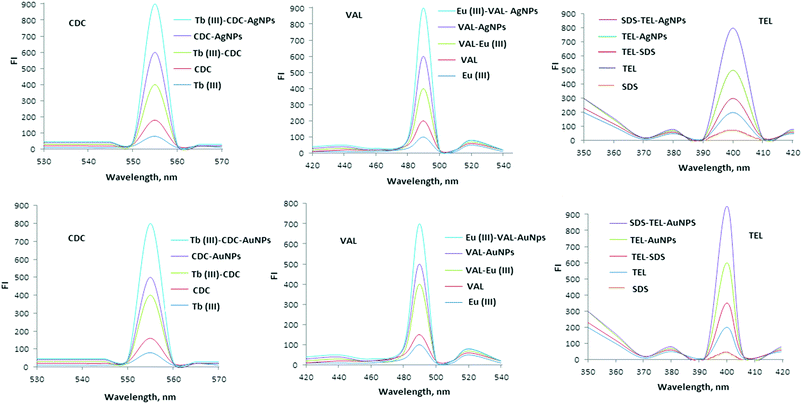
All studied angiotensin II blockers (CDC, VAL and TEL) were found to exhibit emission bands of weak strength in phosphate buffer at 555, 490 and 400 nm after excitation at 525, 420 and 330 nm, respectively. The addition of AgNPs or AuNPs to each FL system, CDC–Tb(III)–AgNPs, CDC–Tb(III)–AuNPs, VAL–Eu(III)–AgNPs, VAL–Eu(III)–AuNPs, TEL–SDS–AgNPs and TEL–SDS–AuNPs, enhances the emission bands for each system (Fig. 6). Also, the FL analysis could be successfully used to determine the investigated drugs. The transfer of intramolecular energy from Tb(III), Eu(III) and SDS to the ligand is a well-known phenomenon.37 As shown in Fig. 6 the Tb(III), Eu(III) and SDS ions have high emission spectra in the presence of CDC, VAL and TEL, respectively. The increase in FI indicated that the complexes of Tb(III)–CDC, Eu(III)–VAL and SDS–TEL are formed and the intermolecular energy has transferred. However, the intramolecular energy transfer from CDC, VAL or TEL to Tb(III), Eu(III) and SDS may enhance the weak luminescence of them that originates from the intra-chelate energy transfer from the triplet state of the organic ligand to the excited energy levels of the reagent ions. Furthermore, the addition of colloidal AgNPs or AuNPs to Tb(III)–CDC, Eu(III)–VAL or SDS–TEL systems greatly enhances FI. It was reported that the metal nanoparticles modify the free space absorption condition of the fluorophores, and this dramatically changes the spectra from those obtained in the absence of metallic nano surfaces.363.3. Optimization of experimental conditions
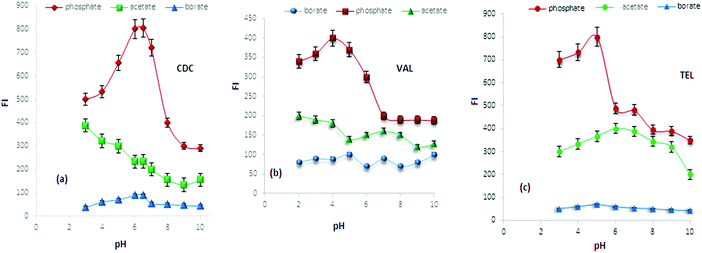
The effect of phosphate buffer volume was also investigated using gradual increase of buffer volume from 1.0–5.0 mL. It was found that maximum FI was obtained by adding 2.0, 1.0 and 1.5 mL of 0.1 mol L−1 phosphate buffer of pH 6, 4 and 5 for the Tb(III)–CDC, Eu(III)–VAL and SDS–TEL systems in the presence of AgNPs, respectively. However, maximum FI was achieved by adding 3.0, 1.0 and 2.0 mL for the previously mentioned systems in the presence of AuNPs.
However, in the case of AuNPs maximum FIs were achieved by adding 1.0 mL of 1.0 × 10⁻⁴ mol L−1 Tb(III) solution, and 2.0 mL of 1.0 × 10⁻⁵ mol L−1 Eu(III) solution for the Tb(III)–CDC and Eu(III)–VAL systems and 1.0 mL of 1.0% SDS for the SDS–TEL system.
3.4. Study of interference
To evaluate the specificity of the FL systems towards the determination of the investigated angiotensin II receptor drugs, various possible additives, anions, cations, amino acids and sugars were tested. Under the optimized conditions the tolerable level was calculated using 1.0 ng mL−1 of each drug (CDC, VAL and TEL) sample containing 1.0 μg mL−1 of foreign species such as some possible cations Na+, K+, Mg2+, Cu2+, Fe2+, Fe3+, Mn2+, Ni2+, NH4+, Cd2+, Co2+ and Al3+, some anions including Cl−, NO3−, and SO42−, sugars such as glucose, lactose and sucrose, some common acids such as uric acid, citric acid, and oxalic acid and salts such as magnesium stearate. Also the interference effect of some amino acids such as adrenaline, dopamine, cysteine, histamine, tyrosine and glucosamine was tested. The obtained values of the tolerable levels revealed good selectivity of the suggested FI systems for the determination of CDC, VAL and TEL in the presence of AgNPs or AuNPs. Table 2 showed that no interference was observed. The tolerance of foreign species gave an error ≤±5.| Interferents | CDC–Tb(III) | VAL–Eu(III) | TEL–SDS | |||
|---|---|---|---|---|---|---|
| AgNPs | AuNPs | AgNPs | AuNPs | AgNPs | AuNPs | |
| Na+, K+, and Mg2+ | 800 | 700 | 650 | 500 | 350 | 400 |
| Cl−1, NO3−, NH4+, and SO42− | 750 | 680 | 560 | 510 | 420 | 500 |
| Glucose, sucrose, lactose, talc, and starch | 600 | 600 | 400 | 200 | 300 | 100 |
| Uric acid, magnesium stearate, citric acid, and oxalic acid | 300 | 300 | 100 | 90 | 100 | 110 |
| Cysteine, histamine, tyrosine, glucosamine, and adrenaline | 400 | 300 | 200 | 300 | 250 | 200 |
| Al3+, Cd2+, Co2+, Fe2+, Fe3+, Mn2+, Ni2+, and Cu2+ | 100 | 200 | 80 | 50 | 100 | 120 |
3.5. Method validation
Validation of an analytical method involves using an experimental design to prove that the method can produce accurate and precise results within the scope of its intended use. The developed FL methods for the determination of CDC, VAL and TEL were validated using ICH guidelines.39| Parameter | CDC–Tb(III) | VAL–Eu(III) | TEL–SDS | |||
|---|---|---|---|---|---|---|
| AgNPs | AuNPs | AgNPs | AuNPs | AgNPs | AuNPs | |
| Linear range, ng mL−1 | 0.01–300 | 0.05–60 | 0.02–120 | 0.1–80 | 2.0–30 | 0.1–250 |
| LOD, ng mL−1 | 0.003 | 0.024 | 0.001 | 0.018 | 0.029 | 0.021 |
| LOQ, ng mL−1 | 0.01 | 0.05 | 0.005 | 0.05 | 0.089 | 0.065 |
| Regression equation | I FL = 2.8809C + 95.397 | I FL = 8.318C + 216.31 | I FL = 5.77C + 160.67 | I FL = 7.12C + 175.64 | I FL = 14.98C + 348.91 | I FL = 3.07C + 214.65 |
| Correlation coefficient, r | 0.9998 | 0.9996 | 0.9996 | 0.9997 | 0.9994 | 0.9997 |
| S a: standard deviation of intercept | 0.014 | 0.06 | 0.003 | 0.04 | 0.13 | 0.02 |
| S b: standard deviation of slope | 2.04 | 2.10 | 2.44 | 3.95 | 2.05 | 2.38 |
LOD and LOQ of the suggested FL methods were calculated regarding the ICH Q2 (R1) recommendations.39 The LODs of the studied Tb(III)–CDC, Eu(III)–VAL and SDS–TEL systems in the presence of AgNPs or AuNPs were (0.003, 0.001 and 0.029 ng mL−1) and (0.024, 0.018 and 0.021 ng mL−1) for the three systems, respectively. LOD was determined by establishing the minimum level at which the analyte can reliably be detected, using the relation 3.3(Sa)/b.
However, LOQ was calculated as the lowest amount of analyte in a sample that can be determined with acceptable precision and accuracy under the stated experimental conditions and was found to be (0.01, 0.005 and 0.089 ng mL−1) and (0.05, 0.05 and 0.065 ng mL−1) for the previously mentioned systems using the relation 10(Sa)/b (Table 3).
| Sample | In the presence of AgNPs | In the presence of AuNPs | |||||
|---|---|---|---|---|---|---|---|
| Taken ng mL−1 | Found ng mL−1 | % Recovery | Taken ng mL−1 | Found ng mL−1 | % Recovery | ||
| a Figures in parentheses are the tabulated values of t- and F-tests at 95% confidence limit.41 | |||||||
| CDC–Tb(III) | 0.01 | 0.01 | 100.0 | 0.05 | 0.05 | 100.0 | Reported method16 |
| 0.10 | 0.99 | 99.0 | 0.50 | 0.49 | 98.0 | ||
| 1.00 | 0.98 | 98.0 | 5.00 | 4.97 | 99.4 | ||
| 50.00 | 49.00 | 98.0 | 10.00 | 9.85 | 98.5 | ||
| 100.00 | 101.00 | 101.0 | 30.00 | 29.55 | 98.5 | ||
| 200.00 | 199.50 | 99.8 | 50.00 | 49.62 | 99.3 | ||
| 300.00 | 300.00 | 100.0 | 60.00 | 59.70 | 99.5 | ||
| Mean ± SD | 99.40 ± 1.12 | 99.03 ± 0.71 | 99.48 ± 0.96 | ||||
| Variance | 1.25 | 0.50 | 0.92 | ||||
| % RSD | 1.13 | 0.71 | 0.96 | ||||
| t-Test | 0.139 (2.179)a | 0.949 (2.179)a | (n = 7) | ||||
| F-test | 1.36 (4.28)a | 1.84 (4.28)a | |||||
| VAL–Eu(III) | 0.02 | 0.02 | 100.0 | 0.10 | 0.10 | 100.0 | Reported method17 |
| 0.20 | 0.20 | 100.0 | 1.00 | 0.99 | 99.0 | ||
| 2.00 | 1.99 | 99.5 | 10.00 | 9.95 | 99.5 | ||
| 20.00 | 19.50 | 97.5 | 20.00 | 19.70 | 98.5 | ||
| 50.00 | 49.98 | 99.9 | 40.00 | 39.00 | 97.5 | ||
| 100.00 | 100.00 | 100.0 | 60.00 | 59.58 | 99.3 | ||
| 120.00 | 119.49 | 99.6 | 80.00 | 79.60 | 99.5 | ||
| Mean ± SD | 99.5 ± 0.91 | 99.04 ± 0.82 | 99.44 ± 0.55 | ||||
| Variance | 0.83 | 0.67 | 0.30 | ||||
| % RSD | 0.91 | 0.83 | 0.55 | ||||
| t-Test | 0.148 (2.179)a | 1.052 (2.179)a | (n = 7) | ||||
| F-test | 2.77 (4.28)a | 1.22 (4.28)a | |||||
| TEL–SDS | 2.0 | 2.01 | 100.5 | 0.1 | 0.1 | 100.0 | Reported method18 |
| 5.0 | 4.95 | 99.0 | 1.0 | 0.99 | 99.0 | ||
| 10.0 | 100.5 | 100.5 | 10.0 | 10.01 | 100.1 | ||
| 15.0 | 15.12 | 100.8 | 50.0 | 49.85 | 99.7 | ||
| 20.0 | 19.88 | 99.4 | 150.0 | 149.81 | 99.9 | ||
| 30.0 | 30.12 | 100.4 | 250.0 | 251.25 | 100.5 | ||
| Mean ± SD | 100.1 ± 0.72 | 99.86 ± 0.50 | 99.90 ± 0.54 | ||||
| Variance | 0.52 | 0.25 | 0.29 | ||||
| % RSD | 0.72 | 0.50 | 0.54 | ||||
| t-Test | 0.567 (2.201)a | 0.141 (2.201)a | (n = 7) | ||||
| F-test | 1.79 (4.39)a | 1.16 (4.39)a | |||||
In order to evaluate the precision of the suggested CDC–Tb(III), VAL–Eu(III) and TEL–SDS FL systems, intra-day and inter-day assays were performed. Three different concentrations of each drug were investigated in triplicate (n = 3) and the overall results were expressed as % RSD.
The obtained results of intra-day and inter-day assays were 0.81–0.95, 0.72–0.99, 0.39–0.75, 0.88–1.15 and 0.25–1.15, 0.10–0.81 for the three investigated drugs in the presence of AgNPs, respectively. However, in the presence of AuNPs they were 0.59–0.86, 0.11–0.69, 0.38–1.31, 0.85–1.26 and 0.61–0.93, 0.37–1.05 for the same three systems, respectively (Table 5).
| Sample | Conc., ng mL−1 | % Recovery | % RSD | % Error | |
|---|---|---|---|---|---|
| CDC–Tb(III) using AgNPs | Intra-day assay | 0.01 | 100.01 ± 0.91 | 0.91 | 0.52 |
| 50 | 99.20 ± 0.80 | 0.81 | 0.46 | ||
| 300 | 99.07 ± 0.95 | 0.95 | 0.54 | ||
| Inter-day assay | 0.01 | 99.10 ± 0.80 | 0.80 | 0.46 | |
| 50 | 99.40 ± 0.72 | 0.72 | 0.41 | ||
| 300 | 99.20 ± 0.99 | 0.99 | 0.57 | ||
| CDC–Tb(III) using AuNPs | Intra-day assay | 0.05 | 100.04 ± 0.59 | 0.59 | 0.32 |
| 30 | 100.39 ± 0.81 | 0.81 | 0.45 | ||
| 60 | 99.81 ± 0.86 | 0.86 | 0.49 | ||
| Inter-day assay | 0.05 | 99.39 ± 0.11 | 0.11 | 0.06 | |
| 30 | 99.67 ± 0.20 | 0.20 | 0.11 | ||
| 60 | 99.33 ± 0.69 | 0.69 | 0.39 | ||
| VAL–Eu(III) using AgNPs | Intra-day assay | 0.02 | 99.89 ± 0.75 | 0.75 | 0.43 |
| 20 | 99.67 ± 0.53 | 0.53 | 0.30 | ||
| 120 | 99.25 ± 0.39 | 0.39 | 0.22 | ||
| Inter-day assay | 0.02 | 100.31 ± 0.88 | 0.88 | 0.51 | |
| 20 | 101.02 ± 1.15 | 1.15 | 0.66 | ||
| 120 | 99.58 ± 1.05 | 1.05 | 0.61 | ||
| VAL–Eu(III) using AuNPs | Intra-day assay | 0.1 | 101.32 ± 1.31 | 1.31 | 0.65 |
| 10 | 98.81 ± 0.38 | 0.38 | 0.21 | ||
| 80 | 100.83 ± 0.77 | 0.77 | 0.44 | ||
| Inter-day assay | 0.1 | 99.32 ± 0.85 | 0.85 | 0.49 | |
| 10 | 99.47 ± 0.93 | 0.93 | 0.53 | ||
| 80 | 99.85 ± 1.26 | 1.26 | 0.72 | ||
| TEL–SDS using AgNPs | Intra-day assay | 2 | 100.0 ± 0.33 | 0.33 | 0.19 |
| 10 | 100.5 ± 0.25 | 0.25 | 0.14 | ||
| 30 | 99.95 ± 1.15 | 1.15 | 0.27 | ||
| Inter-day assay | 2 | 99.78 ± 0.81 | 0.81 | 0.46 | |
| 10 | 99.50 ± 0.10 | 0.10 | 0.05 | ||
| 30 | 100.05 ± 0.08 | 0.08 | 0.04 | ||
| TEL–SDS using AuNPs | Intra-day assay | 0.1 | 99.59 ± 0.61 | 0.61 | 0.35 |
| 100 | 101.05 ± 0.88 | 0.85 | 0.49 | ||
| 250 | 100.82 ± 0.94 | 0.93 | 0.54 | ||
| Inter-day assay | 0.1 | 100.41 ± 0.89 | 0.89 | 0.51 | |
| 100 | 99.25 ± 0.37 | 0.37 | 0.21 | ||
| 250 | 100.48 ± 1.06 | 1.05 | 0.61 | ||
3.6. Analytical application
The proposed methods were successfully applied to assaying CDC, VAL and TEL powders (Table 4) and tablets (Atacand®16 mg per tablet, Diovan® 40 mg per tablet and Micardis® 40 mg per tablet). The results of the proposed FL methods were compared with those obtained from other reported methods.16–18 To evaluate the performance of the proposed methods, the obtained results were statistically treated using Student's t-test and the variance ratio F-test41 as indicated in Table 6.| Sample | In the presence of AgNPs | In the presence of AuNPs | |||||
|---|---|---|---|---|---|---|---|
| Taken ng mL−1 | Found ng mL−1 | % Recovery | Taken ng mL−1 | Found ng mL−1 | % Recovery | ||
| a Figures in parentheses are the tabulated values of t- and F-tests at 95% confidence limit.41 | |||||||
| CDC (Atacand® 16 mg per tablet) | 0.01 | 0.01 | 100.0 | 0.05 | 0.05 | 100.0 | Reported method16 |
| 0.10 | 0.0995 | 99.5 | 0.10 | 0.0985 | 98.5 | ||
| 1.00 | 0.99 | 99.0 | 1.00 | 0.99 | 99.0 | ||
| 5.00 | 4.92 | 98.5 | 10.00 | 9.95 | 99.5 | ||
| 10.00 | 9.80 | 98.0 | 20.00 | 19.86 | 99.3 | ||
| 50.00 | 50.10 | 101.0 | 30.00 | 29.79 | 99.3 | ||
| 300.00 | 300.00 | 100.0 | 60.00 | 60.00 | 100.0 | ||
| Mean ± SD | 99.46 ± 0.94 | 99.37 ± 0.53 | 99.48 ± 0.96 | ||||
| Variance | 0.88 | 0.28 | 0.92 | ||||
| % RSD | 0.94 | 0.53 | 0.96 | ||||
| t-Test | 0.038 (2.179)a | 0.251 (2.179)a | (n = 7) | ||||
| F-test | 1.05 (4.28)a | 3.29 (4.28)a | |||||
| VAL (Diovan® 40 mg per tablet) | 0.02 | 0.02 | 100.0 | 0.10 | 0.10 | 100.0 | Reported method17 |
| 0.20 | 0.20 | 100.0 | 1.00 | 98.00 | 98.0 | ||
| 2.00 | 1.99 | 99.5 | 10.00 | 10.00 | 100.0 | ||
| 20.00 | 19.50 | 97.5 | 25.00 | 24.65 | 98.6 | ||
| 50.00 | 49.95 | 99.9 | 45.00 | 45.09 | 100.2 | ||
| 100.00 | 100.00 | 100.0 | 65.00 | 64.48 | 99.2 | ||
| 120.00 | 119.52 | 99.6 | 80.00 | 79.04 | 98.8 | ||
| Mean ± SD | 99.50 ± 0.91 | 99.26 ± 0.84 | 99.44 ± 0.55 | ||||
| Variance | 0.83 | 0.71 | 0.30 | ||||
| % RSD | 0.91 | 0.84 | 0.55 | ||||
| t-Test | 0.150 (2.179)a | 0.470 (2.179)a | (n = 7) | ||||
| F-test | 2.77 (4.28)a | 2.37 (4.28)a | |||||
| TEL (Micardis® 40 mg per tablet) | 2.00 | 1.99 | 99.5 | 0.10 | 0.099 | 99.0 | Reported method18 |
| 5.00 | 4.95 | 99.0 | 50.00 | 50.00 | 100.0 | ||
| 10.00 | 10.10 | 101.0 | 100.00 | 99.50 | 99.5 | ||
| 15.00 | 14.98 | 99.87 | 150.00 | 148.05 | 98.7 | ||
| 20.00 | 19.88 | 99.40 | 200.00 | 199.00 | 99.5 | ||
| 30.00 | 30.02 | 100.05 | 250.00 | 249.00 | 99.6 | ||
| Mean ± SD | 99.80 ± 0.69 | 99.38 ± 0.46 | 99.90 ± 0.54 | ||||
| Variance | 0.48 | 0.21 | 0.29 | ||||
| % RSD | 0.69 | 0.46 | 0.54 | ||||
| t-Test | 0.291 (2.201)a | 1.885 (2.201)a | (n = 7) | ||||
| F-test | 1.66 (4.39)a | 1.38 (4.39)a | |||||
Additionally, the proposed methods were used to evaluate the investigated drugs in bio-samples. Excellent results were achieved and the obtained data are summarized in Tables 7 and 8. Furthermore, a simple and comparative study of the obtained results was carried out with those obtained from our previously reported chemiluminescence method.27 The comparative results revealed that the FL systems displayed linear concentration ranges of 0.01–300, 0.02–120 and 2–30 ng mL−1 for CDC, VAL and TEL in the presence of AgNPs, respectively, and 0.05–60, 0.1–80 and 0.1–250 ng mL−1 for the same drugs in the presence of AuNPs, respectively. Meanwhile, the calibration graphs of the chemiluminescence systems covered linear concentration ranges of 0.001–1000, 0.005–2000 and 0.002–40 ng mL−1 for CDC, VAL and TEL in the presence of AgNPs, respectively, and 0.005–500, 0.05–1000 and 0.5–120 ng mL−1 for the previously mentioned drugs in the presence of AuNPs, respectively.27 The comparative study revealed that both methods are highly sensitive for the determination of the investigated drugs in the presence of AgNPs or AuNPs.
| Sample | In the presence of AgNPs | In the presence of AuNPs | ||||
|---|---|---|---|---|---|---|
| Taken ng mL−1 | Found ng mL−1 | % Recovery | Taken ng mL−1 | Found ng mL−1 | % Recovery | |
| CDC in human serum | 1.00 | 0.99 | 99.0 | 1.00 | 0.98 | 98.0 |
| 5.00 | 4.87 | 97.4 | 10.00 | 9.86 | 98.6 | |
| 10.00 | 9.96 | 99.6 | 20.00 | 19.96 | 99.8 | |
| 25.00 | 24.94 | 99.8 | 30.00 | 29.97 | 99.9 | |
| 50.00 | 50.00 | 100.0 | 40.00 | 39.85 | 99.6 | |
| 100.00 | 98.48 | 98.5 | 60.00 | 59.69 | 99.4 | |
| Mean ± SD | 99.05 ± 0.98 | 99.22 ± 0.75 | ||||
| Variance | 0.96 | 0.56 | ||||
| % RSD | 0.99 | 0.76 | ||||
| VAL in human serum | 0.02 | 0.02 | 100.0 | 0.10 | 0.10 | 100.0 |
| 0.20 | 0.20 | 100.0 | 1.00 | 0.99 | 99.0 | |
| 2.00 | 1.97 | 98.5 | 10.00 | 9.97 | 99.7 | |
| 20.00 | 19.48 | 97.4 | 25.00 | 24.98 | 99.9 | |
| 50.00 | 49.98 | 99.9 | 45.00 | 44.78 | 99.5 | |
| 100.00 | 99.97 | 99.9 | 65.00 | 64.99 | 99.9 | |
| 120.00 | 119.57 | 99.6 | 80.00 | 79.96 | 99.9 | |
| Mean ± SD | 99.33 ± 1.00 | 99.70 ± 0.35 | ||||
| Variance | 1.00 | 0.12 | ||||
| % RSD | 1.01 | 0.35 | ||||
| TEL in human serum | 2.00 | 1.97 | 98.5 | 0.10 | 0.10 | 100.0 |
| 5.00 | 4.96 | 99.2 | 50.00 | 49.76 | 99.5 | |
| 10.00 | 10.00 | 100.0 | 100.00 | 99.95 | 99.9 | |
| 15.00 | 14.99 | 99.9 | 150.00 | 149.19 | 99.4 | |
| 20.00 | 19.78 | 98.9 | 200.00 | 198.17 | 99.1 | |
| 30.00 | 29.99 | 99.9 | 250.00 | 247.25 | 98.9 | |
| Mean ± SD | 99.40 ± 0.63 | 99.47 ± 0.43 | ||||
| Variance | 0.48 | 0.18 | ||||
| % RSD | 0.63 | 0.43 | ||||
| Sample | In the presence of AgNPs | In the presence of AuNPs | ||||
|---|---|---|---|---|---|---|
| Taken ng mL−1 | Found ng mL−1 | % Recovery | Taken ng mL−1 | Found ng mL−1 | % Recovery | |
| CDC in human urine | 1.00 | 0.99 | 99.0 | 1.00 | 0.98 | 98.0 |
| 5.00 | 4.95 | 99.0 | 5.00 | 4.86 | 97.2 | |
| 10.00 | 9.96 | 99.6 | 10.00 | 9.97 | 99.7 | |
| 50.00 | 49.85 | 99.7 | 20.00 | 19.86 | 99.3 | |
| 60.00 | 59.36 | 98.9 | 40.00 | 39.94 | 99.9 | |
| 80.00 | 78.95 | 98.7 | 60.00 | 59.97 | 99.9 | |
| Mean ± SD | 99.15 ± 0.40 | 99.00 ± 1.13 | ||||
| Variance | 0.16 | 1.27 | ||||
| % RSD | 0.40 | 1.14 | ||||
| VAL in human urine | 0.02 | 0.02 | 100.0 | 0.10 | 0.10 | 100.0 |
| 0.20 | 0.19 | 95.0 | 1.00 | 0.97 | 97.0 | |
| 2.00 | 1.99 | 99.5 | 10.00 | 9.99 | 99.9 | |
| 20.00 | 19.88 | 99.4 | 25.00 | 24.86 | 99.4 | |
| 50.00 | 49.68 | 99.3 | 45.00 | 44.62 | 99.2 | |
| 100.00 | 99.47 | 99.5 | 65.00 | 64.78 | 99.7 | |
| 120.00 | 119.00 | 99.2 | 80.00 | 79.98 | 99.9 | |
| Mean ± SD | 98.84 ± 1.71 | 99.30 ± 1.06 | ||||
| Variance | 2.92 | 1.12 | ||||
| % RSD | 1.73 | 1.07 | ||||
| TEL in human urine | 2.00 | 1.94 | 97.0 | 0.10 | 0.99 | 99.0 |
| 5.00 | 4.84 | 96.8 | 50.00 | 49.96 | 99.9 | |
| 10.00 | 10.00 | 100.0 | 100.00 | 99.00 | 99.0 | |
| 15.00 | 14.69 | 97.9 | 150.00 | 149.85 | 99.9 | |
| 20.00 | 19.82 | 99.1 | 200.00 | 199.63 | 99.8 | |
| 30.00 | 29.98 | 99.9 | 250.00 | 247.00 | 98.8 | |
| Mean ± SD | 98.5 ± 1.42 | 99.4 ± 0.52 | ||||
| Variance | 2.02 | 0.26 | ||||
| % RSD | 1.44 | 0.52 | ||||
4. Conclusion
As per the data obtained from the suggested FL approach, excellent catalytic activity of AgNPs and AuNPs was observed for the determination of CDC, VAL and TEL in their bulk powder and tablets. The evaluation of the investigated drugs using six different FL systems revealed high sensitivity and reproducibility over linear concentration ranges of 0.01–300, 0.02–120 and 2.0–30, ng mL−1 for CDC, VAL and TEL in the presence of AgNPs, respectively, and 0.05–60, 0.1–80 and 0.1–250 ng mL−1 for the same drugs in the presence of AuNPs. Statistical analysis of the obtained data was carried out and the results were in good agreement with those obtained from previously published methods. The suggested FL methods, using the unique features of the synthesized AgNPs and AuNPs, revealed high catalytic activity and sensitivity for the determination of CDC, VAL and TEL in their bulk powder, tablets and bio-samples.Conflicts of interest
No conflict of interest is associated with this work.Acknowledgements
This research project was supported by a grant from the “Research Center of the Female Scientific and Medical Colleges”, Deanship of Scientific Research, King Saud University.References
- L. O. L. Silva, M. M. Soares, M. A. Oliveira, S. M. Rodrigues, C. J. Machado and C. A. Dias, Physis: Rev Saude Coletiva, 2013, 23, 227–242 CrossRef.
- M. Burnier and R. Brunner, Lancet, 2000, 355, 637–645 CrossRef CAS.
- P. Cui, J. Wang, Q. Yin, J. Gong, Y. Wang and H. Hao, Fluid Phase Equilib., 2013, 337, 354–362 CrossRef CAS.
- P. Verdecchia and F. Angeli, J. Clin. Pharm. Ther., 2004, 26, 460–472 CAS.
- S. C. Benson, H. Pershadsingh, C. Ho, A. Chittiboyina, P. Desai, M. Pravenec, N. Qi, J. Wang, M. Avery and T. W. Kurtz, Hypertension, 2004, 43, 993–1002 CrossRef CAS PubMed.
- G. Kumar and N. Seshagiri, Int. J. Pharma Sci. Res., 2014, 5, 5438–5446 CAS.
- D. Veeranjaneyulu, A. Aneesha and N. Agarwal, Indian J. Res. Pharm. Biotechnol., 2013, 1, 720–724 CAS.
- H. Hafez, A. Abdullah, L. Abdelaziz and M. Kamal, J. Chromatogr. Sep. Tech., 2014, 5, 1–5 Search PubMed.
- Z. Piao, E. Lee, H. Tran and B. Lee, Arch. Pharmacal Res., 2008, 31, 1055–1059 CrossRef CAS.
- V. P. Kurade, M. G. Pai and R. Gude, Indian J. Pharm. Sci., 2009, 71, 148–151 CrossRef CAS.
- S. Sahoo, S. Mishra and P. Panda, Int. J. Pharm. Res. Scholars, 2012, 1, 1–5 CrossRef CAS.
- L. Gonzalez, U. Akesolo, R. Jiménez and R. Alonso, Electrophoresis, 2002, 23, 223–229 CrossRef CAS.
- M. Zhang, F. Wei, Y. Zhang, J. Nie and Y. Feng, J. Chromatogr. A, 2006, 1102, 294–301 CrossRef CAS.
- A. Alnajjar, J. AOAC Int., 2011, 94, 498–502 CAS.
- N. Alarfaj, J. Anal. Chem., 2013, 68, 335–340 CrossRef CAS.
- P. Erden, I. Tasdemir, C. Kacar and E. Kilic, Int. J. Electrochem. Sci., 2014, 9, 2208–2220 Search PubMed.
- I. Suslu, O. Nuran and S. Altinöz, J. AOAC Int., 2010, 93, 562–568 CAS.
- C. Muralikrishna and C. Rambabu, Int. J. Sci. Res., 2015, 4, 492–495 Search PubMed.
- M. Deshpande, M. Mahajan and S. Sawant, Int. J. Pharma Sci. Res., 2012, 3, 236–240 CAS.
- M. S. Palled, M. Chatter, P. M. N. Rajesh and A. R. Bhat, Indian J. Pharm. Sci., 2006, 68, 685–686 CrossRef CAS.
- A. El-Kosasy, S. Tawakkol, A. Miriam and A. Sheta, Talanta, 2015, 143, 402–413 CrossRef CAS.
- A. Sakur and H. Fael, Int. J. Pharm. Sci. Rev. Res., 2010, 4, 60–63 CAS.
- P. Anumolu, S. Neeli, H. Anuganti, S. Puvvadi and C. Subrahmanyam, Dhaka Univ. J. Pharm. Sci., 2013, 12, 35–40 CAS.
- Sh. Shalah, N. El-Enany and F. Belal, Anal. Methods, 2015, 7, 8060–8068 RSC.
- T. S. Belal, M. S. Mefrous, M. M. Abdel-Khalek, H. G. Daabees and M. M. Khamis, Luminescence, 2014, 29, 893–900 CrossRef CAS.
- R. A. Shaalan and T. S. Belal, Drug Test. Anal., 2010, 2, 489–493 CrossRef CAS.
- N. A. Alarfaj, S. A. Al-tamimi, M. F. El-Tohamy and A. M. Almahri, New J. Chem., 2018, 42, 3383–3393 RSC.
- J. Conde, G. Doria and P. Baptista, J. Drug Delivery, 2012, 1–12 Search PubMed.
- http://www.sigmaaldrich.com/materialsscience/nanomaterials/silvernanoparticles.html, 2018.
- M. Chaichi, S. Azizi and M. Heidarpour, Spectrochim. Acta, Part A, 2003, 1116, 594–598 Search PubMed.
- K. Liu, H. Tasi, C. Hsu and C. Chu, J. Chromatogr. A, 2006, 1133, 340–346 CrossRef.
- W. Liu, J. Luo, M. Zhao, H. Li and B. Li, Anal. Bioanal. Chem., 2016, 408, 8821–8830 CrossRef CAS.
- J. Luo, X. Cui, W. Liu and B. Li, Spectrochim. Acta, Part A, 2014, 131, 243–248 CrossRef CAS.
- S.U.I. Aberdeen, http://commons.emich.edu/theses, 2012, 19–20.
- http://nanocomposix.com/kb/silver/optical-properties, 2018.
- J. Leiterer, F. Deliben, F. Emmerling, A. F. Thunemann and U. Panne, Anal. Bioanal. Chem., 2011, 391, 1221–1228 CrossRef PubMed.
- S. Yu, Z. Zhou, B. Wu and F. Chen, Anal. Lett., 2008, 3, 124–3137 Search PubMed.
- K. Aslan, I. Gryczynski, J. Malicka, E. Matveeva, R. Lakowicz and D. Geddes, Curr. Opin. Biotechnol., 2005, 16, 55–62 CrossRef CAS.
- D. A. Skoog, F. J. Holler and S. R. Crouch, Principles of Instrumental Analysis, Thomson Brooks/Cole, Canada, 6th edn, 2007, p. 399 Search PubMed.
- ICH Guidelines, Validation of analytical procedures: text and methodology Q2 (R1), IFPMA, Geneva, 2005.
- J. C. Miller and J. N. Miller, Statistics for analytical chemistry, Ellis Horwood PTR Prentice Hall, New York, 3rd edn, 1993 Search PubMed.
Footnote |
| † General Administration and Medical Affairs, Zagazig University, Egypt. |
| This journal is © The Royal Society of Chemistry and the Centre National de la Recherche Scientifique 2019 |

