
Ultrafine Pt cluster and RuO2 heterojunction anode catalysts designed for ultra-low Pt-loading anion exchange membrane fuel cells†
Rongyue
Wang‡
a,
Dongguo
Li‡
b,
Sandip
Maurya‡
 b,
Yu Seung
Kim
*b,
Yimin
Wu
c,
Yuzi
Liu
c,
Dusan
Strmcnik
d,
Nenad M.
Markovic
d and
Vojislav R.
Stamenkovic
*d
b,
Yu Seung
Kim
*b,
Yimin
Wu
c,
Yuzi
Liu
c,
Dusan
Strmcnik
d,
Nenad M.
Markovic
d and
Vojislav R.
Stamenkovic
*d
aApplied Materials Division, Argonne National Laboratory, 9700 South Cass Avenue, Lemont, Illinois 60439, USA
bMPA-11: Materials Synthesis and Integrated Devices Group, Los Alamos National Laboratory, Los Alamos, New Mexico 87545, USA. E-mail: yskim@lanl.gov
cCenter for Nanoscale Materials, Argonne National Laboratory, 9700 South Cass Avenue, Lemont, Illinois 60439, USA
dMaterials Science Division, Argonne National Laboratory, 9700 South Cass Avenue, Lemont, Illinois 60439, USA. E-mail: vrstamenkovic@anl.gov
First published on 4th October 2019
Abstract
Development of high-performance hydrogen oxidation catalysts with ultralow precious metal loading is critical to the development of next-generation anion-exchange membrane fuel cells. Here, a novel Ru-rich Pt–RuO2 heterojunction catalyst was synthesized via a solvothermal process followed by thermal treatment. The Pt–RuO2 catalyst has ultrafine Pt clusters and a heterojunction interface between Pt and RuO2, which facilitates high hydrogen oxidation activity while minimizing adverse adsorption of the phenyl group in the polymer electrolyte. The performance of a membrane electrode assembly employing the Pt–RuO2/C reached a peak power density of 0.77 W cm−2 with an anode Pt loading of 25 μgPt cm−2, achieving a specific power of 31 W mgPt−1 under H2/O2 conditions. The combined analysis of electrode performance and cost indicates that Pt–RuO2/C is one of the most promising catalysts that is approaching the U.S. DOE 2020 performance and cost targets for transportation applications.
New conceptsSignificant performance improvement in anion-exchange membrane fuel cells has been made over the past five years. Current research interests shift to cost reduction of the fuel cells by substantial cutbacks of platinum group metal (PGM) catalyst loading, particularly in the fuel cell anode. Previous research has shown that the Pt–Ru alloy nanoparticles are the most active hydrogen oxidation catalyst, and thus the best candidates for a low PGM loading anode. Here, we demonstrate that Pt–RuO2 heterojunction catalysts can perform equally or even higher than the Pt–Ru alloying catalysts at their low loading. Rotating disk electrode studies revealed that the unique Pt/RuO2 interface suppressed the phenyl group poisoning of Pt while maintaining the high hydrogen oxidation activity. This research introduces the alternative aspect of hydrogen oxidation catalysts in addition to the currently available Pt–Ru alloy catalysts. |
Introduction
The recent development of novel membranes and ionomers with enhanced hydroxide conductivity and alkaline stability opens up new opportunities for the alkaline anion-exchange membrane fuel cells (AEMFCs).1,2 However, most of the membrane electrode assemblies (MEAs) demonstrating high peak power density in the literature used a substantial amount of Pt-group metal (PGM) catalysts.3–6 Developing cost-effective oxygen reduction reaction (ORR) catalysts for AEMFCs has been partly successful, showing ∼1 W cm−2 peak power density.7,8 On the other hand, developing low-cost electrocatalysts for the hydrogen oxidation reaction (HOR) of the AEMFCs has had limited success; therefore, the cost-benefits of AEMFCs over the proton-exchange membrane fuel cells (PEMFCs) have diminished. Replacing Pt-based HOR catalysts with highly active Pd-based catalysts9–12 has become less attractive as the price of Pd is getting higher than that of Pt.13 Replacing Pt catalysts with non-PGM catalysts has only limited success because of the relatively low catalytic activity and low surface energy that causes anode flooding,14 although some Ni-based non-PGM catalysts have shown promising activity in a rotating disk electrode.15 Reducing Pt loading in the AEMFC anode is an alternative solution to reduce the overall cost of AEMFCs. Recently, Omasta et al. reported ∼0.8 W cm−2 peak power density with a low Pt-loading anode-catalyzed MEA (anode Pt loading = 0.073 mgPt cm−2).16To develop a highly efficient HOR catalyst, not only the intrinsic kinetic activity17–19 but also the compatibility with the ionomer of MEA11,20 need to be taken into account. Our previous work of the HOR on bulk alloy electrode surfaces demonstrated that Pt–Ru bimetallic alloy catalysts are beneficial as Ru provides the sites for OHad, which effectively removes the hydrogen intermediates present at the nearby Pt sites.21–23 Also, it has been reported that the transportation/diffusion of hydrogen, OH− and OHad is severely impacted by cation—hydroxide-water within the double layer region, which is detrimental to the alkaline HOR.24–26 Further work at Los Alamos National Laboratory found that Pt–Ru bimetallic alloy catalysts also minimize the phenyl group adsorption responsible for significant decrease in the HOR current density up to 0.5 V vs. RHE [Reversible Hydrogen Electrode]. Since most ionomeric binders used in the AEMFCs contain a phenyl group, the low phenyl group adsorbing characteristics of Pt–Ru bimetallic alloy catalysts have shown a dramatic increase in AEMFC power density to ∼1.5 W cm−2 with the MEAs using polyaromatic ionomers.27,28 Other researchers demonstrated the AEMFC power density of >2.0 W cm−2 with the MEAs using less phenyl-containing polyolefinic ionomers.29,30 Moreover, incorporating Ru element in a Pt catalyst may significantly reduce the catalyst cost as the Ru price is only ∼30% that of Pt. However, it is still challenging to maintain the excellent anode performance at a low Pt-loading anode with the Pt–Ru bimetallic alloys, which have relatively high Pt to Ru ratio that makes the catalyst layer thin, thus promoting anode flooding.
Here, we report a Pt–RuO2 heterojunction catalyst from PtRu8 nano-dendrites instead of alloying Pt and Ru elements for cost-effective alkaline HOR. Although a facile synthesis of Pt–Ru composite electrocatalysts has been reported a long time ago,31,32 the previous work was limited to the catalyst use in methanol oxidation under acidic conditions. In this work, we prepared heterojunction catalysts supported on carbon via solvothermal synthesis and subsequent thermal treatment. Scale-up synthesis to 1 g per batch yield enables a thorough investigation of its MEA performance in combination with rotating disk electrode (RDE) studies. The unique morphology with ultrafine Pt particle sizes and atomically connected interfaces between Pt and RuO2 provides high catalytic activity toward the HOR while significantly improving H2 mass transport in MEAs. We compare the MEA performance of low anode loading Pt–RuO2/C with those of the state-of-the-art Pt/C and Pt–Ru/C catalysts. Finally, we discuss the AEMFC performance and cost aspects of the MEAs toward 2020 DOE fuel cell targets for transportation applications.
Results and discussion
Synthesis of Pt–RuO2 heterojunction catalysts
The Pt–RuO2 heterojunction catalyst was prepared from PtRu nano-dendrites. To get PtRu nanoparticles with high surface area, we explored different combinations of solvent, surfactant and reducing agent. It was found that the particles synthesized in dibenzyl ether in the presence of oleic acid are Pt-rich and non-uniform (Fig. S1, ESI†), although the same Ru rich precursor ratio was used. This means that the presence of oleic acid hinders the reduction of Ru precursors; thus, it was eliminated in the following investigations. Without an additional reducing agent, the Ru content in the particle is even lower (Fig. S2, ESI†), indicating that the mild reducing capability of oleylamine is not sufficient to completely reduce Ru precursor under these reaction conditions. As shown in Fig. 1a, we found that PtRu8 nano-dendrites of ∼3 nm could be made in diphenyl ether solvent at increased temperature (Fig. S1, ESI†). Similar particle size and composition were obtained with both 0.5 mL (Fig. S3, ESI†), and 2 mL (Fig. S4 and S5, ESI†) oleylamine or a slightly changed amount of reducing agent (Fig. 1a) for which the lower surfactant and reducing agent amount is sufficient for the reaction and further increase does not affect the product significantly. The Ru content in the particle is only slightly lower than the precursor ratio, indicating a very high conversion rate of the Ru precursor. As shown in Fig. 1b, PtRu8 nano-dendrites can be loaded onto carbon support uniformly. The high-resolution transmission electron microscopy (HRTEM) image (Fig. 1c) and selected area electron diffraction (SAED) pattern (Fig. 1d) demonstrated the crystalline nature of the nano-dendrites. Although the SAED pattern is weak with an ultra-small particle size, high-angle annular dark-field (HAADF) imaging and corresponding energy-dispersive X-ray spectroscopy (EDS) mapping revealed that the PtRu8 nano-dendrites are composed of a Pt-rich core surrounded with Ru-rich branches (Fig. 1e–h). These results indicate that the formation of PtRu8 nano-dendrites starts with Pt-rich nuclei because Pt is easier to be reduced than Ru. As the reaction progresses, Ru-rich branches continue to grow on the surface, leading to the dendrite structure.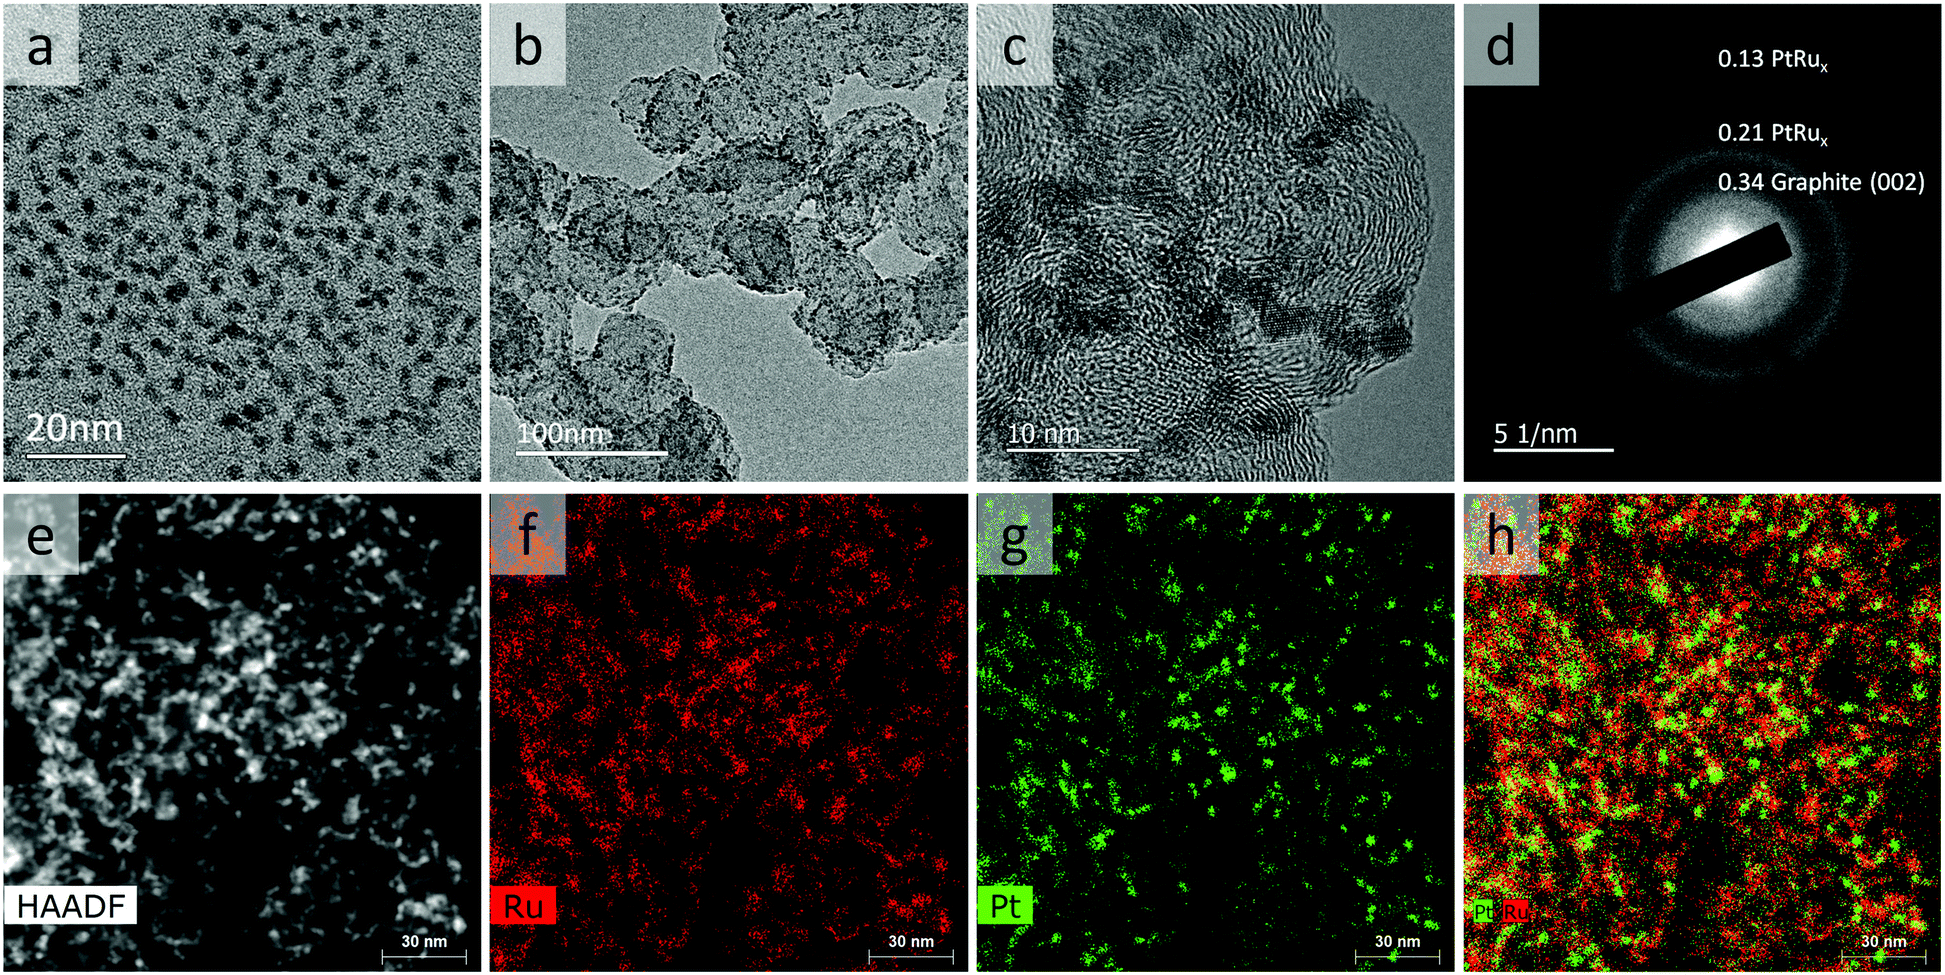 | ||
| Fig. 1 TEM characterization of PtRu8 nano-dendrites. TEM image of the as-synthesized nano-dendrites (a); TEM image (b), HRTEM image (c), select area electron diffraction (d), HAADF image (e), and EDS mapping (f–h) of carbon supported PtRu8 nano-dendrites. | ||
The Pt–RuO2 heterojunction catalyst was obtained by annealing of the carbon supported PtRu8 nano-dendrites in the air at 185 °C overnight, and Ru was converted into RuO2, As shown in Fig. 2, the uniform dendrite structure was converted into a composite structure with lower contrast due to RuO2 formation. The HRTEM image in Fig. 2b and SEAD in Fig. 2c and d indicate the formation of Pt–RuO2 heterojunction structures with atomically connected interfaces. The HAADF imaging and EDS mapping results in Fig. 2e–h further demonstrate the Pt–RuO2 heterojunction structure. Compared with the PtRu8 nano-dendrites, the size of the Pt-rich particles is slightly smaller, indicating that some of the Ru in these Pt-rich areas is also oxidized and migrated to the RuO2 region. It is worth noting that we also spotted some Pt dispersed in the Ru-rich area, which may be beneficial for the performance at a low-Pt loading AEMFC anode. The HRTEM, HAADF, and EDS mapping exhibited the heterojunction interface between Pt clusters and single atoms in RuO2 without free Pt or free RuO2, although quantifying the interface from those characterizations was challenging due to the irregularity of the interfaces.
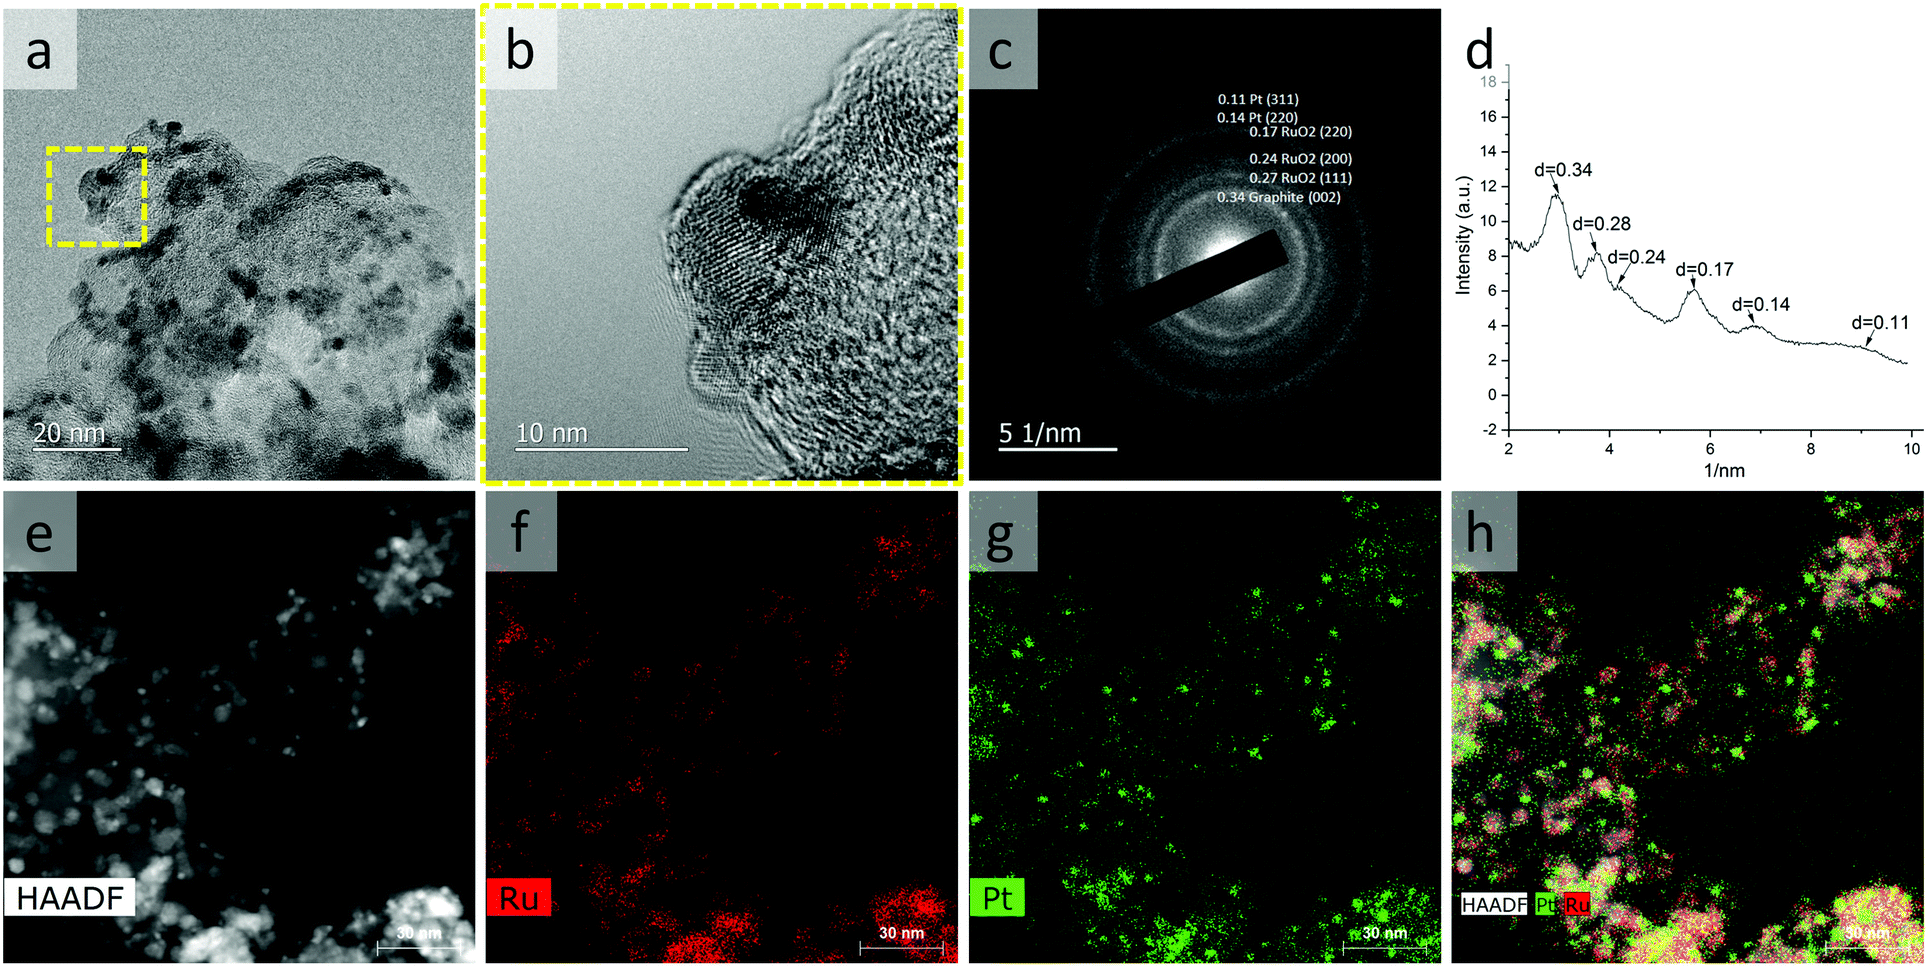 | ||
| Fig. 2 TEM characterization of Pt–RuO2 heterojunctions. TEM image (a), HRTEM image (b), select area electron diffraction (c and d), HAADF image (e), and EDX mapping (f–h) of Pt–RuO2 heterojunctions. | ||
We first synthesized the Pt–RuO2 heterojunction catalysts on a small scale (0.2 g per batch). Later, we investigated the scale-up synthesis of the Pt–RuO2 heterojunction catalyst. With six times higher volume reaction, the boiling of the reactants above 230 °C was more severe than small batch synthesis because the amount of dichlorobenzene (boiling point = 180 °C) was also six times higher while the removal rate of dichlorobenzene by argon flow was limited. The heating rate also decreased as more time was needed for reactants to reach the same reaction temperature. Still, we obtained similar particle size and composition with the scale-up synthesis (Fig. S6, ESI†). More importantly, scale-up synthesis was highly reproducible (Fig. S7, ESI†). As shown in Fig. S6 and S7 (ESI†), the process of loading PtRu8 nano-dendrites on carbon was also scalable. Overall, more than 1 g of a Pt–RuO2/C heterojunction catalyst was obtained by combining the two batches of scale-up synthesis and subsequent annealing in air. To develop a synthetic process feasible for further scale up, we investigated the synthesis of PtRu8 nano-dendrites with one-pot reaction because injecting precursors into hot reactive solution (hot-injection) was not favorable for scale-up. As shown in Fig. S8 (ESI†), similar particle size and composition were obtained with one-pot synthesis, indicating that this newly developed recipe is indeed scalable. ICP-MS confirms that the atomic ratio of Pt![[thin space (1/6-em)]](https://www.rsc.org/images/entities/char_2009.gif) :Ru in the heterojunction catalysts prepared from the scale-up synthesis is 1:8. The TEM images (Fig. S9a and b, ESI†) show that our six times scale-up Pt–RuO2 nanoparticles are monodisperse (most particles fall in the range of 3 to 6 nm in diameter) and are uniformly distributed on the high surface area carbon support. The X-ray diffraction (XRD) pattern showed no peaks corresponding to pure Ru, which proves that the RuO2 dominates the particle composition (Fig. S9c, ESI†), although we cannot rule out the possibility of a tiny fraction of Ru remaining. The carbon supported Pt–RuO2 heterojunction catalyst from the scale-up synthesis was further investigated in the RDE and AEMFC testing.
:Ru in the heterojunction catalysts prepared from the scale-up synthesis is 1:8. The TEM images (Fig. S9a and b, ESI†) show that our six times scale-up Pt–RuO2 nanoparticles are monodisperse (most particles fall in the range of 3 to 6 nm in diameter) and are uniformly distributed on the high surface area carbon support. The X-ray diffraction (XRD) pattern showed no peaks corresponding to pure Ru, which proves that the RuO2 dominates the particle composition (Fig. S9c, ESI†), although we cannot rule out the possibility of a tiny fraction of Ru remaining. The carbon supported Pt–RuO2 heterojunction catalyst from the scale-up synthesis was further investigated in the RDE and AEMFC testing.
Electrochemical characterization of Pt–RuO2 heterojunction catalysts
While an RDE test in the acidic electrolyte (mostly perchloric acid and sulfuric acid) has been proved as an efficient technique for the catalyst screening of PEMFCs,33,34 a systematic study to compare the RDE results in the alkaline electrolyte with the AEMFC performance is yet to be established. Conventionally, NaOH or KOH electrolyte has been used to reveal the kinetic performance of the catalyst in an RDE setup.35 Our recent work suggested that this might be insufficient for catalyst screening of AEMFCs, as catalyst/ionomer interactions such as phenyl group adsorption and cation-hydroxide-water co-adsorption could mask the intrinsic kinetic performance of a catalyst.24,28,36,37 In short, under AEMFC operating conditions, the HOR rate imposes limits on its performance, not to discount the need for continuous improvement of ORR catalysis, which is believed to be facile compared with the sluggish ORR in PEMFC. In this work, we carried out the RDE study using two different electrolytes, namely NaOH, and benzyl trimethylammonium hydroxide (BTMAOH), both in 0.1 M solution with Milli-Q water. We first compared the HOR performance by the slope between 0 and 0.1 mA cm−2 instead of the exchange current density, which is difficult to obtain for the nanoscale system.38 Then, we compared the HOR current density at 0.05–0.3 V, which is relevant to the AEMFC operating conditions (Fig. 3). In NaOH, the TKK Pt/C catalyst shows a typical Pt Hupd feature between 0.05 V and 0.40 V. The Pt–RuO2 catalyst shows big capacitance features in the same potential region, indicating a RuO2 rich surface (Fig. 3a). For HOR performance, Pt/C TKK and Pt–RuO2/C show almost identical kinetic performance near 0 V (Fig. 3b inset). Note that with the same metal loading, the synthesized Pt–RuO2/C catalyst has approximately 3.5 wt% of Pt only as opposed to the commercial catalyst with 19.4 wt% of Pt. The Pt clusters and their unique heterojunctions with RuO2 indeed exhibit excellent kinetic performance. When the electrolyte was switched to BTMAOH, TKK Pt/C shows a significant reduction in the current below 0.2 V, which is consistent with voltammograms of other Pt catalysts.39 Electrochemical infrared reflection absorption spectroscopy indicated that this current reduction is caused by phenyl group adsorption.27 For Pt–RuO2, minimal current drop is observed, which indicates that Pt–RuO2 interaction with the phenyl group is much weaker than that of pure Pt (Fig. 3c). In 0.1 M BTMAOH electrolytes, Pt–RuO2 shows higher current at 0.05–0.3 V, where the catalyst/phenyl group interactions take place (Fig. 3d). Overall, the RDE results suggest that the Pt–RuO2/C catalyst from the scale-up synthesis has comparable HOR kinetic performance with the commercial Pt/C even at significantly lower Pt loading, but higher tolerance of phenyl group poisoning.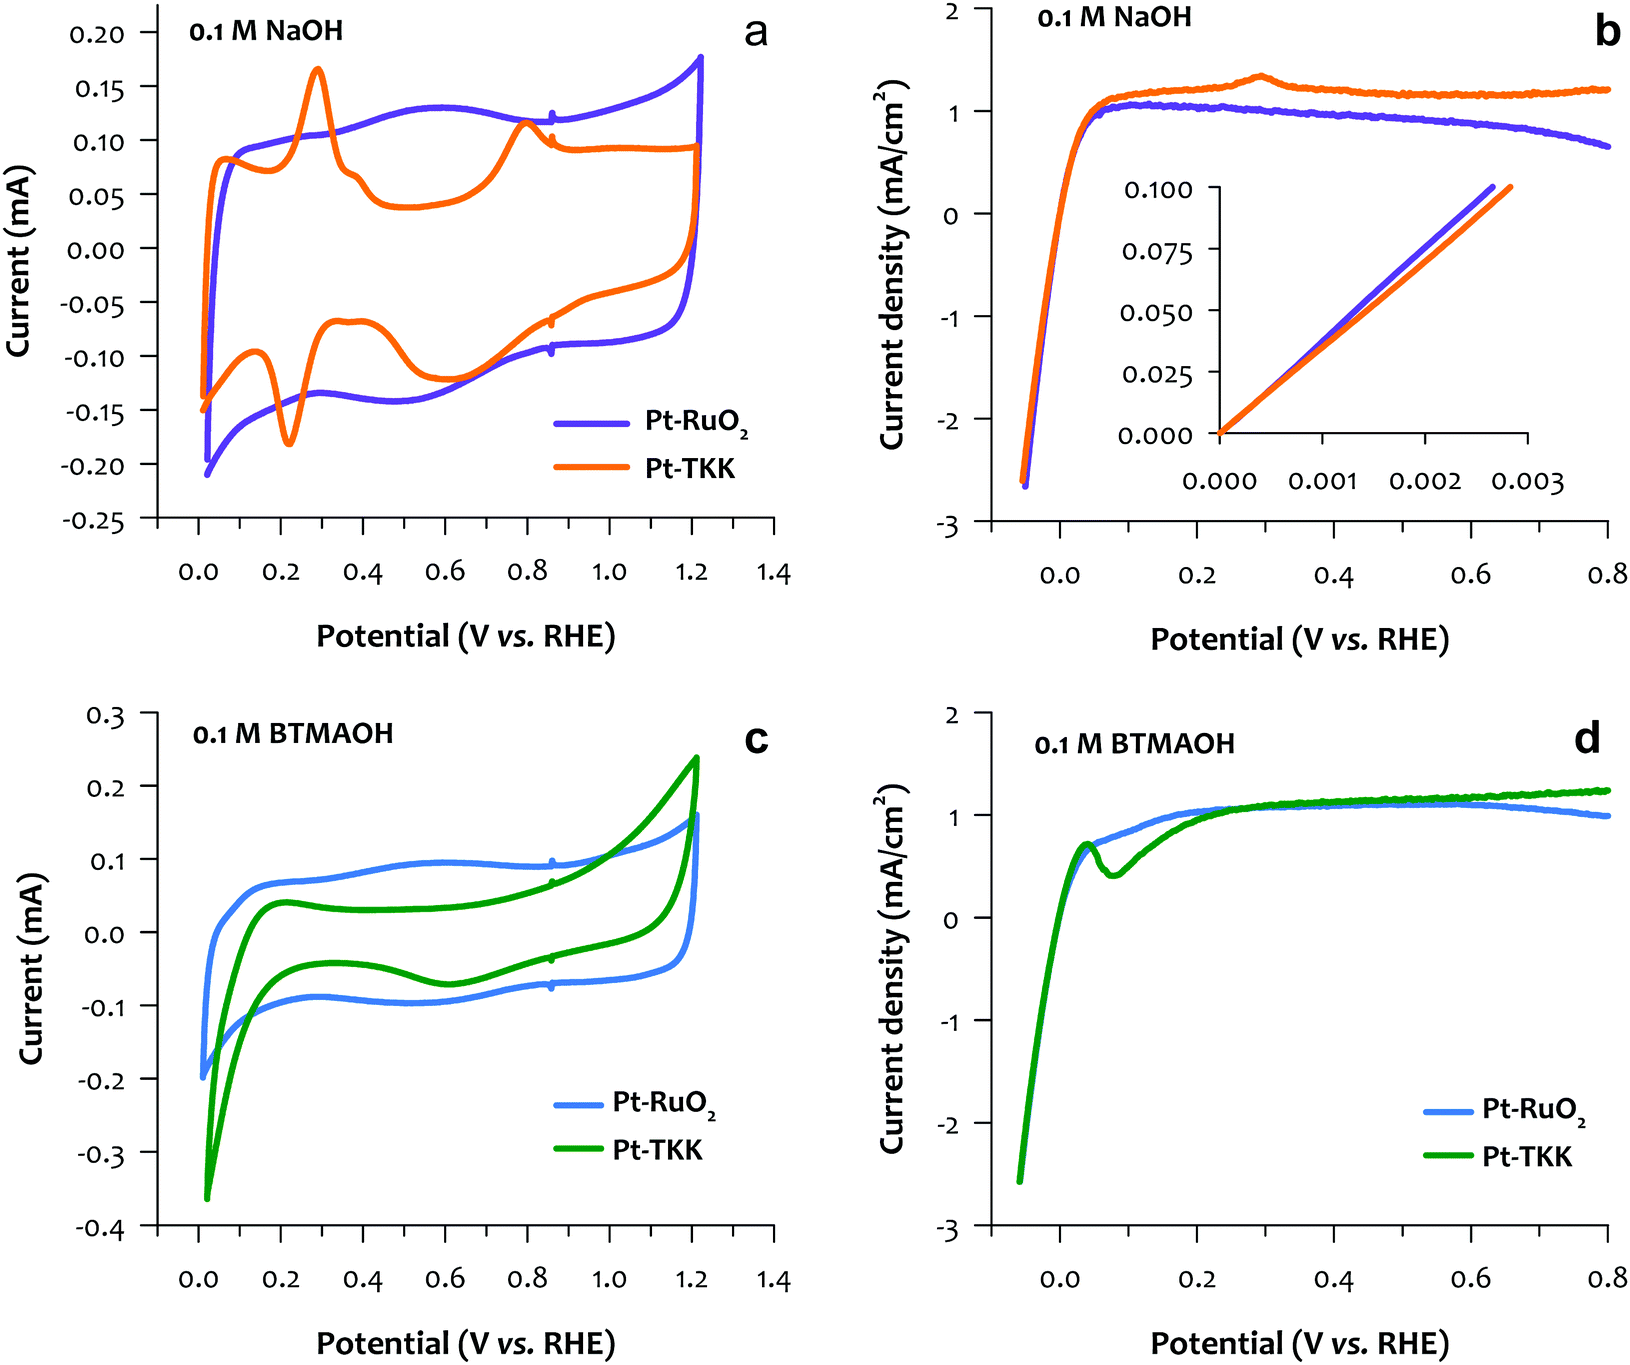 | ||
| Fig. 3 Cyclic voltammograms (a) and HOR curves (b) of Pt–RuO2 and Pt TKK in 0.1 M NaOH. Cyclic voltammograms (c) and HOR curves (d) of Pt–RuO2 and Pt TKK in 0.1 M BTMAOH. Cyclic Voltammograms were recorded at 50 mV s−1; HOR polarization curves were recorded at 20 mV s−1, 900 rpm. | ||
The performance of the Pt–RuO2 heterojunction catalysts in MEA
We evaluated the performance of the Pt–RuO2/C heterojunction and other state-of-the-art Pt-based anode catalysts in MEAs. The tested MEAs have the same MEA components except for the anode catalyst. The I/C [ionomer to catalyst] ratio of the anode was optimized for the best AEMFC performance. Fig. 4a compares the polarization curve, cell HFR, and power density of the MEAs employing low Pt loading Pt/C, PtRu/C, and Pt–RuO2/C anode catalysts. Under the H2/O2 conditions, the MEA using the Pt–RuO2/C anode catalyst exhibits exceptionally high performance in spite of the lower Pt loading. The peak power density of the MEA using the Pt–RuO2/C anode reached 0.77 W cm−2 as opposed to the MEA using Pt/C and PtRu/C anode catalysts of which the peak power density was 0.28 and 0.55 W cm−2, respectively. All MEAs have similar cell HFR (∼0.045 Ω cm2), confirming that the different performance is not originated from MEA hydration and the catalyst-AEM interface.40 The kinetic performance difference between the Pt/C and Pt–RuO2/C catalyzed MEAs is negligible, for example, the iR-corrected current density of the MEAs at 0.95 V is similar (0.026 for Pt/C vs. 0.028 A cm−2 for Pt–RuO2/C) at similar metal loading (Fig. S10, ESI†), while the performance difference became significant as the current density increases. For instance, the current density of the Pt–RuO2/C catalyzed MEA at 0.85 V is 0.22 A cm−2, approximately two-times the current density of the Pt/C catalyzed MEA. This result is consistent with the RDE experiment where the kinetic activity of Pt–RuO2/C and Pt/C is comparable, but the overall activity of the Pt/C catalyst is hindered by the adverse adsorption of the phenyl groups of the ionomer. The performance comparison between PtRu/C and Pt–RuO2/C catalyzed MEAs indicates that the kinetic performance of the MEA using PtRu/C catalysts is slightly higher than that of Pt–RuO2/C (0.036 for PtRu/C vs. 0.028 A cm−2 for Pt–RuO2/C at 0.95 V). However, in terms of the performance at the high current density region, ca. >1.0 A cm−2, the Pt–RuO2/C catalyzed MEA showed significantly higher performance than the PtRu/C catalyzed MEA. The notably higher performance of the Pt–RuO2/C catalyzed MEA could not be explained only by the phenyl group adsorption since both catalysts have minimal phenyl group adsorption. There are two possible reasons behind the high performance of Pt–RuO2/C. First, the lower ratio of metal to carbon in the electrocatalyst (15% for Pt–RuO2/C vs. 75% for PtRu/C) increases the electrode thickness, which improves the mass transport at the low loading anode.41 The electrode thickness effect is also apparent in fuel cell performance as a function of anode PGM loading (Fig. S11, ESI†). The peak power density of Pt–RuO2/C MEA increased only about 20% with 4-times higher anode catalyst loading, while the peak power density of PtRu/C MEA increased ∼3.5 times with 4-times higher anode catalyst loading. This indicates that our novel Pt–RuO2/C heterojunction catalyst works really well for low PGM loading electrodes; on the other hand, the commercial PtRu/C catalysts with high metal content only perform well at higher PGM loadings. Second, the ultrafine Pt clusters surrounded by large RuO2 particles create desirable morphology for mass transport. The superior H2 mass transport of the Pt–RuO2/C at the low loading electrode is also evidenced by the AEMFC performance at reduced H2 flow. The Pt–RuO2/C catalyzed MEA shows only slightly inferior performance of 0.72 W cm−2 at a much lower flow rate, while more significant performance loss is observed for the PtRu/C catalyzed MEA (Fig. S12, ESI†). The Pt–RuO2/C MEA shows the peak power density of 0.33 W cm−2 at 0.48 V, achieving the specific power of 13.2 W mgPt−1 under H2/CO2-free air conditions (Fig. S13, ESI†). The kinetic performance of the Pt–RuO2/C catalyzed MEA at 0.85 V was two times higher than the Pd–CeO2/C catalyzed MEAs reported in the literature.42 The performance stability of a Pt–RuO2/C MEA was compared with Pt/C MEA at 80 °C (Fig. S14, ESI†). The performance of the Pt–RuO2/C MEA gradually degraded over time, yet the degradation rate was slower than the Pt/C MEA. It is difficult to assess the stability of Pt–RuO2 because the MEA degradation likely occurred with other component degradations43 (Fig. S15, ESI†). Nonetheless, the stability of Pt–RuO2 is at least a similar level to Pt/C under the constant cell voltage conditions. Further investigation may be needed for the catalyst stability under start/stop conditions which may increase the anode potential to degrade anode catalysts.44–46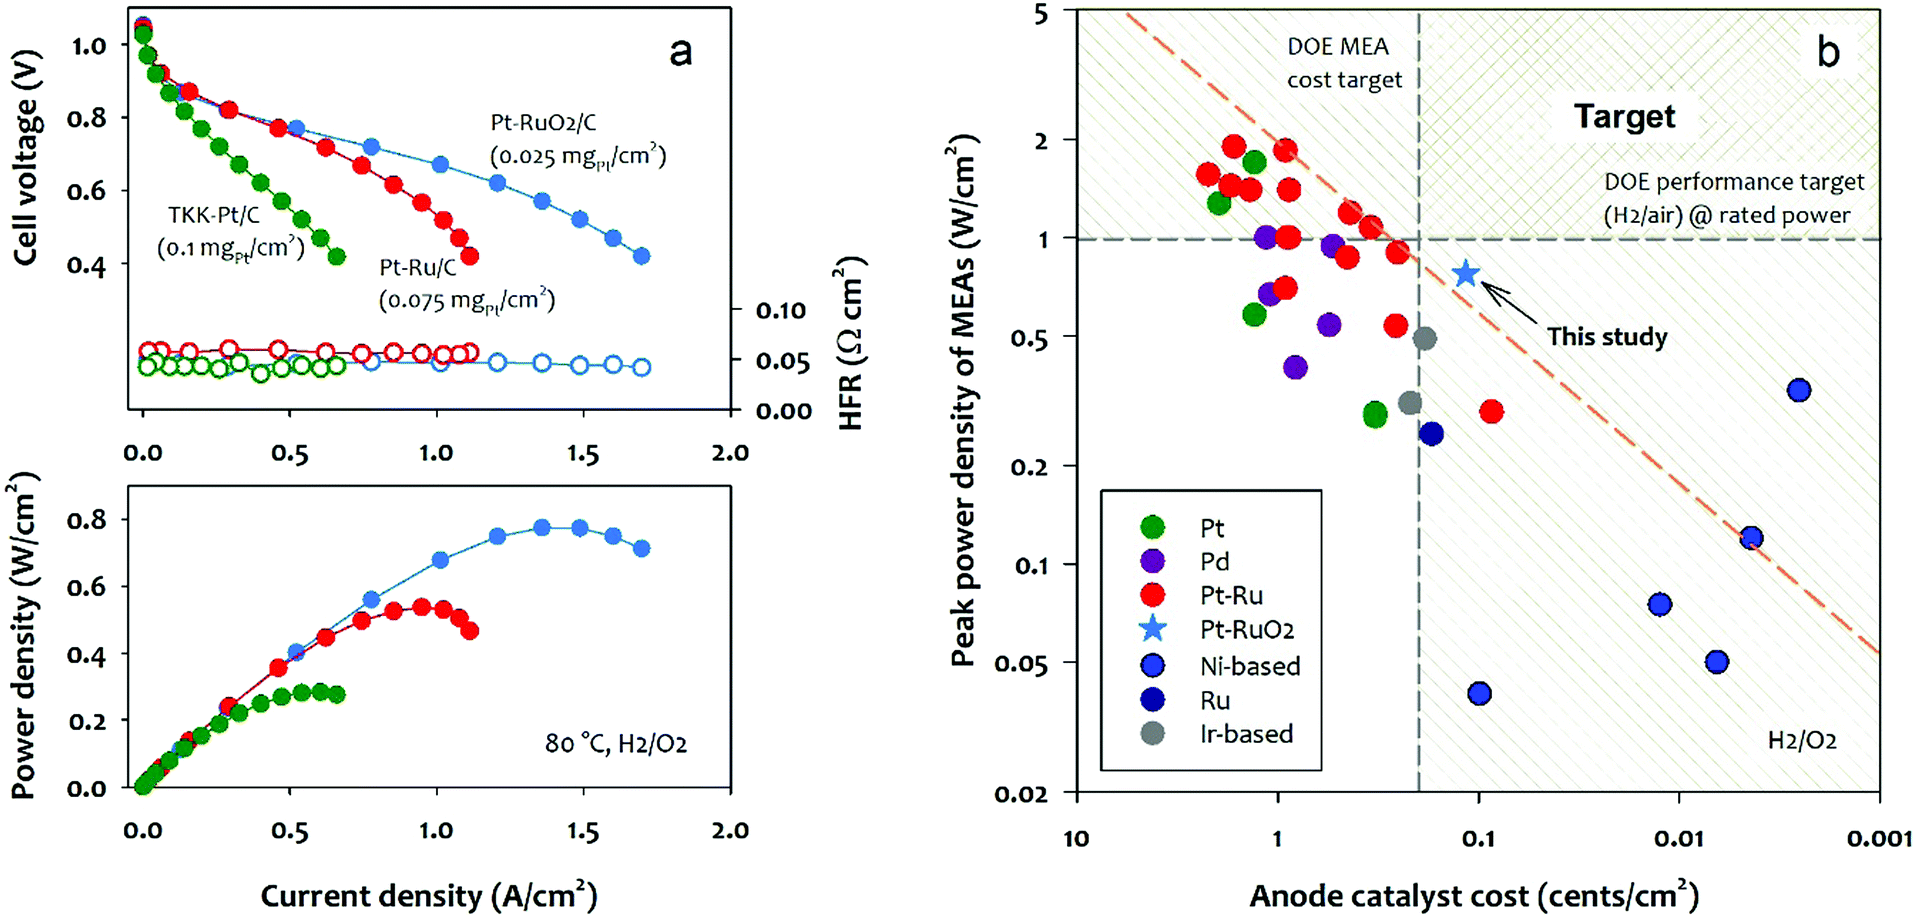 | ||
| Fig. 4 (a) AEMFC performance comparison between MEAs; anode catalyst: Pt–RuO2/C, TKK–Pt/C, and JM HiSPEC 12100 Pt–Ru/C, cathode catalyst: Pt/C (0.6 mgPt cm−2). AEMFC performance at 80 oC with humidified H2 (2000 sccm) and O2 (1000 sccm) at 285 kPa backpressure. (b) AEMFC peak power density comparison as a function of anode catalyst cost; AEMFC performance was taken from literature reports. Anode catalyst cost was calculated from the 5-year average of the base metal price. | ||
We further compare the reported AEMFC performance as a function of the cost of the anode catalyst. For this analysis, we collected the peak power density of AEMFCs using the state-of-the-art anode catalysts in the literature6,29,47–57 and compared the AEMFC performance normalized for anode catalyst cost per cm2 based on the five-year average price of metals (Table S1, ESI†). Fig. 4b plots the peak power density of the MEAs as a function of anode catalyst cost with two target lines, i.e., 2020 U.S. DOE MEA cost target (0.2 cents per cm2) and the rated performance at rated power (1 W cm−2) under H2/air conditions. Fig. 4b shows that Pt–Ru alloy catalysts have better performance than Pt, Pd, Ru, and Ir-based catalysts at a given catalyst cost. Among the Pt–Ru alloy catalysts shown in Red symbols, four catalysts are located on the upper-performance–cost limit (red dash line).16,49 These catalysts are the commercial PtRu HiSPEC10000 (Pt nominally 40 wt%, and Ru nominally 20 wt%) supported on Vulcan XC-72R carbon. Two Ni-based non-PGM catalysts have reached or even surpassed the upper-performance–cost target.14,53 However, their cell performance needs to improve to reach the DOE performance target. The Pt–RuO2 heterojunction catalyst we prepared from this work also located beyond the upper-performance–cost limit. The performance–cost analysis suggests that the formation of ultrafine Pt clusters with a Pt–Ru heterojunction is a promising approach to meet the U.S. DOE fuel cell cost and performance targets for transportation applications.
Conclusions
This communication is the first report of a highly active Pt-RuO2 heterojunction HOR catalyst with unique morphology of ultrafine Pt clusters instead of alloying Pt and Ru components. The Pt–RuO2 heterojunction catalyst was developed by converting the Ru rich phase of PtRu8 nano-dendrite into Pt–RuO2. The synthetic conditions of PtRu8 nano-dendrites were investigated, and preliminary scale-up was explored. With the successful demonstration of one-pot synthesis, further scale-up should be attainable. The Pt–RuO2 heterojunction catalyst showed excellent catalytic activity towards the HOR and significantly lower phenyl group adsorption properties compared with a commercial Pt/C catalyst. The AEMFC test suggests that the structure of the Pt–RuO2 heterojunction catalyst provides high accessibility of H2 at an ultra-low loading anode with the combination of good kinetic activity and less degree of phenyl adsorption, making an ideal low PGM loading catalyst for AEMFCs. This result suggests that the high HOR activity of Pt–Ru bimetallic catalysts may be originated from bi-functionality, ca. high HOR activity by Pt element and efficiently removing surface phenyl groups by Ru element instead of electronic structure change of Pt by alloying with Ru.Experimental
PtRu8 nano-dendrite synthesis
The synthesis of PtRu8 nano-dendrites was performed in an Ar flow environment in a round bottom flask. Typically, 0.12 g ruthenium(III) acetylacetonate [Ru(acac)3], 2 mL oleylamine, 0.063 g 1,2-tetradecanediol, and 10 mL diphenyl ether were heated to 200 °C when 0.012 g platinum(II) acetylacetonate [Pt(acac)2] dispersed in 1 mL dichlorobenzene was injected. The mixture was heated up slowly to 260 °C. The reaction time was controlled to 20–30 min starting from injection. Scale-up synthesis was performed in a bigger round bottom flask with a similar synthesis procedure and 6 times higher reaction precursors and reaction volume (safety warning: severe boiling was observed above 230 °C because the boiling point of dichlorobenzene is only 180 °C. Great care should be taken on the heating rate to avoid pressure buildup in the flask). One-pot synthesis was performed in a similar procedure except that all the reaction precursors were heated up in a round bottom flask. By doing so the hot injection step was eliminated. PtRu8 nano-dendrites were separated from solvents by centrifugation (10000 rpm for 10 min) and dispersed in chloroform.
Pt–RuO2 heterojunction catalyst preparation
PtRu8 nano-dendrites dispersed in chloroform were mixed with an appropriate amount of carbon which was also dispersed in chloroform by sonication. The mixture was sonicated for 20 min and the carbon supported PtRu8 nano-dendrites were precipitated with hexane and further separated from the solvents by centrifugation. This process also works for scale-up sample preparation, where a larger amount of solvents was used to ensure good dispersion of PtRu8 nano-dendrites on carbon. The carbon supported PtRu8 nano-dendrites were annealed in air at 185 °C overnight to convert elemental Ru into RuO2 and to remove the surfactant adsorbed on the surface of the catalyst.Physical characterization
The TEM images were obtained on FEI Tecnai F20 and JEM-2100F microscopes with accelerating voltage at 300 and 200 kV, respectively. Selected area electron diffraction patterns and energy dispersive X-ray spectroscopy (EDS) results were recorded with JEM-2100F microscope equipped with an Oxford EDS detector. High angle angular dark field (HAADF) images and energy dispersive X spectroscopy mapping were recorded on an FEI Talos F200X scanning transmission electron microscope (STEM) with an accelerating voltage of 200 kV at the Center for Nanoscale Materials, Argonne National Laboratory. XRD patterns were recorded from a Siemens diffractometer D5000. The ICP results of the PtRu sample are 7.4 (Ru):1 (Pt), 7.6 (Ru):1 (Pt), and 7.7 (Ru):1 (Pt) for 3 runs. It is averaged to 7.6 (Ru):1 (Pt) and the sample in the manuscript was denoted as PtRu8.
Rotating disk electrode (RDE) study
Synthesized Pt–RuO2/C (17% metal wt on high surface area carbon, Pt/Ru atomic ratio 1/8) and commercial Pt/C (TKK TEC10E20A, 19.4% Pt wt) were dispersed in water under untrasonication. The catalyst concentration of both inks was 1.25 mg mL−1. The ink was pipetted onto a glassy carbon disk (5 mm in diameter) to make 20 μg cm−2 metal loading and dried in air at room temperature. 10 μL of Nafion D521 (Diluted to 0.1 wt%) was then added on the surface as a binder to keep the catalyst on the glassy carbon.A home-made FEP cell was used for electrochemical characterization of the catalyst. 0.1 M aqueous solution of sodium hydroxide (NaOH, 99.99% from Sigma Aldrich) and benzyltrimethylammonium hydroxide (BTMAOH, 40 wt% solution in water from TCI Chemical) were used as an electrolyte. A mercury/mercury oxide (Hg/HgO) electrode (Pine) was the reference electrode and a graphite rod (Sigma Aldrich) was the counter electrode. The reference potential was converted to reversible hydrogen electrode (RHE). Cyclic voltammograms were recorded in a nitrogen purged electrolyte. Before hydrogen oxidation reaction curves were recorded at 900 rpm, the electrolyte was saturated with hydrogen and the working electrode was subjected to 1.40 V for 30 seconds to remove the cation adsorption.
Membrane electrode assembly (MEA)
The catalyst inks for the anode were formulated using Pt/C (TKK TEC10E20A, 19.4 wt% Pt), PtRu/C (Johnson Matthey HiSPEC 12100) or synthesized Pt–RuO2/C (15% metal loading on TKK carbon support) with alkyl ammonium tethered poly(fluorene) (FLN) ionomer (5 wt% in 1:1 solution of isopropanol–ethanol) in 20:80 v/v% water–isopropanol solution. The metal loading of the Pt–RuO2/C slightly decreased for scale-up synthesis due to possible sintering. Note that we used a 75 wt% PtRu/C anode catalyst for comparison because the PtRu/C catalysts from Johnson Matthey showed the best AEMFC performance as no equivalent metal loading (15–20 wt%) PtRu/C catalysts are available from Johnson Matthey. The three sets of anodes were prepared with different Pt loading where the I/C ratios were 40% for Pt/C, PtRu/C and synthesized Pt–RuO2/C, respectively. The Pt/C (HiSPEC® 9100, Johnson Matthey Fuel Cells, USA) and FLN ionomer were used for the cathode in all MEAs. For the cathodes, the Pt loading and ionomer/catalyst (I/C) ratio were 0.6 mgPt cm−2 and 42%, respectively. The catalyst ink was brush painted on the BC-29 (gas diffusion layer, 5 cm2, 270 μm thickness) on the vacuum table at 60 °C.
The quaternized poly(terphenylene) (TPN) membrane was used as a polymer electrolyte. The prepared anode, cathode and membrane were used to fabricate the MEA after converting to hydroxide form by immersing in 1 M NaOH solution. The MEA was then placed into the fuel cell hardware (5 cm2, serpentine flow field) supplied by Fuel Cell Technologies Inc.
Single-cell tests
Pure hydrogen at 2000 sccm and oxygen or CO2-free air at 1000 sccm were supplied to the anode and cathode respectively at 100% RH. All the fuel cell tests were performed at an operating temperature of 80 °C. The polarization curves were acquired at absolute backpressures of 285 kPa using a fuel cell station (Fuel Cell Technologies Inc., USA). A built-in impedance analyzer was used to measure HFR while obtaining the polarization curves.Catalyst cost calculations
The catalyst cost is estimated based on the 5-year average cost of the base metals (J. Matthey, http://www.platinum.matthey.com/prices). Table S1 (ESI†) shows the average price of the base metals used for the catalyst cost estimation.Conflicts of interest
There are no conflicts to declare.Acknowledgements
This work was supported by U.S. Department of Energy (US DOE), Office of Energy Efficiency and Renewable Energy (EERE), Fuel Cell Technologies Office (FCTO). The research was conducted at both, Los Alamos National Laboratory operated by Triad National Security, LLC under U.S. Department of Energy Contract Number 89233218CNA000001, and Argonne National Laboratory a U.S. Department of Energy Office of Science laboratory, operated by UChicago Argonne, LLC under Contract Number DE-AC02-06CH11357. The use of the Center for Nanoscale Materials, an Office of Science user facility, was supported by the U.S. Department of Energy, Office of Science, Office of Basic Energy Sciences, under Contract No. DE-AC02-06CH11357. We thank Professor Chulsung Bae at Rensselaer Polytechnic Institute for providing the membrane and ionomers for AEMFC testing. D. L. thanks the Electron Microscopy Laboratory at LANL for providing facilities and support for transmission microscopy.References
- S. Gottesfeld, D. R. Dekel, M. Page, C. Bae, Y. S. Yan, P. Zelenay and Y. S. Kim, J. Power Sources, 2018, 375, 170–184 CrossRef CAS.
- A. Serov, I. V. Zenyuk, C. G. Arges and M. Chatenet, J. Power Sources, 2018, 375, 149–157 CrossRef CAS.
- L. Q. Wang, J. J. Brink, Y. Liu, A. M. Herring, J. Ponce-Gonzalez, D. K. Whelligan and J. R. Varcoe, Energy Environ. Sci., 2017, 10, 2154–2167 RSC.
- T. J. Omasta, A. M. Park, J. M. LaManna, Y. F. Zhang, X. Peng, L. Q. Wang, D. L. Jacobson, J. R. Varcoe, D. S. Hussey, B. S. Pivovar and W. E. Mustain, Energy Environ. Sci., 2018, 11, 551–558 RSC.
- T. J. Omasta, L. Wang, X. Peng, C. A. Lewis, J. R. Varcoe and W. E. Mustain, J. Power Sources, 2018, 375, 205–213 CrossRef CAS.
- Y. Wang, G. W. Wang, G. W. Li, B. Huang, J. Pan, Q. Liu, J. J. Han, L. Xiao, J. T. Lu and L. Zhuang, Energy Environ. Sci., 2015, 8, 177–181 RSC.
- L. Q. Wang, J. J. Brink and J. R. Varcoe, Chem. Commun., 2017, 53, 11771–11773 RSC.
- Y. Wang, Y. Yang, S. F. Jia, X. M. Wang, K. J. Lyu, Y. Q. Peng, H. Zheng, X. Wei, H. Ren, L. Xiao, J. B. Wang, D. A. Muller, H. D. Abruna, B. O. E. Hwang, J. T. Lu and L. Zhuang, Nat. Commun., 2019, 10, 1506 CrossRef.
- T. Bhowmik, M. K. Kundu and S. Barman, ACS Catal., 2016, 6, 1929–1941 CrossRef CAS.
- H. A. Miller, A. Lavacchi, F. Vizza, M. Marelli, F. Di Benedetto, F. D. I. Acapito, Y. Paska, M. Page and D. R. Dekel, Angew. Chem., Int. Ed., 2016, 55, 6004–6007 CrossRef CAS.
- S. Maurya, J. H. Dumont, C. N. Villarrubia, I. Matanovic, D. G. Li, Y. S. Kim, S. Noh, J. Y. Han, C. Bae, H. A. Miller, C. H. Fujimoto and D. R. Dekel, ACS Catal., 2018, 8, 9429–9439 CrossRef CAS.
- T. J. Omasta, X. Peng, H. A. Miller, F. Vizza, L. Q. Wang, J. R. Varcoe, D. R. Dekel and W. E. Mustain, J. Electrochem. Soc., 2018, 165, J3039–J3044 CrossRef CAS.
- J. Matthey, http://www.platinum.matthey.com/prices.
- S. Kabir, K. Lemire, K. Artyushkova, A. Roy, M. Odgaard, D. Schlueter, A. Oshchepkov, A. Bonnefont, E. Savinova, D. C. Sabarirajan, P. Mandal, E. J. Crumlin, I. V. Zenyuk, P. Atanassov and A. Serov, J. Mater. Chem. A, 2017, 5, 24433–24443 RSC.
- A. G. Oshchepkov, A. Bonnefont, S. N. Pronkin, O. V. Cherstiouk, C. Ulhaq-Bouillet, V. Papaefthimiou, V. N. Parmon and E. R. Savinova, J. Power Sources, 2018, 402, 447–452 CrossRef CAS.
- T. J. Omasta, Y. F. Zhang, A. M. Park, X. Peng, B. Pivovar, J. R. Varcoe and W. E. Mustain, J. Electrochem. Soc., 2018, 165, F710–F717 CrossRef CAS.
- W. C. Sheng, H. A. Gasteiger and Y. Shao-Horn, J. Electrochem. Soc., 2010, 157, B1529–B1536 CrossRef CAS.
- E. S. Davydova, S. Mukerjee, F. Jaouen and D. R. Dekel, ACS Catal., 2018, 8, 6665–6690 CrossRef.
- D. R. Dekel, Curr. Opin. Electrochem., 2018, 12, 182–188 CrossRef CAS.
- D. Li, H. T. Chung, S. Maurya, I. Matanovic and Y. S. Kim, Curr. Opin. Electrochem., 2018, 12, 189–195 CrossRef CAS.
- R. Subbaraman, D. Tripkovic, D. Strmcnik, K. C. Chang, M. Uchimura, A. P. Paulikas, V. Stamenkovic and N. M. Markovic, Science, 2011, 334, 1256–1260 CrossRef CAS.
- R. Subbaraman, D. Tripkovic, K. C. Chang, D. Strmcnik, A. P. Paulikas, P. Hirunsit, M. Chan, J. Greeley, V. Stamenkovic and N. M. Markovic, Nat. Mater., 2012, 11, 550–557 CrossRef CAS.
- D. Strmcnik, M. Uchimura, C. Wang, R. Subbaraman, N. Danilovic, D. Van Der Vliet, A. P. Paulikas, V. R. Stamenkovic and N. M. Markovic, Nat. Chem., 2013, 5, 300–306 CrossRef CAS.
- E. Liu, J. Li, L. Jiao, H. T. T. Doan, Z. Liu, Z. Zhao, Y. Huang, K. M. Abraham, S. Mukerjee and Q. Jia, J. Am. Chem. Soc., 2019, 141, 3232–3239 CrossRef CAS.
- Q. Jia, E. Liu, L. Jiao, J. Li and S. Mukerjee, Curr. Opin. Electrochem., 2018, 12, 209–217 CrossRef CAS.
- H. T. Chung, U. Martinez, I. Matanovic and Y. S. Kim, J. Phys. Chem. Lett., 2016, 7, 4464–4469 CrossRef CAS.
- S. Maurya, S. Noh, I. Matanovic, E. J. Park, C. N. Villarrubia, U. Martinez, J. Han, C. Bae and Y. S. Kim, Energy Environ. Sci., 2018, 11, 3283–3291 RSC.
- S. Maurya, C. H. Fujimoto, M. R. Hibbs, C. N. Villarrubia and Y. S. Kim, Chem. Mater., 2018, 30, 2188–2192 CrossRef CAS.
- G. Huang, M. Mandal, X. Peng, A. C. Yang-Neyerlin, B. S. Pivovar, W. E. Mustain and P. A. Paul, J. Electrochem. Soc., 2019, 166, F637–F644 CrossRef CAS.
- L. Q. Wang, E. Magliocca, E. L. Cunningham, W. E. Mustain, S. D. Poynton, R. Escudero-Cid, M. M. Nasef, J. Ponce-Gonzalez, R. Bance-Souahli, R. C. T. Slade, D. K. Whelligan and J. R. Varcoe, Green Chem., 2017, 19, 831–843 RSC.
- L. Dubau, F. Hahn, C. Coutanceau, J. M. Léger and C. Lamy, J. Electroanal. Chem., 2003, 554-555, 407–415 CrossRef CAS.
- L. Dubau, C. Coutanceau, E. Garnier, J. M. Léger and C. Lamy, J. Appl. Electrochem., 2003, 33, 419–429 CrossRef CAS.
- H. A. Gasteiger, S. S. Kocha, B. Sompalli and F. T. Wagner, Appl. Catal., B, 2005, 56, 9–35 CrossRef CAS.
- S. S. Kocha, K. Shinozaki, J. W. Zack, D. J. Myers, N. N. Kariuki, T. Nowicki, V. Stamenkovic, Y. J. Kang, D. G. Li and D. Papageorgopoulos, Electrocatalysis, 2017, 8, 366–374 CrossRef CAS.
- S. M. Alia and B. S. Pivovar, J. Electrochem. Soc., 2018, 165, F441–F455 CrossRef CAS.
- S. D. Yim, H. T. Chung, J. Chlistunoff, D. S. Kim, C. Fujimoto, T. H. Yang and Y. S. Kim, J. Electrochem. Soc., 2015, 162, F499–F506 CrossRef CAS.
- I. Matanovic, S. Maurya, E. J. Park, J. Y. Jeon, C. Bae and Y. S. Kim, Chem. Mater., 2019, 31, 4195–4204 CrossRef CAS.
- J. Staszak-Jirkovsky, C. D. Malliakas, P. P. Lopes, N. Danilovic, S. S. Kota, K. C. Chang, B. Genorio, D. Strmcnik, V. R. Stamenkovic, M. G. Kanatzidis and N. M. Markovic, Nat. Mater., 2016, 15, 197–203 CrossRef CAS.
- I. Matanovic, H. T. Chung and Y. S. Kim, J. Phys. Chem. Lett., 2017, 8, 4918–4924 CrossRef CAS.
- Y. S. Kim and B. S. Pivovar, J. Electrochem. Soc., 2010, 157, B1616–B1623 CrossRef CAS.
- D. A. Langlois, A. S. Lee, N. Macauley, S. Maurya, M. E. Hawley, S. D. Yim and Y. S. Kim, J. Power Sources, 2018, 396, 345–354 CrossRef CAS.
- M. Bellini, M. V. Pagliaro, A. Lenarda, P. Fornasiero, M. Marelli, C. Evangelisti, M. Innocenti, Q. Jia, S. Mukerjee, J. Jankovic, L. Wang, J. R. Varcoe, C. B. Krishnamurthy, I. Grinberg, E. Davydova, D. R. Dekel, H. A. Miller and F. Vizza, ACS Appl. Energy Mater., 2019, 2, 4999–5008 CrossRef CAS.
- S. Maurya, A. S. Lee, D. Li, E. J. Park, D. P. Leonard, S. Noh, C. Bae and Y. S. Kim, J. Power Sources, 2019, 436, 226866 CrossRef CAS.
- A. Zadick, L. Dubau, N. Sergent, G. Berthomé and M. Chatenet, ACS Catal., 2015, 5, 4819–4824 CrossRef CAS.
- C. Lafforgue, M. Chatenet, L. Dubau and D. R. Dekel, ACS Catal., 2018, 8, 1278–1286 CrossRef CAS.
- C. Lafforgue, F. Maillard, V. Martin, L. Dubau and M. Chatenet, ACS Catal., 2019, 9, 5613–5622 CrossRef CAS.
- Y. Y. Cong, I. T. McCrum, X. Q. Gao, Y. Lv, S. Miao, Z. G. Shao, B. L. Yi, H. M. Yu, M. J. Janik and Y. J. Song, J. Mater. Chem. A, 2019, 7, 3161–3169 RSC.
- M. Alesker, M. Page, M. Shviro, Y. Paska, G. Gershinsky, D. R. Dekel and D. Zitoun, J. Power Sources, 2016, 304, 332–339 CrossRef CAS.
- Q. H. Li, H. Q. Peng, Y. M. Wang, L. Xiao, J. T. Lu and L. Zhuang, Angew. Chem., Int. Ed., 2019, 58, 1442–1446 CrossRef CAS.
- A. L. G. Biancolli, D. Herranz, L. Q. Wang, G. Stehlikova, R. Bance-Soualhi, J. Ponce-Gonzalez, P. Ocon, E. A. Ticianelli, D. K. Whelligan, J. R. Varcoe and E. I. Santiago, J. Mater. Chem. A, 2018, 6, 24330–24341 RSC.
- S. F. Lu, J. Pan, A. B. Huang, L. Zhuang and J. T. Lu, Proc. Natl. Acad. Sci. U. S. A., 2008, 105, 20611–20614 CrossRef CAS.
- Q. P. Hu, G. W. Li, J. Pan, L. S. Tan, J. T. Lu and L. Zhuang, Int. J. Hydrogen Energy, 2013, 38, 16264–16268 CrossRef CAS.
- A. Roy, M. R. Talarposhti, S. J. Normile, I. V. Zenyuk, V. De Andrade, K. Artyushkova, A. Serov and P. Atanassov, Sustainable Energy Fuels, 2018, 2, 2268–2275 RSC.
- S. Gu, W. C. Sheng, R. Cai, S. M. Alia, S. Q. Song, K. O. Jensen and Y. S. Yan, Chem. Commun., 2013, 49, 131–133 RSC.
- B. W. Qin, H. M. Yu, X. Q. Gao, D. W. Yao, X. Y. Sun, W. Song, B. L. Yi and Z. G. Shao, J. Mater. Chem. A, 2018, 6, 20374–20382 RSC.
- J. Ohyama, T. Sato and A. Satsum, J. Power Sources, 2013, 225, 311–315 CrossRef CAS.
- B. W. Qin, H. M. Yu, J. Jia, C. Jun, X. Q. Gao, D. W. Yao, X. Y. Sun, W. Song, B. L. Yi and Z. G. Shao, Nanoscale, 2018, 10, 4872–4881 RSC.
Footnotes |
| † Electronic supplementary information (ESI) available. See DOI: 10.1039/c9nh00533a |
| ‡ These authors contributed equally. |
| This journal is © The Royal Society of Chemistry 2020 |