
Surface related intrinsic luminescence from carbon nanodots: solvent dependent piezochromism†
Pengtao
Jing‡
a,
Dong
Han‡
a,
Di
Li
a,
Ding
Zhou
a,
Dezhen
Shen
a,
Guanjun
Xiao
 *b,
Bo
Zou
b and
Songnan
Qu
*a
*b,
Bo
Zou
b and
Songnan
Qu
*a
aState Key Laboratory of Luminescence and Applications, Changchun Institute of Optics, Fine Mechanics and Physics, Chinese Academy of Sciences, 3888 Eastern South Lake Road, Changchun 130033, China. E-mail: qusn@ciomp.ac.cn
bState Key Laboratory of Superhard Materials, College of Physics, Jilin University, Changchun 130012, China. E-mail: xguanjun@jlu.edu.cn
First published on 20th September 2018
Abstract
There has been a long standing debate on the luminescence origination from carbon nanodots (CDs). Herein, we report the solvent dependent piezochromism of CDs by diamond anvil cells experiment. Red- and blue-shift piezochromism were observed in CDs with N,N-dimethylformamide and water as pressure transmitting medium (PTM) with increasing pressure from atmospheric pressure to 25 GPa, which were related to increased π–π stacking and protic-solvent-induced surface chemical structural changes, respectively. Based on theoretical modeling and structural analysis of hydrothermally treated CDs (h-CDs), the reversible and irreversible piezochromism from green emission to blue emission with water as PTM was attributed to pressure induced enhanced intermolecular hydrogen bonding and addition reaction between water molecules and surface electron withdrawing groups on the CDs, respectively. The decreased electron withdrawing ability of the surface chemical structures of CDs further affects their intrinsic luminescence. This work provides a new understanding of the piezochromic luminescence origination from CDs, which is related to the surface related intrinsic luminescence.
Conceptual insightsThe in situ optical characterization under high pressure is a straightforward and efficient method to study the structural and electronic properties of luminescent materials. Generally, solvent acts as pressure transmitting medium (PTM) in diamond anvil cells (DAC) experiment. Previous literatures have reported that solvents modulate PL properties of carbon dots (CDs) under atmospheric pressure. It is still a challenge to produce the high pressure and solvent induced surface structural changes of CDs to understand their luminescence origination. We reported solvent dependent piezochromism of CDs using DAC experiment. We observed red- and blue-shift piezochromism in CDs with aprotic and protic solvents as PTM with increasing pressure from atmospheric pressure to 25 GPa, respectively. The irreversible blue-shift piezochromism in protic solvent (water or ethanol) was attributed to the high pressure induced addition reaction between solvent molecules and surface electron withdrawing groups on the CDs. In contrast, the reversible red-shift piezochromism in aprotic solvent (N,N-dimethylformamide) provided evidence of enhanced π–π stacking in the inner core of CDs. We anticipate that this work will benefit the fundamental understanding of the luminescence origination from CDs and tuning their intrinsic luminescence to promote their applications in bio-imaging, lasing materials, and light emitting diodes. |
Introduction
Luminescent carbon nanodots (CDs) have attracted much attention and show great potential applications in bioimaging,1–5 light-emitting diodes,6–8 and lasers,9 due to their superior properties such as low cost, biocompatibility, bright fluorescence, and high photostability.10–15 Strong photoluminescence (PL) was usually observed in nitrogen- and oxygen-rich CDs.16–18 However, the luminescence origination from CDs is still unclear, which is the fundamental issue for rational designation and development of CDs. The debate on luminescence origination from CDs is focused on whether it is from intrinsic state or extrinsic state.19–22 The former is considered to be from the sp2 C conjugated domains in the inner cores, while the latter is supposed to be from surface defects or surface molecular fluorophores.19–22 In addition, PL emission from radiative recombination of self-trapped excitons has been demonstrated in recent literature.23 These PL mechanisms have been discussed in several CDs systems. Due to the numerous precursors and synthesis conditions, it is difficult to give a clear picture of the relation of the surface chemical structures and optical properties of CDs. Thus, it is of great scientific interest to tune the intrinsic emissions from CDs to well understand their luminescence origination and the influencing factors.The application of high pressure can be a straightforward and efficient way to study the structural and electronic properties of CDs. The transition from sp2 bonded graphite to sp3 bonded diamond under high-pressure and high-temperature conditions has been studied for over 50 years.24,25 Very recently, piezochromic luminescence was reported in two literatures. At high pressure of 22.84 GPa, blue-shift piezochromism of PL emission from yellow to green was observed in a CDs ethanol solution.26 The authors proposed that the color change in the luminescence of the yellow emissive CDs is attributed to the structure transition from sp2 domains to sp3 hybridized domains under high pressure. In another study, pressure-triggered blue- and red-shifted PL were observed in a type of CDs, which were attributed to the decrease of surface carbonyl groups and enhanced π–π stacking, respectively.27 The tunable piezochromic luminescence indicated that the PL from CDs was not only related to the sp2 structure domain but also affected by the surface chemical environments.28–31 Surface groups of CDs, such as pyridinic N and carbonyl O, have been demonstrated to play an important role in the PL from CDs.29,31 Previous literatures have shown that solvents modulated PL properties of CDs under atmospheric pressure.28,29,32 Therefore, optical properties of CDs under high pressure in different solvents could shine light on understanding the relation of surface chemical structures and optical properties of CDs. To the best of our knowledge, solvent dependent piezochromism has not been investigated in CDs. It is still a challenge to produce the high pressure and solvent induced surface structural changes of CDs to understand their related optical changes.
Herein, in situ optical properties of microwave synthesized CDs under high pressure with water and N,N-dimethylformamide (DMF) as pressure transmitting medium (PTM) were investigated by the diamond anvil cells (DAC) experiment. Red-shift piezochromism was observed in CDs with water or DMF as PTM with increasing pressure from 0 GPa to 1.8 GPa. Blue-shift piezochromism from green emission to blue emission was only observed in CDs with water as PTM with increasing pressure from 1.8 GPa to 25 GPa, which can be partially recovered with pressure relaxation to 0 GPa. In contrast, recoverable and red-shift piezochromism was observed in CDs with DMF as PTM with increasing pressure from 1.8 GPa to 25 GPa. Furthermore, similar unrecoverable blue emission after high pressure relaxation in water as PTM was obtained from the CDs by hydrothermal treatment (h-CDs). Based on theoretical modeling and structural analysis of h-CDs, the high pressure induced reversible and irreversible blue-shift piezochromism from green emission to blue emission with water as PTM was attributed to pressure induced enhanced intermolecular hydrogen bonding and addition reaction between water molecules and surface electron withdrawing groups on the CDs, respectively. This decreased the electron withdrawing ability of the surface chemical structures of CDs, and further affected their intrinsic luminescence.
Results and discussion
The green emissive CDs were synthesized via a microwave assisted method from citric acid and urea, as reported in our previous study.9,13 Well-resolved lattice fringes with an interplanar spacing of 0.21 nm of CDs were close to the (100) facet of graphitic carbon, as seen in the HR-TEM image (Fig. S1, ESI†). Absorption and PL spectra of CDs in water and DMF under atmospheric pressure are shown in Fig. S2 in ESI.† The absorption peak of CDs is red-shifted from 410 nm in water to 420 nm in DMF, while the maximum PL peak of CDs is blue-shifted from 540 nm in water to 520 nm in DMF. The PL quantum yield (QY) of CDs in water was about 18%, while that of CDs in DMF was enhanced to 44%. The fluorescence quenching of CDs in water could be attributed to proton transfer dynamics.31–33 It can be inferred that water molecules interact with the surface of CDs, which affects their luminescence processes and prevents efficient luminescence.Considering the solvents dependent PL properties, a DAC experiment was used to investigate the optical properties of the CDs under high pressure with water or DMF as PTM. The experimental setup is shown in Fig. S3 in ESI.† The piezochromism from green to blue was clearly observed in images of CDs in water from 0 GPa to 25 GPa, while green emission was observed in DMF even in 25 GPa (Fig. 1a and b). The PL spectra evolution of CDs in water under different pressures is shown in Fig. 1c. The PL peak of CDs in water firstly red-shifted from 540 nm to 550 nm with increasing pressure from atmospheric pressure to 1.8 GPa, and then blue-shifted to 470 nm upon further compression to 25 GPa (Fig. 1e). The red-shifted PL from atmospheric pressure to 1.8 GPa can be attributed to the increasing π–π stacking.25,34,35 The PL peak instantaneously changes from 555 nm to 535 nm at 1.8 GPa. To exclude the influence of phase transition from liquid to solid,36 PL spectra of CDs in water (room temperature) and ice (0 °C) were measured and it showed similar PL peak (Fig. S4, ESI†). Thus, the blue-shift piezochromism of CDs at 1.8 GPa is not related to phase transition of H2O, but the PL intensity quenching of CDs at 1.8 GPa may be related to the decreased transparency of solid H2O under high pressure with small bubbles like that in ice. In previous literature, the origin of blue-shift piezochromism of CDs from yellow emission to blue–green emission with increasing pressure from atmospheric pressure to 23 GPa was attributed to the structural transitions from sp2 domains to sp3 hybridized domains.24 However, the PL peak of CDs in DMF continuously red-shifted from 530 nm to 545 nm with increasing pressure from atmospheric pressure to 25 GPa (Fig. 1d and e), indicating pressure induced structural transitions from sp2 domains to sp3 hybridized domains did not take place in this case. The continuous red-shift piezochromism of CDs in DMF should be due to enhanced π–π stacking of the inner core under high pressure.27,37,38 Thus, it can be inferred that the blue-shift piezochromism of CDs in water is not due to the structural transition from sp2 C to sp3 C, but may be related to the solvent dependent pressure induced surface chemical changes, which further affect their intrinsic luminescence. The normalized emission intensity of CDs in water and DMF with increasing pressure is shown in Fig. 1f. The PL intensity of CDs in water shows two quenching steps, from 100% to 8% and from 8% to 2% for pressure increasing from 0 GPa to 1.8 GPa and further to 25 GPa, respectively. In contrast, the PL intensity of CDs in DMF continuously decreases to 10% with pressure increasing from atmospheric pressure to 25 GPa. Pressure dependent PL spectra of CDs in ethanol as PTM were also measured in the DAC experiment. It showed PL emission blue-shift from 530 nm to 440 nm with increasing pressure from atmospheric pressure to 24 GPa (Fig. S5, ESI†). It is noted that the blue-shift piezochromism is related to protic solvents, such as water and ethanol.
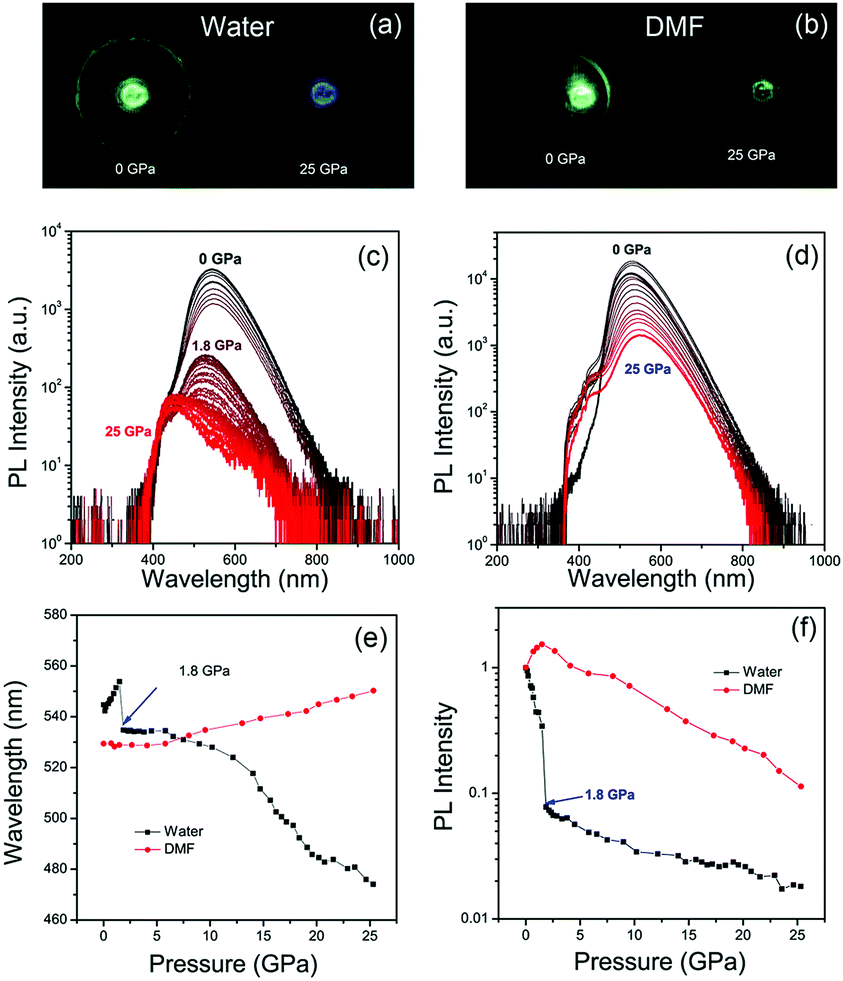 | ||
| Fig. 1 Fluorescent photographs of CDs with (a) water and (b) DMF as PTM under atmospheric pressure and high pressure (25 GPa). PL spectra evolution of CDs in (c) water and (d) DMF with increasing pressure from atmospheric pressure to 25 GPa. (e) PL peak and (f) integrated intensity of CDs with water or DMF vs. pressure. | ||
The pressure dependent absorption spectra measurements of CDs were also carried out to investigate their optical transitions in different PTM solvents (Fig. 2a and b). The main absorption peak of CDs in water experienced red-shift from 410 nm to 420 nm with increasing pressure from atmospheric pressure to 1.8 GPa (Fig. 2c), which agrees with increased π–π stacking under high pressure.27,37,38 However, this main absorption peak is instantly decreased and changed from 420 nm to 440 nm. On further increasing the pressure to 25 GPa, this absorption peak continually decreased and red-shifted to 450 nm, while the absorption peak at 320 nm was significantly increased (Fig. 2d), which was related to the optical transition of blue-shifted emission centers. In contrast, the main absorption peak of CDs in DMF continuously red-shifted from 419 nm to 435 nm with increasing pressure from atmospheric pressure to 25 GPa without immediate change of the absorption band (Fig. 2c). The intensity of the absorption peak of CDs in DMF at 320 nm was slightly increased with increasing pressure to 25 GPa (Fig. 2d), which was because of the small blue emission component under high pressure. Considering the π–π stacking related pressure induced optical changes, it can be inferred that the green emission should be from the π-conjugated domains in the inner cores, which can be the intrinsic state of the CDs. After high pressure relaxation, the PL of CDs in water was partially recovered (Fig. 3a). The residual blue emissive band, about 11% of the total PL band (Fig. S6a, ESI†), indicated chemical reaction happened between some CDs and water molecules under high pressure. In contrast, the PL profile of CDs in DMF was totally recovered after high pressure relaxation (Fig. 3b), indicating that the similar chemical reaction cannot happen between CDs and DMF molecules under 25 GPa. Considering water is a protic solvent and DMF is an aprotic solvent, it can be inferred that the reaction sites should be on the electron withdrawing groups on the surface of CDs, which can bond with hydroxyl group in water molecules or chemically react with water molecules. Thermally treated DAC experiment was used to investigate the acceleration of high temperature on the chemical reactions between CDs and water molecules. Pressure dependent PL spectra of CDs with high temperature (80 °C, 353 K) treatment are shown in Fig. 3c. PL spectra after high pressure relaxation under high temperature shows unrecovered PL spectrum and more residual blue emissive band (77%) (Fig. 3d and Fig. S6b, ESI†). The PL intensity of CDs in water with thermally treated DAC experiment shows a two step quenching process, which is similar to that in water under room temperature. The PL peak of CDs shows obvious blue-shift from 530 nm to 420 nm with increasing pressure from atmospheric pressure to 6 GPa, resulting from the chemical reaction between CDs and water molecules. Then, the PL peak of CDs red-shifted from 420 nm to 440 nm with increasing pressure from 6 GPa to 22 GPa, related to the increased π–π stacking of blue emitted products (Fig. S7, ESI†). These results indicate that the high temperature treatment in DAC experiment accelerates the chemical reaction between CDs and water molecules.
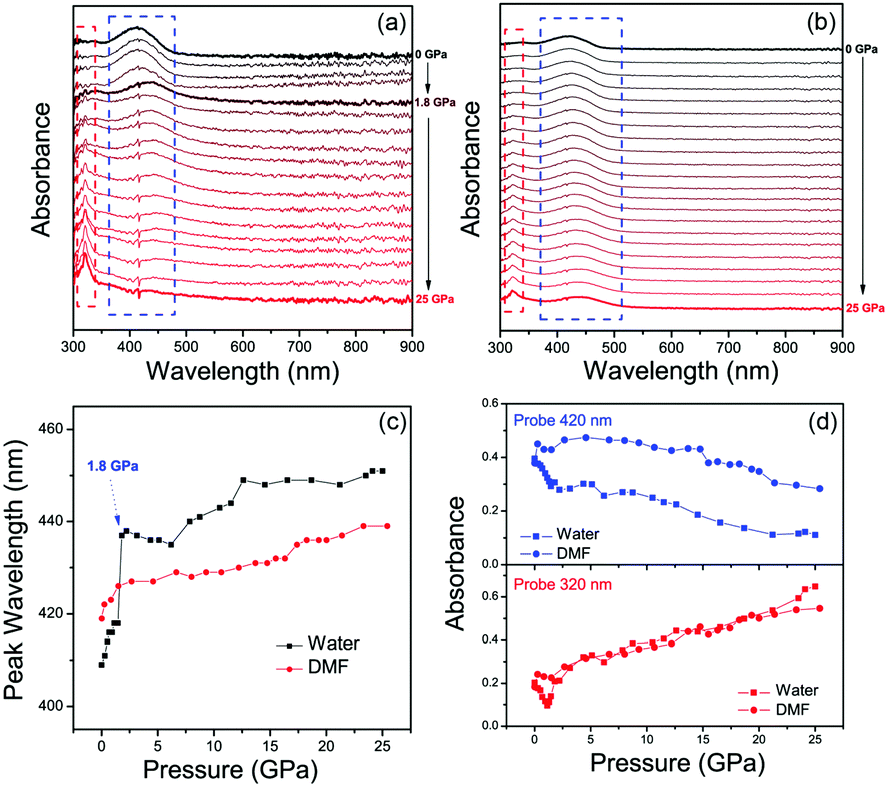 | ||
| Fig. 2 Absorption spectra evolution of CDs in (a) water and (b) DMF with increasing pressure from atmospheric pressure to 25 GPa. (c) Absorption peak wavelength of CDs in water or DMF vs. pressure. (d) Absorbance intensity of CDs at 420 nm (blue) and 320 nm (red) in water or DMF vs. pressure. | ||
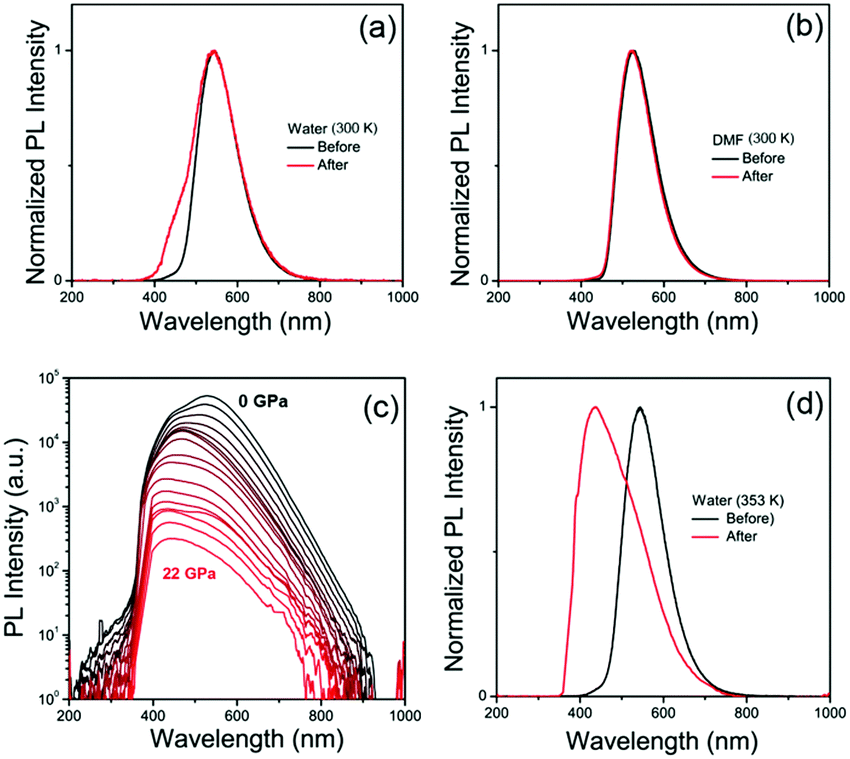 | ||
| Fig. 3 PL spectra before (black) and after (red) high pressure experiment with (a) water and (b) DMF as PTMs at room temperature (300 K). (c) PL spectra evolution of CDs in water under high temperature of 353 K. (d) PL spectra before (black) and after (red) high pressure experiment with water as PTM at high temperature (353 K). | ||
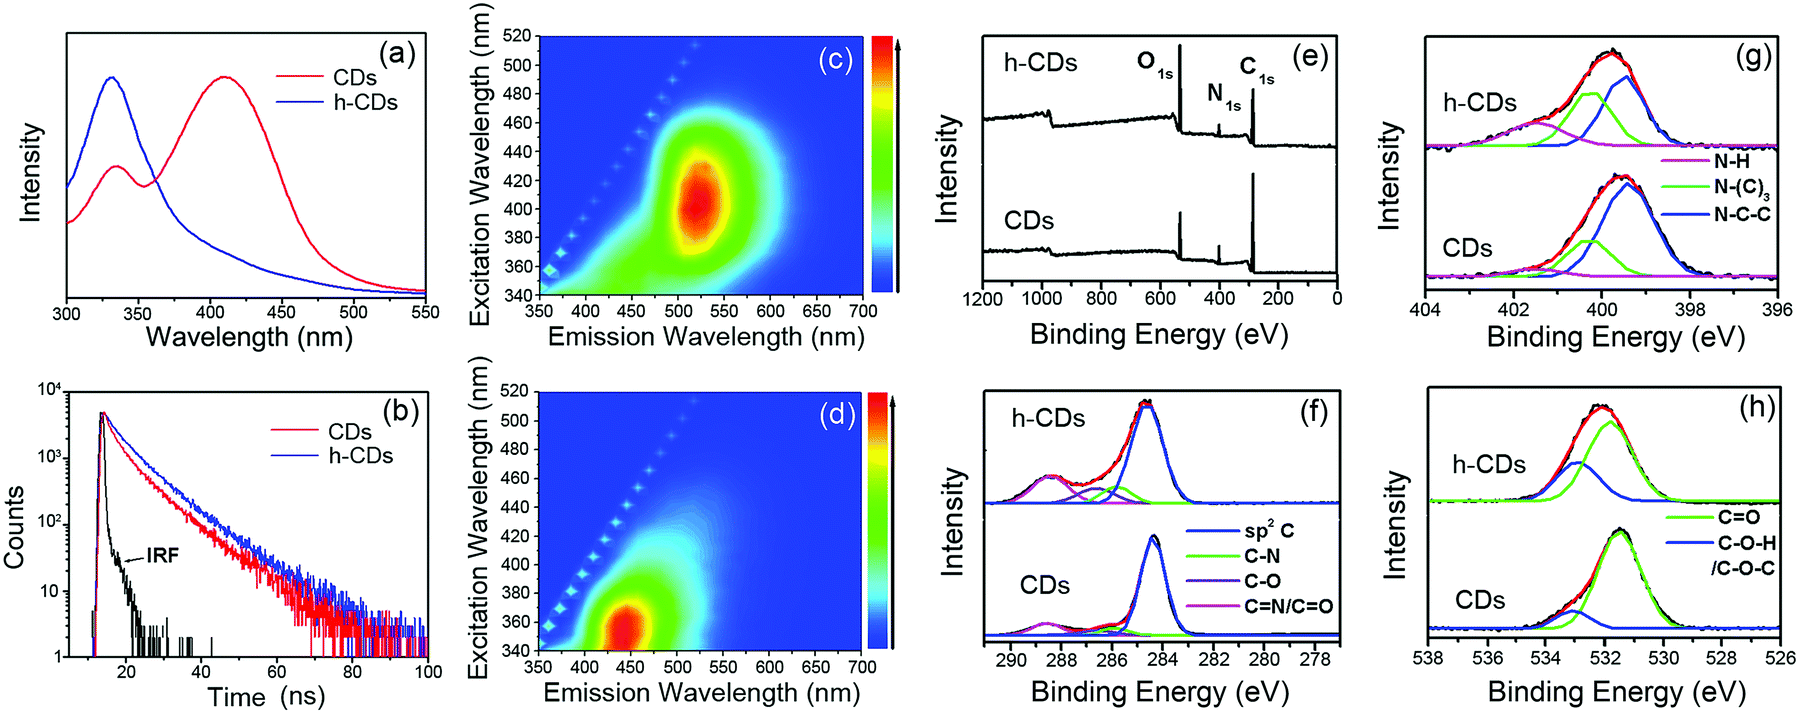
To well understand the chemical reactions between water and CDs under high pressure, the CDs were further processed by hydrothermal treating at 160 °C (433 K) to promote the chemical reaction. The hydrothermally treated CDs were named as h-CDs. In the absorption spectrum of h-CDs in water, the absorption band at 420 nm significantly decreased, while the absorption band at 320 nm significantly increased (Fig. 4a), which is similar to the absorption spectrum of the CDs in water at 25 GPa in DAC experiment. Fig. 4c and d show the 3D fluorescence excitation–emission maps of CDs and h-CDs aqueous solutions. It can be seen that the PL peak changed from green (530 nm) in CDs to blue (450 nm) in h-CDs, which is also consistent with the PL changes of the CDs in water from 0 GPa to 25 GPa. The PL decay curves of CDs and h-CDs are shown in Fig. 4b. The average PL lifetimes of CDs and h-CDs in water are 6.5 ns and 7.8 ns, respectively (Table S1, ESI†). These irreversible optical changes of CDs after high pressure and hydrothermal treatment in water imply that the intrinsic green emission of CDs can be affected by the surface chemical changes.
 | ||
| Fig. 4 (a) Normalized absorption spectra of CDs and h-CDs aqueous solutions. (b) PL decay curves of CDs and h-CDs aqueous solutions. 3D fluorescence excitation–emission map of (c) CDs and (d) h-CDs aqueous solutions. (e) Full survey XPS of CDs and h-CDs in dry state. High-resolution XPS C 1s (f), N 1s (g), and O 1s (h) analyses of CDs and h-CDs in dry state. | ||
X-ray photoelectron spectroscopy (XPS) was performed to identify the surface chemical structures of CDs and h-CDs. XPS spectra of CDs and h-CD show three peaks at 284.0, 400.0, and 530.6 eV in Fig. 4e which are attributed to C 1s, N 1s, and O 1s, respectively.13,16 The ratios of N atoms and C atoms in CDs and h-CDs from XPS results are similar (about 1![[thin space (1/6-em)]](https://www.rsc.org/images/entities/char_2009.gif) :5), but the ratio of O atoms and C atoms in h-CDs is much higher than that in CDs. In high-resolution C 1s spectra of CDs and h-CDs four peaks at 284.5, 285.8, 286.7, and 288.5 eV were observed in Fig. 4f, which are attributed to sp2 C, C–N, C–O, and C
:5), but the ratio of O atoms and C atoms in h-CDs is much higher than that in CDs. In high-resolution C 1s spectra of CDs and h-CDs four peaks at 284.5, 285.8, 286.7, and 288.5 eV were observed in Fig. 4f, which are attributed to sp2 C, C–N, C–O, and C![[double bond, length as m-dash]](https://www.rsc.org/images/entities/char_e001.gif) N/CO, respectively. The relative content of sp2 C was decreased after hydrothermal treatment probably because the water molecules reacted with surface carbon–carbon double bonds. The high-resolution N 1s spectra of CDs and h-CDs showed three peaks at 399.8, 400.3, and 401.9 eV (Fig. 4g), which are attributed to pyridine-like N (C–N–C), quaternary graphite-like N (N–(C)3) and N–H bands, respectively. It can be seen that the content of N–H in h-CDs is higher than that in CDs, whereas the content of pyridine N in h-CD is lower, indicating that some portion of pyridine N in CDs transferred to N–H after hydrothermal treatment. The high-resolution O 1s spectra of CDs and h-CDs show two peaks at 533.0 and 531.5 eV (Fig. 4h), which are attributed to C–OH/C–O–C and CO groups, respectively. It can be seen that the content of C–OH/C–O–C in h-CDs is higher than that in CDs. Based on the XPS results, it can be concluded that h-CDs consist of less sp2 C and more hydroxyl- and N–H groups than CDs, indicating that water molecules react with some carbon–carbon double bonds, carbonyl O and pyridine N on the surfaces of CDs through addition reaction in the hydrothermal process, which could be the reason for the portion of the unrecoverable blue emission of the CDs after high pressure relaxation (25 GPa). Considering the electron withdrawing property of carbonyl and pyridine groups, which can be hydrogen bond acceptor sites, it can be inferred that enhanced hydrogen bonding could take place between water molecules and carbonyl/pyridine groups on the surface of CDs under high static pressure conditions (25 GPa). This hydrogen bonding can be weakened after high pressure relaxation. We propose that the high pressure induced enhanced hydrogen bonding between the electron withdrawing groups and water molecules might account for the recovered blue emission for the CDs under high pressure.
N/CO, respectively. The relative content of sp2 C was decreased after hydrothermal treatment probably because the water molecules reacted with surface carbon–carbon double bonds. The high-resolution N 1s spectra of CDs and h-CDs showed three peaks at 399.8, 400.3, and 401.9 eV (Fig. 4g), which are attributed to pyridine-like N (C–N–C), quaternary graphite-like N (N–(C)3) and N–H bands, respectively. It can be seen that the content of N–H in h-CDs is higher than that in CDs, whereas the content of pyridine N in h-CD is lower, indicating that some portion of pyridine N in CDs transferred to N–H after hydrothermal treatment. The high-resolution O 1s spectra of CDs and h-CDs show two peaks at 533.0 and 531.5 eV (Fig. 4h), which are attributed to C–OH/C–O–C and CO groups, respectively. It can be seen that the content of C–OH/C–O–C in h-CDs is higher than that in CDs. Based on the XPS results, it can be concluded that h-CDs consist of less sp2 C and more hydroxyl- and N–H groups than CDs, indicating that water molecules react with some carbon–carbon double bonds, carbonyl O and pyridine N on the surfaces of CDs through addition reaction in the hydrothermal process, which could be the reason for the portion of the unrecoverable blue emission of the CDs after high pressure relaxation (25 GPa). Considering the electron withdrawing property of carbonyl and pyridine groups, which can be hydrogen bond acceptor sites, it can be inferred that enhanced hydrogen bonding could take place between water molecules and carbonyl/pyridine groups on the surface of CDs under high static pressure conditions (25 GPa). This hydrogen bonding can be weakened after high pressure relaxation. We propose that the high pressure induced enhanced hydrogen bonding between the electron withdrawing groups and water molecules might account for the recovered blue emission for the CDs under high pressure.
To demonstrate our hypothesis, first-principles calculations based on the density functional theory (DFT) were carried out. For XPS analysis, the proposed simplified model is a monolayer graphene plate consisting of 19 aromatic rings with two (–N–(CO)–N–) fragments at the edge of the graphene plate. In Fig. 5a, two water molecules were put close to the carbonyl groups of the model to simulate the optical band-gap of the CDs for enhanced hydrogen bonding with water molecules under high pressure (Status 1). After structure relaxation, the distance between the water molecules and graphene plate is increased, simulating the optical band-gap of the CDs in water under atmospheric pressure (Status 2). The lowest unoccupied molecular orbital (LUMO) levels of the model in Status 1 and 2 are similar, indicating that the delocalized π* orbital of graphene-like structure is insensitive to the surface chemical environment. The highest occupied molecular orbital (HOMO) of the model in Status 1 also delocalize in whole graphene-like domain, while the HOMO of the model in Status 2 is distributed around carbonyl groups. It can be inferred that enhanced hydrogen bonding in Status 1 can weaken the electron withdrawing property of the carbonyl groups on the edge of the model. Under high pressure or hydrothermal treatment, some CO groups react with water molecules and change to C–OH groups, inducing the unrecoverable change of PL spectra. In Fig. 5b, the band-gap of the model increases from 1.27 eV (Status 2) to 1.39 eV (Status 1). The band-gap of the model with one water molecule was also calculated and showed the same trend before and after structural relaxation (Fig. S8, ESI†). The simulated increased band-gap can be used to explain the blue-shift piezochromism of CDs in water under high pressure from 1.8 GPa to 25 GPa. Thus, it can be inferred that the surface chemical structural changes can affect the intrinsic emission of CDs.
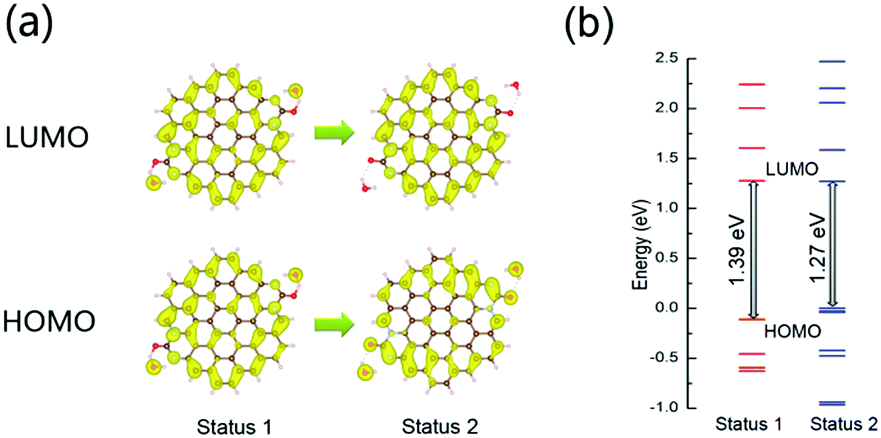 | ||
| Fig. 5 (a) Calculated structures of CD's model with two water molecules before (Status 1) and after (Status 2) structure relaxation. The charge distributions of LUMO and HOMO. The colored isosurface of charge density is 0.001 eV Å−3. (b) Energy levels of CD's model with two water molecules before (Status 1) and after (Status 2) structure relaxation. | ||
Conclusions
We report solvent dependent piezochromism of CDs by the DAC experiment with in situ optical measurements. The results reveal that the red- and blue-shift piezochromism of CDs originate from increased π–π stacking and protic-solvent-induced surface chemical structural changes under high pressure, respectively. Based on theoretical modeling and structural analysis of h-CDs, the high pressure induced reversible and irreversible blue-shift piezochromism from green emission to blue emission with water as PTM was attributed to pressure induced enhanced intermolecular hydrogen bonding and addition reaction between water molecules and surface electron withdrawing groups, respectively. The decreased electron withdrawing ability of the surface chemical structures of CDs further affect the optical transitions between π-electron systems of graphene-like domain in CDs, namely their intrinsic luminescence. The long standing debate on luminescence origination from CDs might make a consensus to be surface related intrinsic luminescence. We anticipate that this work will benefit the fundamental understanding of the luminescence origination from CDs and tuning their intrinsic luminescence to promote their applications in different fields.Conflicts of interest
There are no conflicts to declare.Acknowledgements
This work was supported by the National Natural Science Foundation of China (Grant No. 21725304, 61274126, 61306081, 11774125, 51602304 and 11504368), Outstanding Young Scientists Program of Chinese Academy of Sciences, Jilin Province Science and Technology Projects (No. 20160520008JH, 20150519003JH, 20140101060JC, 20170101191JC, 20170101042JC).Notes and references
- L. Cao, X. Wang, M. J. Meziani, F. Lu, H. Wang, P. G. Luo, Y. Lin, B. A. Harruff, L. M. Veca, D. Murray, S. Y. Xie and Y. P. Sun, Carbon Dots for Multiphoton Bioimaging, J. Am. Chem. Soc., 2007, 129(37), 11318–11319 CrossRef CAS PubMed.
- S. Zhu, J. Zhang, S. Tang, C. Qiao, L. Wang, H. Wang, X. Liu, B. Li, Y. Li, W. Yu, X. Wang, H. Sun and B. Yang, Surface Chemistry Routes to Modulate the Photoluminescence of Graphene Quantum Dots: From Fluorescence Mechanism to Up-Conversion Bioimaging Applications, Adv. Funct. Mater., 2012, 22(22), 4732–4740 CrossRef CAS.
- S. T. Yang, L. Cao, P. G. Luo, F. Lu, X. Wang, H. Wang, M. J. Meziani, Y. Liu, G. Qi and Y. P. Sun, Carbon Dots for Optical Imaging in Vivo, J. Am. Chem. Soc., 2009, 131(32), 11308–11309 CrossRef CAS PubMed.
- D. Li, P. Jing, L. Sun, Y. An, X. Shan, X. Lu, D. Zhou, D. Han, D. Shen, Y. Zhai, S. Qu, R. Zbořil and A. L. Rogach, Near-Infrared Excitation/Emission and Multiphoton-Induced Fluorescence of Carbon Dots, Adv. Mater., 2018, 30(13), 1705913 CrossRef PubMed.
- A. M. Chizhik, S. Stein, M. O. Dekaliuk, C. Battle, W. Li, A. Huss, M. Platen, I. A. T. Schaap, I. Gregor, A. P. Demchenko, C. F. Schmidt, J. Enderlein and A. I. Chizhik, Super-Resolution Optical Fluctuation Bio-Imaging with Dual-Color Carbon Nanodots, Nano Lett., 2016, 16(1), 237–242 CrossRef CAS PubMed.
- X. Zhang, Y. Zhang, Y. Wang, S. Kalytchuk, S. V. Kershaw, Y. Wang, P. Wang, T. Zhang, Y. Zhao, H. Zhang, T. Cui, Y. Wang, J. Zhao, W. W. Yu and A. L. Rogach, Color-Switchable Electroluminescence of Carbon Dot Light-Emitting Diodes, ACS Nano, 2013, 7(12), 11234–11241 CrossRef CAS PubMed.
- W. Kwon, Y. H. Kim, C. L. Lee, M. Lee, H. C. Choi, T. W. Lee and S. W. Rhee, Electroluminescence from Graphene Quantum Dots Prepared by Amidative Cutting of Tattered Graphite, Nano Lett., 2014, 14(3), 1306–1311 CrossRef CAS PubMed.
- F. Yuan, T. Yuan, L. Sui, Z. Wang, Z. Xi, Y. Li, X. Li, L. Fan, Z. Tan, A. Chen, M. Jin and S. Yang, Engineering triangular carbon quantum dots with unprecedented narrow bandwidth emission for multicolored LEDs, Nat. Commun., 2018, 9, 2249 CrossRef PubMed.
- S. Qu, X. Liu, X. Guo, M. Chu, L. Zhang and D. Shen, Amplified Spontaneous Green Emission and Lasing Emission From Carbon Nanoparticles, Adv. Funct. Mater., 2014, 24(18), 2689–2695 CrossRef CAS.
- V. Georgakilas, J. A. Perman, J. Tucek and R. Zboril, Broad Family of Carbon Nanoallotropes: Classification, Chemistry, and Applications of Fullerenes, Carbon Dots, Nanotubes, Graphene, Nanodiamonds, and Combined Superstructures, Chem. Rev., 2015, 115(11), 4744–4822 CrossRef CAS PubMed.
- Y. P. Sun, B. Zhou, Y. Lin, W. Wang, K. A. S. Fernando, P. Pathak, M. J. Meziani, B. A. Harruff, X. Wang, H. F. Wang, P. J. G. Luo, H. Yang, M. E. Kose, B. Chen, L. M. Veca and S. Y. Xie, Quantum-Sized Carbon Dots for Bright and Colorful Photoluminescence, J. Am. Chem. Soc., 2006, 128(24), 7756–7757 CrossRef CAS PubMed.
- S. N. Baker and G. A. Baker, Luminescent Carbon Nanodots: Emergent Nanolights, Angew. Chem., Int. Ed., 2010, 49(38), 6726–6744 CrossRef CAS PubMed.
- S. Qu, X. Wang, Q. Lu, X. Liu and L. A. Wang, Biocompatible Fluorescent Ink Based on Water-Soluble Luminescent Carbon Nanodots, Angew. Chem., Int. Ed., 2012, 51(49), 12215–12218 CrossRef CAS PubMed.
- K. Hola, Y. Zhang, Y. Wang, E. P. Giannelis, R. Zboril and A. L. Rogach, Carbon dots-emerging light emitters for bioimaging, cancer therapy and optoelectronics, Nano Today, 2014, 9(5), 590–603 CrossRef CAS.
- V. Strauss, J. T. Margraf, K. Dirian, Z. Syrgiannis, M. Prato, C. Wessendorf, A. Hirsch, T. Clark and D. M. Guldi, Carbon Nanodots: Supramolecular Electron Donor–Acceptor Hybrids Featuring Perylenediimides, Angew. Chem., Int. Ed., 2015, 54, 8292–8297 CrossRef CAS PubMed.
- D. Qu, M. Zheng, J. Li, Z. G. Xie and Z. C. Sun, Tailoring color emissions from N-doped graphene quantum dots for bioimaging applications, Light: Sci. Appl., 2015, 4(28), e364 CrossRef CAS.
- D. Qu, Z. C. Sun, M. Zheng, J. Li, Y. Q. Zhang, G. Q. Zhang, H. F. Zhao, X. Y. Liu and Z. G. Xie, Three Colors Emission from S,N Co-doped Graphene Quantum Dots for Visible Light H2 Production and Bioimaging, Adv. Opt. Mater., 2015, 3(3), 360–367 CrossRef CAS.
- F. Arcudi, L. Đorđević and M. Prato, Synthesis, Separation, and Characterization of Small and Highly Fluorescent Nitrogen-Doped Carbon NanoDots, Angew. Chem., Int. Ed., 2016, 55(6), 2107–2112 CrossRef CAS PubMed.
- X. M. Wen, P. Yu, Y. R. Toh, X. T. Hao and J. Tang, Intrinsic and Extrinsic Fluorescence in Carbon Nanodots: Ultrafast Time-Resolved Fluorescence and Carrier Dynamics, Adv. Opt. Mater., 2013, 1(2), 173–178 CrossRef.
- L. Wang, S. J. Zhu, H. Y. Wang, Y. F. Wang, Y. W. Hao, J. H. Zhang, Q. D. Chen, Y. L. Zhang, W. Han, B. Yang and H. B. Sun, Unraveling Bright Molecule-Like State and Dark Intrinsic State in Green-Fluorescence Graphene Quantum Dots via Ultrafast Spectroscopy, Adv. Opt. Mater., 2013, 1(3), 264–271 CrossRef.
- L. Wang, S. J. Zhu, H. Y. Wang, S. Qu, Y. L. Zhang, J. H. Zhang, Q. D. Chen, H. Xu, W. Han, B. Yang and H. B. Sun, Common Origin of Green Luminescence in Carbon Nanodots and Graphene Quantum Dots, ACS Nano, 2014, 8(3), 2541–2547 CrossRef CAS PubMed.
- L. Xiao and H. Sun, Novel properties and applications of carbon nanodots, Nanoscale Horiz., 2018 10.1039/c8nh00106e.
- L. Xiao, Y. Wang, Y. Huang, T. Wong and H. Sun, Self-trapped exciton emission from carbon dots investigated by polarization anisotropy of photoluminescence and photoexcitation, Nanoscale, 2017, 9(34), 12637–12646 RSC.
- R. B. Aust and H. G. Drickamer, Carbon: A New Crystalline Phase, Science, 1963, 140(356), 817–819 CrossRef CAS PubMed.
- F. P. Bundy and J. S. Kasper, Hexagonal Diamond-A New Form of Carbon, J. Chem. Phys., 1967, 46(9), 3437–3446 CrossRef CAS.
- S. Lu, G. Xiao, L. Sui, T. Feng, X. Yong, S. Zhu, B. Li, Z. Liu, B. Zou, M. Jin, J. S. Tse, H. Yan and B. Yang, Piezochromic Carbon Dots with Two-photon Fluorescence, Angew. Chem., Int. Ed., 2017, 56(22), 6187–6191 CrossRef CAS PubMed.
- C. Liu, G. Xiao, M. Yang, B. Zou, Z. L. Zhang and D. W. Pang, Mechanofluorochromic Carbon Nanodots: Controllable Pressure-Triggered Blue- and Red-Shifted Photoluminescence, Angew. Chem., Int. Ed., 2018, 57(7), 1893–1897 CrossRef CAS PubMed.
- H. Wang, C. Sun, X. Chen, Y. Zhang, V. L. Colvin, Q. Rice, J. Seo, S. Feng, S. Wang and W. Y. William, Excitation wavelength independent visible color emission of carbon dots, Nanoscale, 2017, 9(5), 1909–1915 RSC.
- T. X. Zhang, J. Y. Zhu, Y. Zhai, H. Wang, X. Bai, B. Dong, H. Y. Wang and H. W. Song, A novel mechanism for red emission carbon dots: hydrogen bond dominated molecular states emission, Nanoscale, 2017, 9(35), 13042–13051 RSC.
- S. Ghosh, A. M. Chizhik, N. Karedla, M. O. Dekaliuk, I. Gregor, H. Schuhmann, M. Seibt, K. Bodensiek, I. A. T. Schaap, O. Schulz, A. P. Demchenko, J. Enderlein and A. I. Chizhik, Photoluminescence of Carbon Nanodots: Dipole Emission Centers and Electron–Phonon Coupling, Nano Lett., 2014, 14(10), 5656–5661 CrossRef CAS PubMed.
- P. Jing, D. Han, D. Li, D. Zhou, L. Zhang, H. Zhang, D. Shen and S. Qu, Origin of Anisotropic Photoluminescence in Heteroatom-Doped Carbon Nanodots, Adv. Opt. Mater., 2017, 5(8), 1601049 CrossRef.
- A. Sciortino, E. Marino, B. van Dam, P. Schall, M. Cannas and F. Messina, Solvatochromism Unravels the Emission Mechanism of Carbon Nanodots, J. Phys. Chem. Lett., 2016, 7, 3419–3423 CrossRef CAS PubMed.
- S. Liu, J. Tian, L. Wang, Y. Zhang, X. Qin, Y. Luo, A. M. Asiri, A. O. Al-Youbi and X. Sun, Hydrothermal Treatment of Grass: A Low-Cost, Green Route to Nitrogen-Doped, Carbon-Rich, Photoluminescent Polymer Nanodots as an Effective Fluorescent Sensing Platform for Label-Free Detection of Cu(II) Ions, Adv. Mater., 2012, 24(17), 2037–2041 CrossRef CAS PubMed.
- H. T. Yu, W. J. Colucci, M. L. McLaughlin and M. D. Barkley, Fluorescence quenching in indoles by excited-state proton transfer, J. Am. Chem. Soc., 1992, 114(22), 8449–8454 CrossRef CAS.
- G. J. Zhao and K. L. Han, Hydrogen Bonding in the Electronic Excited State, Acc. Chem. Res., 2012, 45(3), 404–413 CrossRef CAS PubMed.
- A. N. Dunaeva, D. V. Antsyshkin and O. L. Kuskov, Phase Diagram of H2O: Thermodynamic Functions of the Phase Transitions of High Pressure Ices, Sol. Syst. Res., 2010, 44(3), 202–222 CrossRef CAS.
- J. Wu, H. Wang, S. Xu and W. Xu, Comparison of Shearing Force and Hydrostatic Pressure on Molecular Structures of Triphenylamine by Fluorescence and Raman Spectroscopies, J. Phys. Chem. A, 2015, 119(8), 1303–1308 CrossRef CAS PubMed.
- D. X. Lu, Y. H. Wang, F. F. Li, X. L. Huang, L. Y. Pan, Y. B. Gong, B. Han, Q. Zhou and T. Cui, Pressure-Dependent Relaxation Dynamics of Excitons in Conjugated Polymer Film, J. Phys. Chem. C, 2015, 119(23), 13194–13199 CrossRef CAS.
Footnotes |
| † Electronic supplementary information (ESI) available. See DOI: 10.1039/c8nh00258d |
| ‡ P. Jing, and D. Han contributed equally to this work. |
| This journal is © The Royal Society of Chemistry 2019 |