
 Open Access Article
 This Open Access Article is licensed under a Creative Commons Attribution-Non Commercial 3.0 Unported Licence
Fluorine-enriched mesoporous carbon as efficient oxygen reduction catalyst: understanding the defects in porous matrix and fuel cell applications
V.
Parthiban
 ab,
Balasubramaniam
Bhuvaneshwari
c,
J.
Karthikeyan
d,
P.
Murugan
d and
A. K.
Sahu
*ab
ab,
Balasubramaniam
Bhuvaneshwari
c,
J.
Karthikeyan
d,
P.
Murugan
d and
A. K.
Sahu
*ab
aCSIR – Central Electrochemical Research Institute-Madras Unit, CSIR Madras Complex, Taramani, Chennai 600113, India. E-mail: aksahu@cecri.res.in; akhilakumar2008@gmail.com; Fax: +91-44-22542456; Tel: +91-44-22544554
bAcademy of Scientific and Innovative Research (AcSIR), CSIR – Central Electrochemical Research Institute, Karaikudi 630003, India
cDepartment of Chemical Engineering, Indian Institute of Technology, Kanpur, Uttar Pradesh 208016, India
dCSIR – Central Electrochemical Research Institute, Functional Materials Division, Karaikudi 630 003, India
First published on 20th November 2019
Abstract
Herein, fluorine enrichment in mesoporous carbon (F-MC) was explored to introduce maximum charge polarization in the porous matrix, which is beneficial for the preferential orientation of O2 molecules and their subsequent reduction. Ex situ doping of F to porous carbon derived from phloroglucinol–formaldehyde resin using Pluronic F-127 as a structure-directing agent is standardized. The optimized F-MC catalyst exhibited excellent electrocatalytic activity towards the oxygen reduction reaction (ORR) in alkaline media (0.1 M KOH) with an onset potential of −0.10 V vs. SCE and diffusion-limiting current of 4.87 mA cm−2, while displaying only about 50 mV overpotential in the half-wave region compared to Pt–C (40 wt%). In the stability test, the catalyst showed only 10 mV negative shift in its half-wave potential after 10![[thin space (1/6-em)]](https://www.rsc.org/images/entities/char_2009.gif) 000 potential cycles. The rotating ring disk electrode (RRDE) experiments revealed that F-MC follows the most preferable 4e− pathway (n = 3.61) with a moderate peroxide (HO2−) yield. This was further supported by density functional theory calculations and also deeply explains the existence of defects being beneficial for the ORR. The F-MC catalyst owing to its promising ORR activity and long-term electrochemical stability can be viewed as a potential alternative ORR catalyst for anion exchange membrane fuel cell applications.
000 potential cycles. The rotating ring disk electrode (RRDE) experiments revealed that F-MC follows the most preferable 4e− pathway (n = 3.61) with a moderate peroxide (HO2−) yield. This was further supported by density functional theory calculations and also deeply explains the existence of defects being beneficial for the ORR. The F-MC catalyst owing to its promising ORR activity and long-term electrochemical stability can be viewed as a potential alternative ORR catalyst for anion exchange membrane fuel cell applications.
Introduction
Electrochemical conversion devices such as fuel cells (FC) have gained much attention as alternative energy sources for portable and stationary applications owing to their high energy conversion efficiency, fast start-up, low-temperature operations, and low pollutant emissions.1–3 Although extensive research has been focused on the development of improved fuel cell-active materials, including polymer electrolyte membranes (PEMs) and electrocatalyst materials, the oxygen reduction reaction (ORR) due to its sluggish kinetics remains the bottleneck to achieving maximum efficiency and commercialization of FC.4–6 Presently, platinum (Pt) and platinum-based alloy catalysts owing to their low overpotential and high exchange current density are widely used to facilitate the ORR kinetics.7–9 However, the high cost (use of Pt-based catalysts accounts for nearly 50% of overall fuel cell cost) and scarcity of Pt limit the use of Pt-based catalysts in FCs. Besides, Pt-based catalysts generally suffer from poor electrochemical stability in the presence of CO and methanol. Thus, extensive research has been devoted to developing alternative and cost-effective ORR cathode catalysts with superior electrochemical stability and tolerance to CO and methanol.10–12In anion exchange membrane fuel cells (AEMFCs), in alkaline medium, the considerable reduction in the oxygen reduction overpotential allows the use of non-precious metal-based or non-metal catalysts.13–15 Heteroatom-doped (N, S, P, B, F, etc.) carbon materials such as graphene, carbon nanotubes, graphite nanofibres, and porous carbons have attracted great attention as cathode catalysts for the ORR in alkaline media owing to their long-term stability, tolerance to methanol and easy synthesis.16–24 The ORR activity of heteroatom-doped carbon materials arises from the difference in electronegativity and atomic size between heteroatoms and carbon, which induces positive/negative charges on the adjacent carbon with increased surface defects.25,26 The enhancement in ORR activity is also due to the disturbance in charge and spin density distribution on the carbon matrix as a consequence of heteroatom doping, as revealed by several theoretical studies.27–30 However, the precise origin of ORR activity in heteroatom-doped catalysts is still unclear and needs deeper investigation with respect to the carbon morphology while interacting with heteroatoms to develop suitable ORR catalysts.
Among the various hetero atoms, F has the highest electronegativity (χF = 3.98) and tends to polarize adjacent carbon atoms to a greater extent. Sun et al. first demonstrated enhanced ORR kinetics by employing F-doped carbon black (CB-F) as a catalyst.31 The CB-F catalyst applied to the AEMFC delivered a maximum power density of ∼15 mW cm−2 at 60 °C, which is almost 40% higher than that of the Pt–C catalyst. Panomsuwan et al. synthesized F-doped carbon nanoparticles (FCNPs) via a single-step plasma process and studied their ORR activity.32 The optimized FCNP catalyst showed an ORR onset potential of −0.22 V vs. Ag/AgCl with a limiting current density of 2.76 mA cm−2 at −0.6 V vs. Ag/AgCl. The excellent electrocatalytic performance is primarily attributed to the formation of semi-ionic C–F bonds and the creation of a positive charge on the carbon atom due to the electronegativity difference between fluorine (3.98) and carbon (2.55).
Porous carbon owing to its unique pore structure and high specific surface area has attracted much attention for the development of heteroatom-doped catalysts. Yu et al. prepared N-doped porous carbon nanosheets (N-PCN) from coal tar pitch and the N-PCN catalyst exhibited excellent ORR activity (E1/2 = 0.85 V vs. RHE) with better stability and methanol tolerance compared to Pt–C (20 wt%) (E1/2 = 0.83 V vs. RHE).33 Jiang et al. studied the effect of N and P co-doping on a porous carbon network (PCN) derived from carbon quantum dots (CQD) towards ORR kinetics.34 The optimized catalyst heat-treated at 900 °C (NPCN-900) displayed an onset potential of 0.92 V and 0.74 V (vs. RHE) in alkaline and acidic media, which are close to that of the 20 wt% Pt/C catalyst (0.93 V and 0.80 V), respectively. The excellent ORR activity of porous carbon-derived electrocatalysts is exclusively credited to the presence of both meso- and micropores in the carbon matrix, which reduce the mass transport by facilitating the transport of oxygen and electrolyte. Besides, the highly porous carbon matrix provides more active sites with edge defects, which result in superior electrocatalytic activity.35–37
The present study deals with the doping of the highest electronegative hetero element F in porous carbon synthesized via a soft template route using a tri-block copolymer (Pluronic F-127). The BET specific surface area and pore diameter of MC increased after F doping, suggesting the creation of defects in the MC matrix after the successful incorporation of the F atom. The atomic structure distortion/reorientation of the F-doped MC and its advantages towards the ORR and catalytic activity were fundamentally understood by first-principle density functional theory (DFT) calculations. The theoretical calculations revealed that the O2 reduction on the F-doped graphitic network prefers the four-election pathway, rather than the two-electron path. The F-MC catalyst was evaluated using various electrochemical techniques for its ORR activity and it was found that the optimized F-MC catalyst demonstrated quite competent ORR catalytic activity (Eonset = −0.10 and E1/2 = −0.22 V vs. SCE) with excellent electrochemical stability, even after 10000 repeated potential cycling and high methanol tolerance in alkaline media.
Experimental
Materials
Phloroglucinol, ammonium fluoride (NH4F) and Pluronic F-127 were procured from Acros Organics, India. Gas diffusion layers (GDL, Sigracet DC-35, Germany) were used as electrodes. The Pt/C catalyst (40 wt% Pt supported on Vulcan carbon) was obtained from Johnson-Matthey, UK and was used as a catalyst layer over the GDL surface. Ethanol, formaldehyde (37–41%) and hydrochloric acid (HCl) were purchased from Merck, Germany. Nafion (5 wt%) ionomer was obtained from Du Pont, USA. Fumion-FAA-3 (10 wt%) ionomer solution (polyaromatic backbone with terminal quaternary ammonium ions and bromide counter ions) was procured from Fumatech, Germany. All the chemicals employed in this work were analytical grade and used without any further decontamination process. Milli-Q water (resistivity is 18.2 mΩ cm) was utilized throughout the experiments.Synthesis of mesoporous carbon (MC) and F doping
Mesoporous carbon (MC) was synthesized via a sol–gel route using a triblock co-polymer, namely Pluronic F-127, as a structure-directing agent similar to the process described elsewhere.38 In brief, 1:1 (w/w) ratio of phloroglucinol and Pluronic F-127 were dissolved in a 10:9 (w/w) ratio of ethanol and water mixture under magnetic stirring at room temperature. To this admixture, 0.2 g HCl was added to catalyze the polymerization reaction. The solution was stirred at room temperature until a light pink colour appeared. Subsequently, 2.6 g of formaldehyde was added to the above solution and the stirring process continued. With the polymerization reaction, the solution separated into two layers after 30 min. The upper layer mainly consisted of the water and ethanol mixture, while the lower layer was a clear polymer solution. Upon further stirring, an elastic but non-sticky monolith was formed, which was cured at 100 °C overnight. To obtain MC, the dried monolith was ground to a fine powder and pyrolyzed at 850 °C for 2 h with a heating ramp of 1 °C min−1 up to 400 °C and 5 °C min−1 up to 850 °C under a flowing nitrogen (N2) atmosphere.
For F doping, the required quantity of ammonium fluoride was mixed with MC and the mixture pyrolyzed at different temperatures between 850 °C and 1050 °C for 2 h under an N2 inert atmosphere. Typically, 100 mg of MC and 500 mg of NH4F were mixed at 850 °C for 2 h with a heating ramp of 5 °C min−1 to obtain the F-MC (5:1)-850 catalysts. To optimize the F content, the NH4F and MC wt ratio was varied during the synthesis of the catalysts and labelled as F-MC (2.5:1)-850 and F-MC (7.5:1)-850. The composition optimization was performed at 850 °C and a catalyst yield of about 80 mg was obtained. After optimizing the content of NH4F, the effect of pyrolyzing temperature on F-doping was studied. The optimized F-MC (5:1) was pyrolyzed at 950 °C and 1050 °C and the catalysts were labelled as F-MC (5:1)-950, and F-MC (5:1)-1050, respectively.
Physical characterizations
Powder X-ray patterns were obtained on a BRUKER D8 Advance diffractometer with Cu-Kα as the X-ray source (λ = 1.54 Å) to analyze the phase change of the catalysts prepared at different pyrolysis temperatures. The formation of defects on MC upon fluorine doping was studied by Raman spectroscopy (RFS27, Bruker) employing an Nd:YAG laser of wavelength 1064 nm. The morphology of the MC and F-MC samples was observed by transmission electron microscopy (TEM, Tecnai-20 G2 instrument operated at 200 kV). The elemental composition of the samples was mapped by field-emission scanning electron microscopy (FE-SEM, MIRA3, TESCAN) and energy-dispersive X-ray spectroscopy (EDS). Information on the elemental composition and electronic states was obtained via X-ray photoelectron spectroscopy (XPS) surface analysis using a MULTILAB 2000 XPS system. The Brunauer–Emmett–Teller (BET) specific surface area and pore volumes were determined by N2 adsorption and desorption isotherms at 77 K using an Autosorb iQ-MP, Quantachrome. Pore size distribution (PSD) curves were obtained using the Barrett–Joyner–Halenda (BJH) method and the position of the maximum of the PSD was used as the average pore diameter.Electrochemical characterization
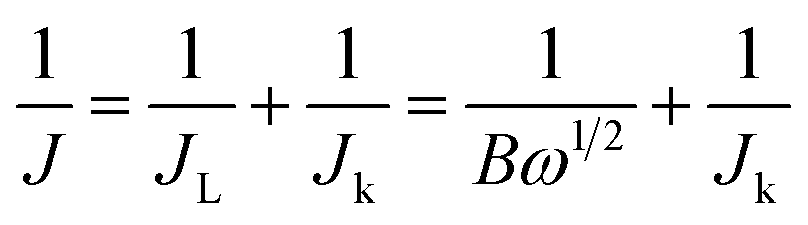
Electrochemical measurements on all the catalysts were carried out in a typical three-electrode electrochemical cell at ∼25 °C using a glassy carbon (GC) disk with a geometric area of 0.071 cm2 as the working electrode, saturated calomel electrode (SCE) as the reference electrode, and a platinum wire as the counter electrode. Before use, the GC electrode was polished with 0.3 μm alumina powder and washed with ultrapure water followed by sonication in ethanol to obtain a dirt-free surface. The catalyst ink was prepared by dispersing 3.62 mg of the prepared catalyst with 10 μL of 5 wt% Nafion ionomer and 490 μL of water-ethanol mixture. 7.5 μL of catalyst ink was pipetted out from the stock solution and dropped on the GC surface and allowed to air dry to obtain the working electrode. The catalyst loading was calculated and found to be ∼750 μg cm−2 and was maintained for all F-MC samples except for Pt–C (40 μg cm−2).The ORR activity, stability, and methanol tolerance of the catalyst in comparison with commercial Pt/C (40 wt%) were evaluated in 0.1 M KOH electrolyte using an electrochemical workstation (Autolab PGSTAT 30, Metrohm). Cyclic voltammetry (CV) measurements were performed in both an N2 and O2 atmosphere to assess the ORR activity of the catalyst by cycling the potential from 0.2 to −1.0 V vs. SCE at a scan rate of 50 mV s−1. The kinetics of the ORR was studied via the linear sweep voltammetry (LSV) technique using a rotating disk electrode (RDE) and Autolab rotation-controlled system by sweeping the potential from −0.2 to −1.0 V vs. SCE at a scan rate of 5 mV s−1 with different rotation speeds ranging from 400 to 2800 rpm. From the LSV results, the electron transfer number (n) was calculated from the slope of the Koutecky–Levich (K–L) plots according to the K–L equations:19
 | (1) |
| Jk = nFkC0 | (2) |
| B = 0.62nFC0D2/30υ−1/6 | (3) |
485 C mol−1). C0 (1.2 × 10⁻⁶ mol cm−3) and D0 (1.9 × 10⁻⁵ cm2 s−1) are the bulk solubility and diffusion coefficient of O2, respectively, υ (0.01 cm2 s−1) is the kinematic viscosity of the 0.1 M KOH, and k is the electron transfer rate constant.
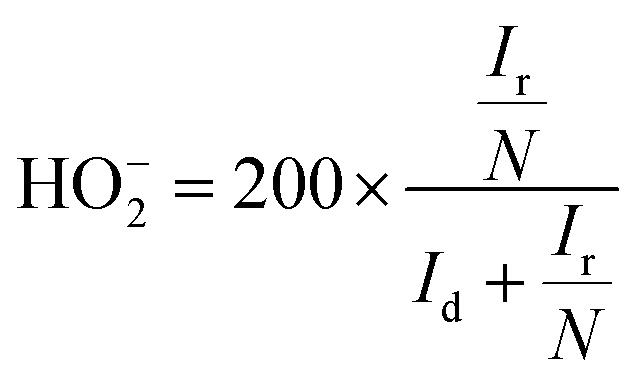
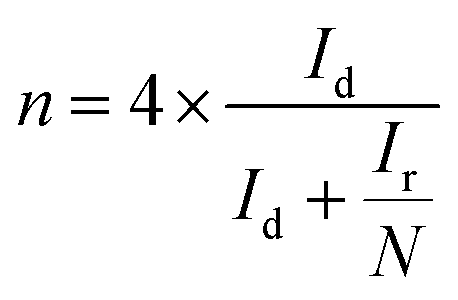
Rotating ring-disk electrode (RRDE) analysis was employed to quantify the HO2− evolution during the ORR and to precisely calculate the number of electrons transferred (n) per oxygen molecule in 0.1 M KOH at 1600 rpm with a scan rate of 5 mV s−1. The RRDE electrode with a geometric area of 0.196 cm2 with a platinum ring was used. The evolved peroxide during the ORR was reduced at the platinum ring with the collection efficiency of 25.5% at 0.5 V vs. SCE. The percentage of peroxide and number of electrons were calculated using the following equations:
 | (4) |
 | (5) |
Computational methods
We used first-principles density functional calculations to understand the oxygen reduction process in the F-doped graphitic carbon network. We used a 4 × 4 supercell of a single layer of graphene, which mimicked the properties of the synthesized catalyst. The calculations were performed using the Vienna Ab initio Simulation Package,39,40 in which atoms were described using projector augmented wave pseudopotentials41 and the electron–electron correlation was corrected using generalized gradient approximations within the PW91 functionals.42 For the optimization processes, we used a denser 5 × 5 × 1 Gamma-centered k-mesh to sample the Brillouin zone. All atoms were relaxed in all three directions without consideration of any symmetry. The lattice parameters in the x and y axes were also relaxed until the forces on all the atoms were reduced to 0.01 eV Å−1.Membrane electrode assemble (MEA) fabrication and fuel cell performance evaluation
For the anode electrodes, the commercial Pt/C (40 wt%) and 10 wt% Fumion FAA-3 ionomer were dispersed in ethanol and applied on commercial GDL to achieve a catalyst loading of 0.5 mg cm−2. To constitute the cathode electrode, the F-MC (5:1)-950 catalyst and 10 wt% Fumion FAA-3 ionomer were ultrasonically dispersed in ethanol and brush-coated on commercial GDL to achieve a catalyst loading of 1.5 mg cm−2. Both electrodes were immersed in 1 M KOH to exchange the Br− ions with OH−. A commercial anion exchange membrane (AEM) membrane with 50 μm thickness (Fumapem membrane from FumaTech) was used. The membrane was pre-treated with 2 M aqueous KOH at room temperature overnight to replace the existing Cl− in the membrane with OH−. The MEA was obtained by sandwiching the AEM membrane between the anode and the cathode electrodes under 20 bars at RT.
To assess the fuel cell performance, the MEA was assembled in a commercial single-cell fixture (Fuel Cell Technologies Inc. USA) with an active area of 4 cm2. The oxygen was supplied on the cathode and hydrogen was supplied on the anode with a flow rate of 150 mL min−1 and 100 mL min−1, respectively at room temperature. The AEMFC performance of the F-MC (5:1)-950 catalyst was evaluated via the galvanostatic polarization technique using an LCN 100-36 electronic load box (Bitrode Corporation, USA) at RT under ambient pressure and compared with the performance of the MEA fabricated with a Pt–C cathode (0.5 mg cm−2).
Results and discussion
The synthesis of mesoporous carbon (MC) with a unique pore morphology and doping of high electronegative fluorine in the MC is shown in Fig. 1. The catalytic activity of the as-prepared (F-MC) catalyst with different ammonium fluoride contents was assessed via the cyclic voltammetry (CV) technique in both N2- and O2-saturated 0.1 M KOH and compared with the MC. As shown in Fig. 2(a), all the catalysts exhibited voltammograms (dotted line) without any redox peak due to the capacitive effect of MC in an N2 atmosphere. On the other hand, a sharp ORR peak (solid line) was obtained when the cell was saturated with an O2 atmosphere. All the F-MC catalysts showed an improved ORR performance, which signifies the importance of highly electronegative F doping in the carbon matrix. The doping of F alters the surface charge on the carbon matrix because of the difference in electronegativity and enhances the ORR reaction.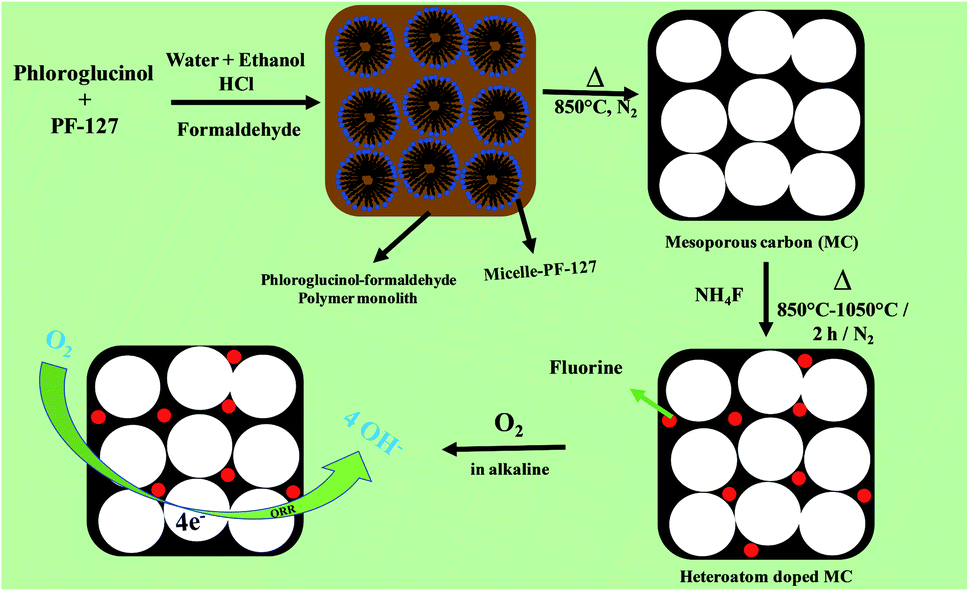 | ||
| Fig. 1 Schematic representation of the synthesis of mesoporous carbon from phloroglucinol–formaldehyde resin using PF-127 surfactant and preparation of fluorine-doped MC. | ||
 | ||
| Fig. 2 (a) CVs of MC, F-MC (2.5:1), F-MC (5:1) and F-MC (7.5:1) catalysts in N2 (dotted line) and O2 (solid line) saturated 0.1 M aqueous KOH with a scan rate of 50 mV s−1 (b) LSVs of MC, F-MC (2.5:1), F-MC (5:1) and F-MC (7.5:1) catalysts in O2-saturated 0.1 M aqueous KOH at 1600 rpm with a scan rate of 5 mV s−1 (c) LSVs at different rotational speeds in O2-saturated 0.1 M aqueous KOH and (d) the corresponding K–L plots at different potentials of the F-MC (5:1) catalyst. | ||
Among the three F-MC catalysts, the F-MC (5:1) catalyst showed the highest catalytic activity with a cathodic peak current density of 1.58 mA cm−2. To gain more information on the reaction kinetics, the catalysts were studied by linear sweep voltammetry with an RDE electrode at a rotation speed of 1600 rpm under an O2 environment, and the resultant LSV voltammograms are displayed in Fig. 2(b). Corroborating the CV data, the F-MC (5:1) catalyst exhibited superior ORR catalytic activity with the highest onset potential of −0.16 V and half-wave potential of −0.28 V. To understand the ORR kinetics pathway of the F-MC (5:1) catalyst, an LSV experiment was carried out at different rotation speeds ranging from 400 to 2800, and the corresponding voltammograms are shown in Fig. 2(c). A linear increase in current with an increase in the rotation speed was observed with a well-defined diffusion-limiting region.
The Koutecky–Levich (K–L) plot was obtained by plotting the inverse of absolute current density versus the inverse of the square root of angular velocity at different voltages from −0.50 V to −0.75 V (Fig. 2(d)). The catalyst exhibited linear K–L plots at an extended potential range, suggesting first-order reaction kinetics. From the slope value, the electron transfer number (n) per oxygen molecule was calculated using eqn (3), which was determined to be ∼4, signifying oxygen is directly reduced to OH− preferentially via the four-electron transfer process on the F-MC catalyst surface. The enhanced catalytic performance of the F-MC (5:1)-850 catalyst is primarily due to the well-optimized dopant content, which results in an increase in the number of active sites for efficient O2 adsorption by altering the charge/spin density on the carbon matrix.
Since the calcination temperature plays a vital role in optimizing the F doping level, pore morphology and graphitization of the carbon matrix, we studied the effect of calcination temperature using the optimized F-MC (5:1) catalyst. The catalytic performance of the F-MC (5:1)-850, F-MC (5:1)-950 and F-MC (5:1)-1050 catalysts was evaluated via the CV technique. As displayed in Fig. 3(a), the ORR peak current densities of 1.58, 2.31 and 1.10 mA cm−2 were obtained for the F-MC (5:1)-850, F-MC (5:1)-950 and F-MC (5:1)-1050 catalyst, respectively. The comparative LSV curves obtained from the RDE experiment at 1600 rpm for all three catalysts are presented in Fig. 3(b). Among the catalysts, the F-MC (5:1)-950 catalyst displayed the highest catalytic activity with the Eonset and E1/2 of −0.10 V and −0.22 V, respectively. This enhancement in catalytic performance is mainly due to the maximum extent of F-doping and optimized defects and graphitization at this temperature. Although the difference in the onset and half-way potential of the F-MC (5:1)-1050 catalyst was not much compared to that of F-MC (5:1)-950, the diffusion-limiting current density (jlim) of F-MC (5:1)-950 was much higher (jlim = 4.87 mA cm−2) than that of the F-MC (5:1)-1050 catalyst (jlim = 4.13 mA cm−2). The reduction in the activity of the heteroatom-doped catalyst at a very high calcination temperature was observed because of the reduction in the heteroatom doping percentage to the base matrix, as discussed in the XPS section.
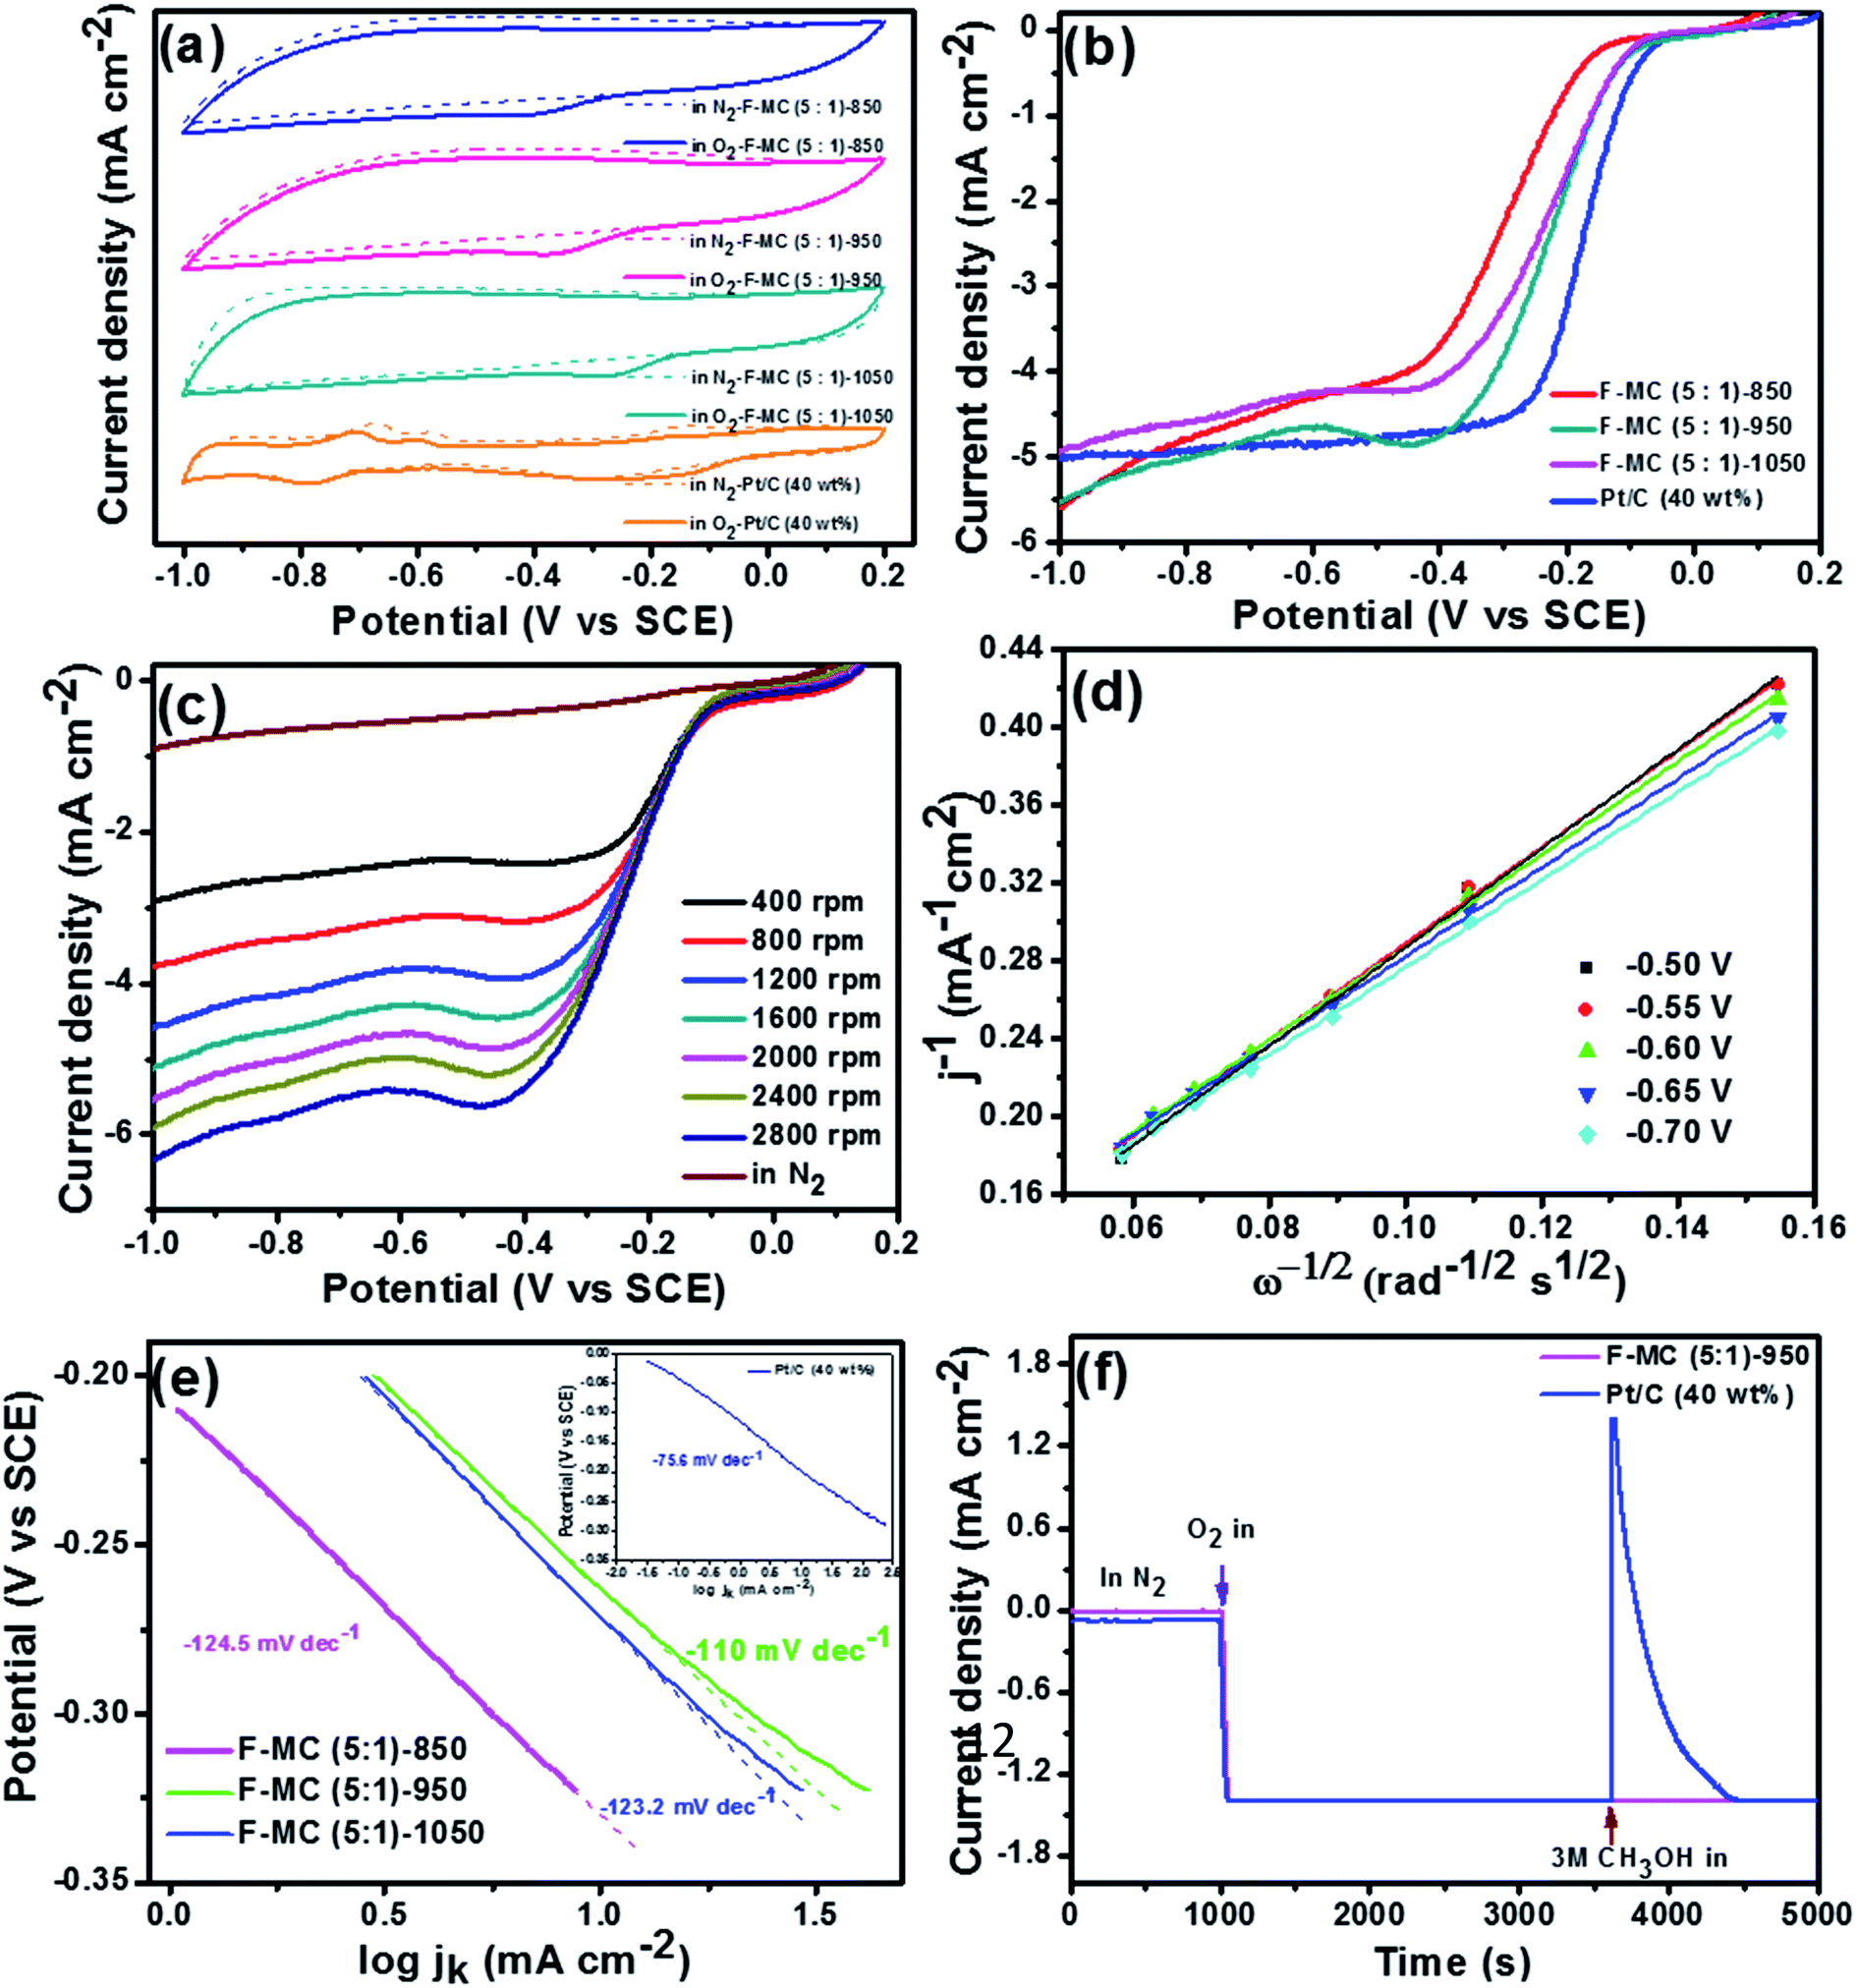 | ||
| Fig. 3 (a) CVs of F-MC (5:1)-850, F-MC (5:1)-950, F-MC (5:1)-1050 and Pt–C (40 wt%) catalysts in N2 (dotted line) and O2 (solid line) saturated 0.1 M aqueous KOH with a scan rate of 50 mV s−1 (b) LSVs of F-MC (5:1)-850, F-MC (5:1)-950, F-MC (5:1)-1050 and Pt–C (40 wt%) catalysts in O2-saturated 0.1 M aqueous KOH at 1600 rpm with a scan rate of 5 mV s−1 (c) LSVs at different rotational speed in O2-saturated 0.1 M aqueous KOH and (d) corresponding K–L plots at different potentials of F-MC (5:1)-950 catalyst. (e) Tafel plot for F-MC (5:1)-850, F-MC (5:1)-950, F-MC (5:1)-1050 and Pt–C (40 wt%) (inset to (e)) derived from mass-transport correction of the RDE data and (f) methanol crossover tolerance test of F-MC (5:1)-950 and Pt–C (40 wt%) catalyst by chronoamperometric analysis at −0.3 V vs. SCE in 0.1 M aqueous KOH. | ||
The catalytic performance of the optimized F-MC (5:1)-950 catalyst was compared with that of the 40 wt% Pt/C catalyst, as shown in Fig. 3(b). F-MC (5:1)-950 exhibited only about 20 mV overpotential on onset and 50 mV half-way potential compared to the performance of 40 wt% Pt/C. Fig. 3(c and d) show the LSV analysis at different rotation speeds and the corresponding K–L plots for F-MC (5:1)-950. The linearity of the K–L plot at various potentials elucidates first-order kinetics towards the ORR, similar to the Pt–C catalyst. The calculated electron transfer number (n = ∼4) also confirms the preferred first-order reaction kinetics of the catalyst. The excellent ORR activity of the F-MC (5:1)-950 catalyst is also supported by the lowest Tafel slope value (−110 mV s−1) compared to F-MC (5:1)-1050 (−123.2 mV s−1), F-MC (5:1)-850 (−124.5 mV s−1), as shown in Fig. 3(e). The Tafel slope for 40 wt% Pt/C is −75.6 mV s−1 (inset of Fig. 3(e)). The catalytic performance of F-MC (5:1)-950 developed in this study was also compared with the similar F-doped catalysts available in the literature. It was found that the ORR catalytic performance of the F-MC (5:1)-950 catalyst developed in this study is higher than that of the fluorine-doped carbon blocks (CB-F) and fluorine-doped carbon nanoparticles (FCNP) studied in the literature.31,32 It is noted that the Eonset of the present catalyst is −100 mV vs. SCE, which is the highest among the catalysts discussed above.
For deeper insight, the ORR pathway was also assessed using the RRDE technique for the F-MC (5:1)-950 and 40 wt% Pt/C catalysts, and the resultant ring current at 1600 rpm is shown in Fig. 4(a). From the disk and ring current, the n value of the F-MC (5:1)-950 catalyst was calculated using eqn (5) to be from −0.1 V to −1.0 V, which shows that the average electron transfer number per oxygen molecule is 3.61 (Fig. 4(b)). This result strongly suggests that the ORR on the F-MC (5:1)-950 catalyst occurs purely via the 4e− pathway like the Pt/C catalyst (average n = 3.89). Using eqn (4), the percentage of peroxide (HO2−) formed during the ORR at various potentials was also calculated, as shown in Fig. 4(b). Like most of the heteroatom-doped catalysts, F-MC (5:1)-950 catalyst showed a slightly higher peroxide formation (19.4%) compared to Pt–C (5.1%) in the wide potential range from −0.1 V to −1.0 V vs. SCE.
 | ||
| Fig. 4 (a) Ring current (Ir) of Pt–C (40 wt%) and F-MC (5:1)-950 catalysts from RRDE analysis in 0.1 M KOH electrolyte at 1600 rpm with a scan rate of 5 mV s−1. (b) Calculated number of electrons transferred and HO2− formation during the ORR. (c and d) LSVs before and after 5000 and 10000 potential cycles of commercial Pt–C (40 wt%) and F-MC (5:1)-950 catalysts in 0.1 M aqueous KOH at 1600 rpm with a scan rate of 5 mV s−1. | ||
The F-MC (5:1)-950 catalyst was tested for its tolerance against methanol using the chronoamperometry technique at −0.3 V vs. SCE using 3 M aqueous methanol, and the resultant current–time response is depicted in Fig. 3(f) and compared with that of the Pt–C catalyst. A plateau region was obtained up to 1000 s in an N2 atmosphere, but both catalysts delivered a current density of 1.4 mA cm−2 as soon as N2 was replaced by O2 at 1000 s. It is important to note that the F-MC (5:1)-950 catalyst did not show any effect towards CH3OH after the addition of 3 M methanol to 0.1 M KOH. However, the ORR catalytic activity of Pt–C shifted towards a negative value in the presence of CH3OH at 3600 s. Thus, the methanol tolerance ability of the F-MC catalyst is expected to deliver maximum efficiency of AEMFC.
The stability of the F-MC (5:1)-950 catalyst was evaluated by cycling the cell potential between 0.2 to −1.0 V vs. SCE up to 10000 cycles at a scan rate of 50 mV s−1 in 0.1 M KOH under constant oxygen purging. As shown in Fig. 4(c), the 40 wt% Pt/C catalyst displayed about 70 and 125 mV loss in half-way potential after 5000 and 10000 cycles, respectively. However, the F-MC (5:1)-950 catalyst showed only 10 mV loss in the halfway potential after 10000 cycles with merely no loss in the onset potential (Fig. 4(d)) while Pt/C exhibited 50 mV loss in the onset after 10000 cycles. The high stability of the F-MC catalyst is due to the absence of metal particles, wherein the chance of metal agglomeration or detachment of metal particles is avoided.43 The notable difference in the limiting current may be attributed to the thinning of the catalyst layer upon long-run potential cycling.44
The crystallinity of the as-synthesized carbon was characterized via wide-angle powder X-ray diffraction and the corresponding diffraction pattern is shown in Fig. 5(a). The two broad and weak diffraction peaks at 2θ = 23° and 43° are assigned to the (002) and (101) lattice planes of the carbonaceous materials, respectively. The broad diffraction peak at 2θ = 23° suggests the prepared carbon is in the amorphous state with a low level of graphitization.45 The XRD analysis presented further evidence of the complete removal of the surfactant after calcination at 850 °C and the obtained carbon is phase pure. As seen in Fig. 5(a), the diffraction patterns of all the fluorine-doped MC prepared at different temperatures also exhibit the two characteristic peaks of carbon. It was observed that the graphitic nature of the fluorine-doped MC catalysts slightly decreased, as understood from the widening of the (002) peak.
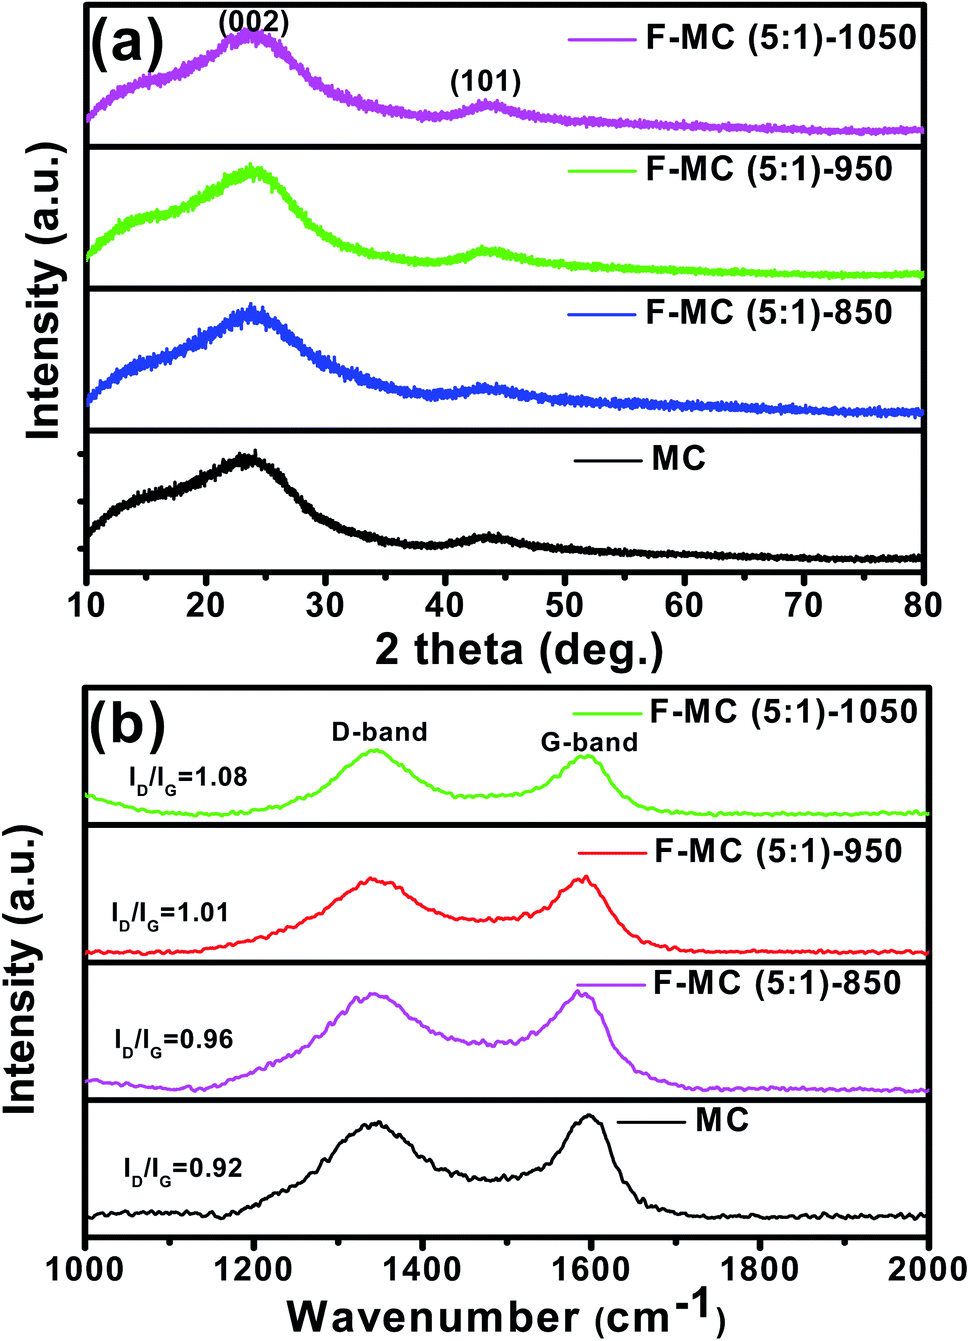 | ||
| Fig. 5 (a) XRD patterns and (b) Raman spectra of F-MC (5:1) catalysts synthesized at different temperatures in comparison with that of pristine MC. | ||
Raman spectroscopy was used to investigate the degree of defects or disorder before and after the doping of MC, as displayed in Fig. 5(b). As seen, all the samples showed two characteristic peaks at around 1345 cm−1 (D-band) and 1597 cm−1 (G-band). The G-band corresponds to the E2g vibration mode of graphitic carbons with the sp2 electronic configuration, while the D-band corresponds to the defects or disorder in the carbon domains. The ratio between the intensity of the D and G band is used to assess the graphitization degree and defects in the carbon matrix. It was observed that the ID/IG ratio increased upon fluorine doping. The F-MC (5:1)-950 catalyst possessed a higher ID/IG ratio (1.01) than that of the pristine MC (0.92), which confirms the effective doping of fluorine atoms in the carbon matrix. As seen in Fig. 5(b), the ID/IG ratio increased with an increase in calcination temperature, and the F-MC (5:1)-1050 catalyst showed the highest ID/IG ratio (1.08). The higher defects of the F-MC (5:1)-1050 catalyst can be attributed to the breakdown of the carbon network and formation of nanopores at the walls of mesopores during the calcination process at a relatively higher temperature.46 The higher catalytic activity of the F-MC (5:1)-950 catalyst can be understood from the optimum degree of graphitization and pore structure of the catalyst. The increase in the number of defective sites is favourable for oxygen adsorption and its subsequent facile reduction on the F-MC catalytic surface.
Fig. 6 shows the N2 adsorption–desorption isotherms and the corresponding pore size distribution (PSD) of MC and F-MC (5:1) catalyst prepared at different calcination temperatures. All the samples exhibited well-observed adsorption–desorption isotherms with a broad hysteresis loop exhibiting type IV isotherms.27 The as-synthesized MC possessed a BET surface area of 428.93 m2 g−1 with an average pore diameter of 4.10 nm, which implies the prepared carbon is mesoporous (Fig. 6(a)). The BET surface area and pore diameter of MC increased after F doping even at the same calcination temperature used to prepare MC (i.e. 850 °C), suggesting the creation of the defects due to the successful incorporation F atoms in the MC matrix. As calcination temperatures increased from 850 °C to 950 °C, the BET surface area increased from 512.24 to 719.58 m2 g−1. This increase in surface area can be understood from the Raman analysis in which more defects in the carbon matrix were observed as the calcination temperature increased. It is further attributed to the reduction in crystallite size of the carbon derived from phenol resin with an increase in calcination temperature.47 In contrast, the average pore diameter decreased from 9.0 nm (for F-MC (5:1)-850) to 7.4 nm (for F-MC (5:1)-950), which is attributed to the nanopore formation at the walls of the mesopores at a higher calcination temperature, as discussed in the previous section. However, both the specific surface area and pore diameter decreased for the catalyst prepared at 1050 (Fig. 6(d)) to 293.87 m2 g−1 and 6.3 nm, respectively, which may be due to the breakdown of the carbon network at a very high calcination temperature. Hence, the higher activity of the F-MC (5:1)-950 catalyst can also be understood from its high specific surface area and optimal pore size, which are expected to result in the adsorption of more O2 molecules and their facile reduction.
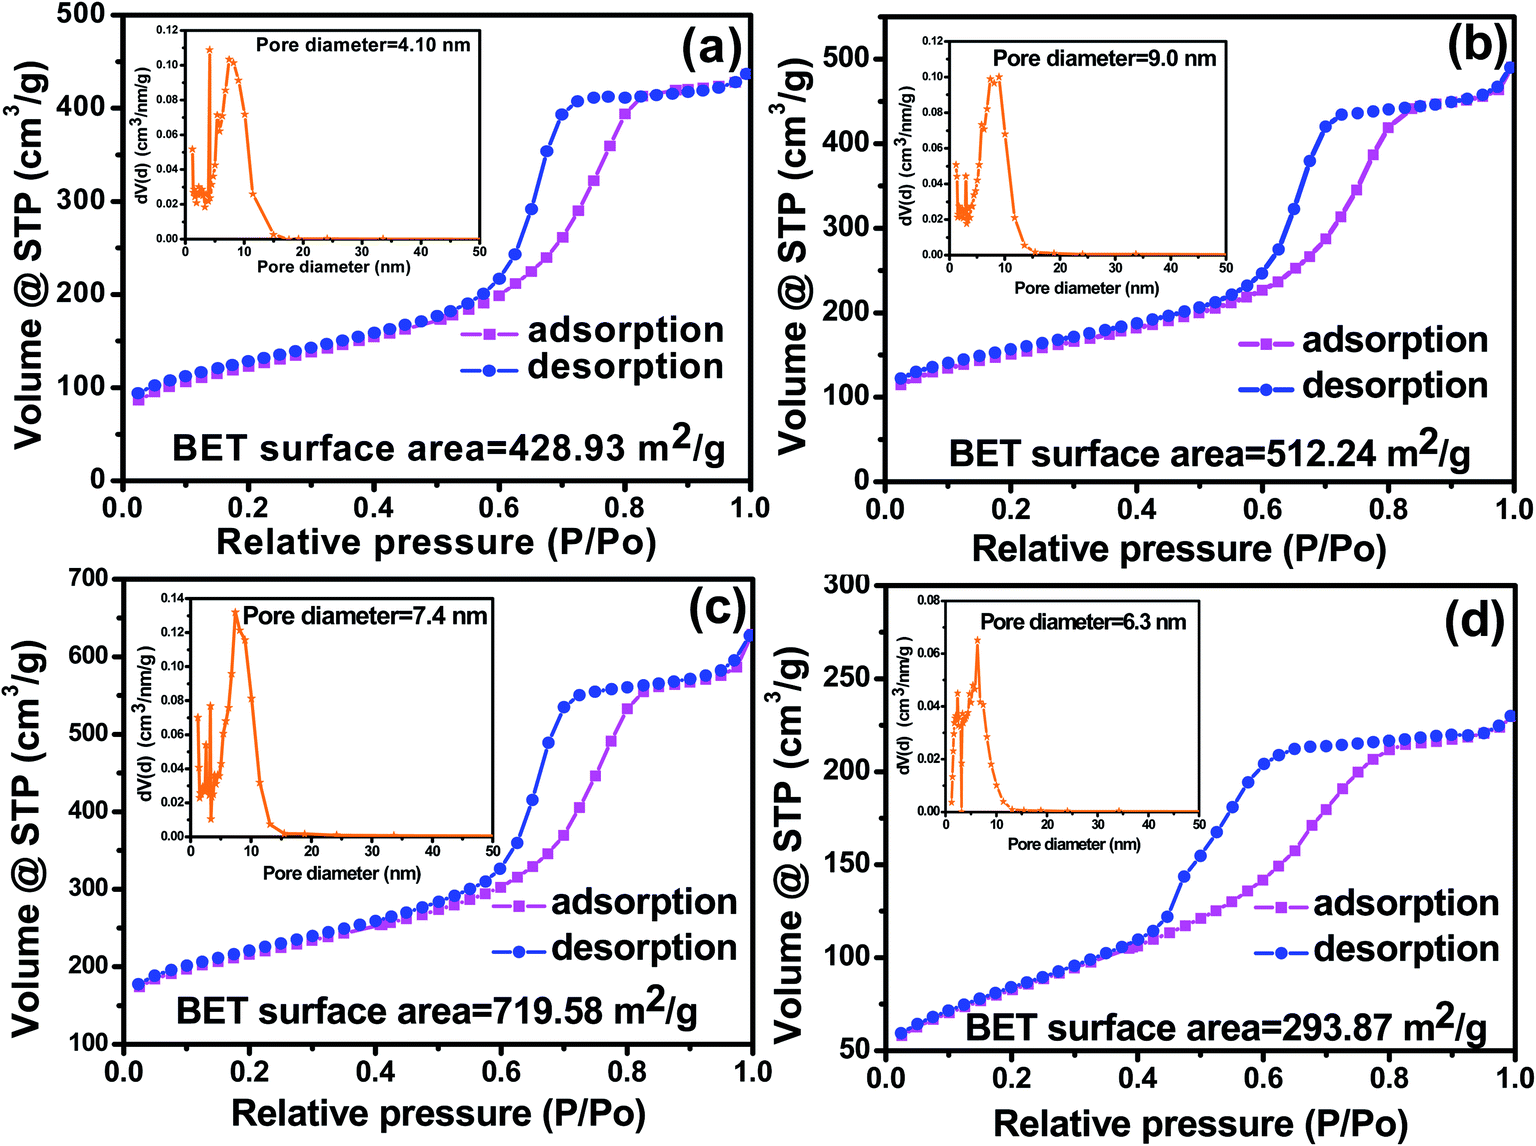 | ||
| Fig. 6 BET nitrogen adsorption–desorption isotherms of (a) MC, (b) F-MC (5:1)-850, (c) F-MC (5:1)-950 and (d) F-MC (5:1)-1050 catalysts (inset in each figure shows the pore size distribution analysis). | ||
The morphological features of MC and F-MC (5:1)-950 catalyst were examined by TEM and the corresponding micrographs are shown in Fig. 7(a and b), respectively. The TEM images revealed the slightly irregular mesoporous morphology of both samples with a pore diameter of ∼6 nm and no obvious morphological difference was found upon fluorine doping. The selected area electron diffraction (SAED) pattern (inset in Fig. 7(a)) with a characteristic diffused ring further confirms the amorphous nature of the prepared catalyst.48 Besides, the FE-SEM energy-dispersive X-ray spectroscopy (EDS) elemental mapping of the F-MC (5:1)-950 catalyst (Fig. 7(c–f)) discloses the homogeneous distribution of fluorine over the MC matrix. The atomic weight percentage of fluorine in this catalyst was found to be 0.42 at%.
 | ||
| Fig. 7 (a and b) TEM morphology of MC and F-MC (5:1)-950, (c) FE-SEM image of F-MC (5:1)-950 catalyst and (d–f) corresponding EDS elemental mappings of carbon, oxygen and fluorine. | ||
X-ray photoelectron spectroscopy (XPS) is an effective tool to analyze the elemental composition on the surface up to 10 nm depth, and hence was used to analyze the chemical state and the atomic percentage of the doped fluorine atoms in the F-MC catalyst. As shown in Fig. 8(a), carbon, oxygen, and fluorine elements were found in the XPS survey spectrum of F-MC (5:1)-950 catalyst with the atomic percentage of 88.4, 11.1 and 0.40 at%, respectively. It was also noted that no nitrogen was found. This proves MC was purely doped with fluorine. The XPS analysis also revealed an increase in the doped F content from <0.1 at% to 0.40 at% as the calcination temperature increased from 850 °C to 950 °C. A high fluorine content led to more accessible catalytic sites for oxygen reduction. The combined effect of the optimal pore size of the MC matrix and F-doping is primarily responsible for the enhanced ORR activity of the F-MC (5:1)-950 catalyst. However, the increase in calcination temperature to 1050 °C reduced the fluorine content to 0.27 at%, which directly affected the catalytic performance of the F-MC (5:1)-1050 catalyst (XPS data for 850 and 1050 is not shown). As discussed in the Raman analysis, the very low level of graphitization of the F-MC (5:1)-1050 catalyst with more defects further contributed to its inferior catalytic activity. The magnified F 1s spectrum (inset of Fig. 8(b)) of the F-MC (5:1)-950 catalyst could be deconvoluted into two peaks at 690.4 eV (semi-ionic C–F bond) and 684.9 eV (ionic C–F bond) (Fig. 8(b)).32,49 The relative content of ionic and semi-ionic bond is 79.4% and 20.6%, respectively. The ionic C–F bond in fluorine-doped carbon catalysts possesses higher activity compared to the semi-ionic and covalent C–F bonds.50 Since the chemical state of doped fluorine atoms is only ionic and semi-ionic state, the F-MC (5:1)-950 catalyst demonstrated superior ORR activity. The fluorine doping in porous carbon creates a positive charge on the carbon as a consequence of the large electronegativity difference between the fluorine and carbon atoms, which enhances the O2 adsorption and weakens the O–O bonding, thus facilitating the ORR reaction.
 | ||
| Fig. 8 (a) XPS survey spectrum and (b) Deconvoluted F 1s spectra of F-MC (5:1)-950 catalyst (inset in (b) shows the high magnified F 1s spectrum). | ||
To gain an atomic-level understating of catalytic activity of the fluorine-doped graphitic porous carbon, we modelled a graphene sheet with a point defect since there was significant defect density observed from our Raman spectroscopy measurements (refer Fig. 5(b)). In the pristine graphene, the C–C bond distances were found to be 1.42 Å, whereas in the defective case, this distance was reduced to 1.35 Å. Besides, a long C–C bond was formed with a distance of 1.83 Å as a result of mutually saturating two second neighbouring C atoms. Note that in the pristine MC, the separation between two-second neighbouring C atoms is 2.48 Å. Since this bond is so weak, it is expected to have high catalytic activity on this site. It was also noticed that two coordinated C atoms, C(2c), are exactly located opposite to the long C*–C* bond (Fig. 9(a)). Further, we also carried out Bader charge analysis and it inferred that two C* atoms in this bond are neutral, while the C(2c) atom has an electronic charge of 1.30e−. To compensate this charge, nearby C atoms carry the positive charge of 1.23e− and the rest of the charge is distributed on the other C atoms. To model the F-doped graphitic network, the F atom was preferentially bonded with the C(2c) atom. The bonded F atom is buckled outwardly and forms a strong bond with C(2c) atom (distance = 1.37 Å). The Bader charge for the F atom was calculated to be −0.77e−. After forming the bond with the F atom, the charge on the C(2c) atom becomes −1.92e−, while two nearby C atoms possess a charge of +1.29e−.
 | ||
| Fig. 9 (a) Top view of optimized graphene layer (4 × 4 supercell) with one carbon defect. (b) Optimized structures of (b1) 1H, (b2) 2H (H2O and H2O2 forming configurations), (b3) 3H (H3O and H2O formed cases), and (b4) 4H adsorbed cases. Here, grey, red, green, and blue balls represent C, O, F, and H atoms, respectively. The charge on the oxygen atoms and adsorption energy (Ead) for all the cases are written in the corresponding boxes. | ||
To understand the ORR activity, the O2 molecule is allowed to interact with the C* sites. As a result, the C*–C* bond distance increases to 3.08 Å (from 1.83 Å) and the magnetic moment on the O2 molecule is completely quenched owing to the strong adsorption between the molecule and surface. The observed C–O and O–O bond distances are 1.23 and 2.45 Å, respectively. The Bader charge analysis revealed that each oxygen atom carries an electronic charge of −1.75e− and this charge is obviously obtained from two C* atoms. In this situation, the H atom is now added to this system. The optimized structure (shown in Fig. 9(b)) indicated that the H atom prefers to bind between the two O atoms, and thus, the O–O distance slightly decreased to 2.35 Å. Note that the H atom is strongly bonded with one of the O atoms with a distance of 1.03 Å, while a weak interaction is observed with the other O atom (a distance of 1.43 Å). In this case, the C*–C* distance is slightly elongated to 3.15 Å. The Bader charge on the C(2c) atom and two C* atoms is 0.69, 1.39, and 1.19e−, respectively. The charges on the O atoms are −1.77 and −1.67e−. This indicates that the adsorbed H atom firstly reduces the C atoms in the graphitic network. The H adsorption energy (Ead) was calculated to be 3.33 eV using the following equation:
| Ead = E[sys/(n − 1)H] + E[nH] − E[sys/nH] |
For depositing a second H atom in the network, we attempted two cases, one is water is formed and the other is two OH forming configurations. Between them, the configuration with water formed was found to be 2.05 eV more stable compared to that of the other case. The Ead for this case was calculated to be 3.82 eV. It is interesting to observe that after forming a water molecule, another oxygen atom binds with two C* atoms, establishing an ether-like network. Due to the formation of this network, the C*–C* bond distance decreases to 2.43 Å, and C–O is separated by 1.40 Å. From this step, it is clear that the ORR takes place through the four-electron pathway, rather the two-electron pathway.
Here, the third H atom is introduced into the system in two different ways: (1) H3O+ ion bonded with O–C* and (2) water molecule weakly interacting with OH on the surface. Our calculations revealed that the former configuration is more stable by 0.99 eV compared to the latter case. The Ead for this case was estimated to be 1.25 eV, which is significantly lower in comparison to that of one and two H adsorption processes. When a fourth H atom is added to the above system, the optimized structures show that two water molecules are formed. Note that these water molecules weakly interact with each other (separation of 1.87 Å), as well as, with the graphene layer. Since, water molecules weakly interact with the surface, the C*–C* bond distance decreases to 1.77 Å. The Ead value of the fourth H atoms is 2.20 eV. Thus, our theoretical calculations clearly elucidated that the O2 reduction on the F-doped graphic network prefers the four-election pathway, rather than the two-electron pathway.
Finally, the realistic performance of the F-MC catalyst was evaluated in an AEMFC by assembling an F-MC (5:1)-950-coated cathode electrode and compared with that of the 40 wt% Pt/C cathode catalyst layers at room temperature, and the obtained polarization curves are shown in Fig. 10. The MEA assembled with the F-MC (5:1)-950 cathode delivered a peak power density of 10 mW cm−2, while a peak power density of 38 mW cm−2 was achieved with the Pt/C cathode under the same operating conditions. Although the AEMFC performance of the present catalyst is lower than that of Pt/C, the F-MC (5:1)-950 catalyst can be considered an alternative to the Pt/C catalyst in terms of its excellent long-term stability and cost-effective synthesis.
 | ||
| Fig. 10 AEMFCs polarization and power density curves for the F-MC (5:1)-950 catalyst at room temperature under ambient pressure (inset shows the AEMFC polarization curve for commercial Pt–C (40 wt%). | ||
Conclusions
A novel alternative metal-free ORR electrocatalyst was established by enriching the highly electronegative F atom in mesoporous carbon and its defect chemistry, electron transfer during the ORR, and its suitability towards AEMFCs were systematically studied. Notably, the F-MC (5:1)-950 catalyst showed excellent ORR activity in alkaline media with an onset potential of −0.10 V vs. SCE and diffusion-limiting current of 4.87 mA cm−2, while displaying only ∼50 mV lower potential in the half-wave region compared to Pt–C (40 wt%). Besides, the RRDE analysis, DFT calculations also revealed the facile reduction of O2 molecules on F-MC via the preferred 4e− reduction pathway. Excellent tolerance to methanol and good electrochemical stability with only ∼10 mV loss in the half-wave region was realized for this F-MC catalyst, while Pt–C showed a 125 mV negative shift in its E1/2 after 10000 repeated potential cycles in 0.1 M KOH. F-MC (5:1)-950 delivered a power density of 10 mW cm−2 in a single-cell AEMFC, which indicates the potential application of this catalyst as an alternative fuel cell cathode catalyst.
Conflicts of interest
There are no conflicts to declare.Acknowledgements
Financial support by CSIR, New Delhi, is gratefully acknowledged. We thank Prof. Ashutosh Sharma, IIT, Kanpur, for his constant encouragement and support. V. P. thanks CSIR for awarding Senior Research Fellowship (31/20 (158)/2017-EMR-I) to pursue research at CSIR-CECRI. BB acknowledges the DST Women Scientist Project.References
- W. Zhang, Y.-S. He, S. Zhang, X. Yang, X. Yuan and Z.-F. Ma, Electrochem. Commun., 2017, 81, 34–37 CrossRef CAS.
- Y. Sun, Y. Liang, M. Luo, F. Lv, Y. Qin, L. Wang, C. Xu, E. Fu and S. Guo, Small, 2018, 14, 1–8 Search PubMed.
- A. Arunchander, S. G. Peera, V. V. Giridhar and A. K. Sahu, J. Electrochem. Soc., 2017, 164, F71–F80 CrossRef CAS.
- A. Kostuch, J. Grybos, P. Indyka, L. Osmieri, S. Specchia, Z. Sojka and K. Kruczala, Catal. Sci. Technol., 2018, 8, 642–655 RSC.
- J. Ma, D. Xiao, C. L. Chen, Q. Luo, Y. Yu, J. Zhou, C. Guo, K. Li, J. Ma, L. Zheng and X. Zuo, J. Power Sources, 2018, 378, 491–498 CrossRef CAS.
- Q. Xiang, Y. Liu, X. Zou, B. Hu, Y. Qiang, D. Yu, W. Yin and C. Chen, ACS Appl. Mater. Interfaces, 2018, 10, 10842–10850 CrossRef CAS PubMed.
- W. Shuangyin, Z. Lipeng, X. Zhenhai, R. Ajit, C. D. Wook, B. Jong-Beom and D. Liming, Angew. Chem., Int. Ed., 2012, 51, 4209–4212 CrossRef PubMed.
- J. Ying, J. Li, G. Jiang, Z. P. Cano, Z. Ma, C. Zhong, D. Su and Z. Chen, Appl. Catal., B, 2018, 225, 496–503 CrossRef CAS.
- S. G. Peera, A. Arunchander and A. K Sahu, Nanoscale, 2016, 8, 14650–14664 RSC.
- S. Ratso, I. Kruusenberg, M. Vikkisk, U. Joost, E. Shulga, I. Kink, T. Kallio and K. Tammeveski, Carbon, 2014, 73, 361–370 CrossRef CAS.
- M. Hoque, S. Zhang, M. L. Thomas, Z. Li, S. Suzuki, A. Ando, M. Yanagi, Y. Kobayashi, K. Dokko and M. Watanabe, J. Mater. Chem. A, 2018, 6, 1138–1149 RSC.
- A. Arunchander, S. G. Peera and A. K. Sahu, J. Power Sources, 2017, 353, 104–114 CrossRef CAS.
- K. Chatterjee, M. Ashokkumar, H. Gullapalli, Y. Gong, R. Vajtai, P. Thanikaivelan and P. M. Ajayan, Carbon, 2018, 130, 645–651 CrossRef CAS.
- G. C. Abuin, E. A. Franceschini, P. Nonjola, M. K. Mathe, M. Modibedi and H. R. Corti, J. Power Sources, 2015, 279, 450–459 CrossRef CAS.
- A. Arunchander, S. G. Peera and A. K. Sahu, ChemElectroChem, 2017, 4, 1544–1553 CrossRef CAS.
- M. Borghei, N. Laocharoen, E. Kibena-Põldsepp, L. S. Johansson, J. Campbell, E. Kauppinen, K. Tammeveski and O. J. Rojas, Appl. Catal., B, 2017, 204, 394–402 CrossRef CAS.
- Z. Pei, H. Li, Y. Huang, Q. Xue, Y. Huang, M. Zhu, Z. Wang and C. Zhi, Energy Environ. Sci., 2017, 10, 742–749 RSC.
- S. G. Peera, A. K. Sahu, A. Arunchander, S. D. Bhat, J. Karthikeyan and P. Murugan, Carbon, 2015, 93, 130–142 CrossRef CAS.
- A. Arunchander, S. G. Peera, S. K. Panda, S. Chellammal and A. K. Sahu, Carbon, 2017, 118, 531–544 CrossRef CAS.
- A. Srinu, S. G. Peera, V. Parthiban, B. Bhuvaneshwari and A. K. Sahu, ChemistrySelect, 2018, 3, 690–702 CrossRef CAS.
- S. Wang, X. Ji, Y. Ao and J. Yu, ACS Appl. Mater. Interfaces, 2018, 10, 29866–29875 CrossRef CAS PubMed.
- S. Akula, V. Parthiban, S. G. Peera, B. P. Singh, S. R. Dhakate and A. K. Sahu, J. Electrochem. Soc., 2017, 164, F568–F576 CrossRef CAS.
- L. Chen, C. Xu, R. Du, Y. Mao, C. Xue, L. Chen, L. Qu, J. Zhang and T. Yi, J. Mater. Chem. A, 2015, 3, 5617–5627 RSC.
- H. Yuan, L. Deng, X. Cai, S. Zhou, Y. Chen and Y. Yuan, RSC Adv., 2015, 5, 56121–56129 RSC.
- A. Katzfuß, S. Poynton, J. Varcoe, V. Gogel, U. Storr and J. Kerres, J. Membr. Sci., 2014, 465, 129–137 CrossRef.
- D.-S. Yang, D. Bhattacharjya, M. Y. Song and J.-S. Yu, Carbon, 2014, 67, 736–743 CrossRef CAS.
- Y. She, J. Chen, C. Zhang, Z. Lu, M. Ni, P. H. L. Sit and M. K. H. Leung, Appl. Energy, 2018, 225, 513–521 CrossRef CAS.
- Z. Ma, K. Wang, Y. Qiu, X. Liu, C. Cao, Y. Feng and P. A. Hu, Energy, 2018, 143, 43–55 CrossRef CAS.
- X. Zou, L. Wang and B. I. Yakobson, Nanoscale, 2018, 10, 1129–1134 RSC.
- X. Cai, L. Zhou, B. Tan, C. Yang, L. Sun, Y. Wang, S. Zhou, S. Pu and Y. Yuan, Int. J. Hydrogen Energy, 2018, 43, 17708–17717 CrossRef CAS.
- X. Sun, Y. Zhang, P. Song, J. Pan, L. Zhuang, W. Xu and W. Xing, ACS Catal., 2013, 3, 1726–1729 CrossRef CAS.
- G. Panomsuwan, N. Saito and T. Ishizaki, J. Mater. Chem. A, 2015, 3, 9972–9981 RSC.
- D. Yu, L. Zhou, J. Tang, J. Li, J. Hu, C. Peng and H. Liu, Ind. Eng. Chem. Res., 2017, 56, 8880–8887 CrossRef CAS.
- H. Jiang, Y. Wang, J. Hao, Y. Liu, W. Li and J. Li, Carbon, 2017, 122, 64–73 CrossRef CAS.
- Y. Zhang, X. Zhang, X. Ma, W. Guo, C. Wang, T. Asefa and X. He, Sci. Rep., 2017, 7, 43366 CrossRef PubMed.
- X. Li, B. Y. Guan, S. Gao and X. W. David Lou, Energy Environ. Sci., 2019, 12, 648–655 RSC.
- Y. Zhao, X. Li, X. Jia and S. Gao, Nano Energy, 2019, 58, 384–391 CrossRef CAS.
- S. Sasikala, S. V. Selvaganesh, A. K. Sahu, A. Carbone and E. Passalacqua, J. Membr. Sci., 2016, 499, 503–514 CrossRef CAS.
- G. Kresse and J. Furthmüller, Phys. Rev. B: Condens. Matter Mater. Phys., 1996, 54, 11169–11186 CrossRef CAS PubMed.
- G. Kresse and D. Joubert, Phys. Rev. B: Condens. Matter Mater. Phys., 1999, 59, 1758–1775 CrossRef CAS.
- P. E. Blöchl, Phys. Rev. B: Condens. Matter Mater. Phys., 1994, 50, 17953–17979 CrossRef PubMed.
- C. Perdew, J. Vosko, S. Pederson and C. Fiolhais, Phys. Rev. B: Condens. Matter Mater. Phys., 1992, 46, 6671–6687 CrossRef PubMed.
- L. Zhang, Z. Su, F. Jiang, L. Yang, J. Qian, Y. Zhou, W. Li and M. Hong, Nanoscale, 2014, 6, 6590–6602 RSC.
- G. Wu, M. A. Nelson, N. H. Mack, S. Ma, P. Sekhar, F. H. Garzon and P. Zelenay, Chem. Commun., 2010, 46, 7489–7491 RSC.
- H. Guo and Q. Gao, J. Power Sources, 2009, 186, 551–556 CrossRef CAS.
- G. Tao, L. Zhang, L. Chen, X. Cui, Z. Hua, M. Wang, J. Wang, Y. Chen and J. Shi, Carbon, 2015, 86, 108–117 CrossRef CAS.
- Y. Mun, M. J. Kim, S. A. Park, E. Lee, Y. Ye, S. Lee, Y. T. Kim, S. Kim, O. H. Kim, Y. H. Cho, Y. E. Sung and J. Lee, Appl. Catal., B, 2018, 222, 191–199 CrossRef CAS.
- J. Jin, F. Pan, L. Jiang, X. Fu, A. Liang, Z. Wei, J. Zhang and G. Sun, ACS Nano, 2014, 8, 3313–3321 CrossRef CAS PubMed.
- H. Wang, J. Ding, J. Zhang, C. Wang, W. Yang, H. Ren and A. Kong, RSC Adv., 2016, 6, 79928–79933 RSC.
- X. Sun, P. Song, Y. Zhang, C. Liu, W. Xu and W. Xing, Sci. Rep., 2013, 3, 2505 CrossRef PubMed.
| This journal is © The Royal Society of Chemistry 2019 |