 Open Access Article
Ba-addition induced enhanced surface reducibility of SrTiO3: implications on catalytic aspects†
Noopur
Jain
 *ab,
Ahin
Roy
a and
Angana
De
a
aDepartment of Biological Sciences, National University of Singapore (NUS), Singapore
bMaterials Research Centre, Indian Institute of Science (IISc), Bangalore-560012, India. E-mail: nj11189@gmail.com
First published on 29th October 2019
Abstract
Surface reducibility engineering is one of the vital tools to enhance the catalytic activity of materials. A heavy redox treatment can be utilized to affect the structure and surface of catalytic materials. Here, we choose SrTiO3 (STO) with a cubic perovskite structure as a system to induce oxygen vacancies by using nascent hydrogen from NaBH4 leading to a heavily reduced version of SrTiO3 (RSTO). To further understand the surface reduction and its dependence on foreign-ion (Ba) incorporation into SrTiO3, Sr0.5Ba0.5TiO3 (SBTO) and BaTiO3 (BTO) are synthesized using a facile hydrothermal method. The reduced version of the pristine and mixed oxide shows distinct optical absorptions, indicating oxygen vacancy-mediated reducibility engineering. Detailed CO oxidation experiments suggest the order of activity over the as-prepared and reduced supports as STO > SBTO > BTO and RSBTO > RSTO > RBTO, respectively. The interesting observation of reversal of CO oxidation activity over STO and SBTO after reduction negates the assumption of a similar intensity of reduction on the surfaces of these oxide supports. The fundamental aspect of surface reducibility is addressed using temperature programmed reduction/oxidation (TPR/TPO) and XPS.
1 Introduction
Materials of the ABO3 family, such as BaTiO3, SrTiO3, etc., have received enormous popularity as ferroelectric materials.1–3 Owing to the abundance of Ba and Sr, their electro-optical and thermoelectric properties have been well studied due to their technological implications.4–6 Notably, other than the presence of excess of electrons governing the electronic properties in the structure of these perovskites, there is a co-existence of oxygen vacancies.7–11 Recently, observations of oxygen vacancy induced reduced Ti-states have been highlighted.12–15 Although these materials are continuing to be employed in other applications,16,17 their use in catalysis is still less explored.18–21 Oxygen vacancies in the structure play an important role in reactions involving dissociative O2 activation11,22,23 over oxide supports.24–30Several methods have been employed for the synthesis of these perovskite materials, such as sol–gel method,31,32 solid-state reaction,33 wet-chemical method,34 combustion,35 hydrothermal method,36etc. Among these, the hydrothermal method stands out due to its low-temperature requirements and lower cost of operation. The hydrothermal synthesis of SrTiO3 (STO) has been attempted with various modifications and is reported in the literature.37–39 Once synthesized, the structural integrity of the material allows reduction treatments to result in oxygen vacancies without affecting the microstructure.40 A facile method is reported to introduce oxygen vacancies onto the surface of the SrTiO3 structure.15 It focuses on the use of NaBH4 to generate H2 locally near the materials. In this method, NaBH4 acts as an oxygen scavenger.41 At mild reaction temperatures, NaBH4 decomposes and produces nascent hydrogen.42 This nascent hydrogen being more reactive than molecular H2 creates a harsh reducing environment near the surface of the material.22,43 Previously, the generation of oxygen vacancies has been explained by the conversion of Ti4+ states to Ti2+ states on the surface of heavily reduced SrTiO3.15,44
It is required to explore the generation of oxygen vacancies at Ti surface states in similar perovskite structures. In this work, we introduce a foreign A-site cation (Ba) into the SrTiO3 nano-cuboids using hydrothermal synthesis. According to the BaTiO3–SrTiO3 phase diagram, BaTiO3 and SrTiO3 exhibit complete solid solubility over the complete range of composition.45 The resulting nano-cuboids of Sr5Ba0.5TiO3 (SBTO) are compared for their surface adsorption and catalytic behaviour with the pristine materials, SrTiO3 (STO) and BaTiO3 (BTO). We discuss the oxygen vacancy formation capacity of the three perovskite materials, STO, BTO and SBTO, upon heavy reduction treatment with NaBH4. A series of coloured powders of reduced-STO (RSTO, light-grey), -BTO (RBTO, violet) and -SBTO (RSBTO, dark grey) were observed after the reduction. The effect of incorporation of Ba into SrTiO3 on the oxygen vacancy formation is observed to induce interesting trends of CO oxidation activity and redox behaviour. The trend of catalytic activity could be directly related to the oxygen vacancies introduced into the material. Interestingly, the original highest CO oxidation activity observed over STO shows a reversal after the reduction treatment, rendering RSBTO the most active catalytic material. This trend in reversal of activities over SBTO and STO has been explained by correlating adsorption experiments and XPS.
2 Experimental section
2.1 Synthesis of SrTiO3, BaTiO3 and Sr0.5Ba0.5TiO3
To carry out the synthesis of SrTiO3 (STO), solution A was prepared by dissolving 9 mmol Sr(OH)2·xH2O (Alfa Aesar, 99.99%) in 47 mL DI water and 3 mL glacial acetic acid. To prepare solution B, 9 mmol TiCl4 (Sigma Aldrich, 99.99%) was added to 20 mL ethanol to obtain a yellowish clear solution. Solution B is then added to solution A under vigorous stirring to obtain a light-yellow clear solution. The addition of 5 g NaOH made the clear solution to start becoming turbid. During the dissolution of NaOH pellets, a white gel was formed which eventually breaks during stirring. The product, a white viscous solution, is further sealed in an autoclave and subjected to hydrothermal reaction at 240 °C for 24 h. The same procedure was followed to prepare other materials, where BaOH2·xH2O (Alfa Aesar, 99.99%) and a mixture (1![[thin space (1/6-em)]](https://www.rsc.org/images/entities/char_2009.gif) :
:![[thin space (1/6-em)]](https://www.rsc.org/images/entities/char_2009.gif) 1) of Sr(OH)2 and Ba(OH)2 were used to prepare BaTiO3 (BTO) and Sr0.5Ba0.5TiO3 (SBTO), respectively. For the synthesis of SBTO, multiple experiments were performed by varying the reaction parameters of the hydrothermal synthesis. The products obtained after hydrothermal treatment were white in color. The materials were washed with DI water and ethanol. They were dried at 70 °C overnight to obtain white powders of SrTiO3 (STO), BaTiO3 (BTO) and Sr0.5Ba0.5TiO3 (SBTO).
1) of Sr(OH)2 and Ba(OH)2 were used to prepare BaTiO3 (BTO) and Sr0.5Ba0.5TiO3 (SBTO), respectively. For the synthesis of SBTO, multiple experiments were performed by varying the reaction parameters of the hydrothermal synthesis. The products obtained after hydrothermal treatment were white in color. The materials were washed with DI water and ethanol. They were dried at 70 °C overnight to obtain white powders of SrTiO3 (STO), BaTiO3 (BTO) and Sr0.5Ba0.5TiO3 (SBTO).
2.2 NaBH4 reduction treatment
After hydrothermal treatment, the obtained white powders were subjected to a strong reduction treatment. 1 g of the white powder was thoroughly mixed with 0.4 g of NaBH4 (Spectrochem Pvt. Ltd). This mixture is this transferred to a quartz crucible into a furnace pre-set at 400 °C for 1 h. The reduction of the white STO powder generated a light-grey coloured powder of reduced-STO (RSTO). Similarly, the reduction of white BTO and SBTO powders resulted in violet and dark grey coloured powders of reduced-BTO (RBTO) and reduced-SBTO (RSBTO). These as-synthesized and reduced oxides were further used as supports for Pt nanoparticle decoration.2.3 Pt-decoration on reduced supports
Ultrafine Pt nanoparticles were nucleated on the three as-prepared and reduced supports using a facile microwave technique. To do this, 10 mg of the support powder was sonicated and dispersed in 15 mL ethylene glycol (EG). A Pt precursor salt (H2PtCl6·6H2O) corresponding to 1 wt% Pt was added to this mixture and sonicated to ensure proper mixing. Once the dispersion appears uniform, it is subjected to microwave irradiation at 100 °C for 5 min. The precipitates obtained after the microwave reaction on all materials were black in colour and indistinguishable. These Pt-decorated oxides will be referred to as Pt/-STO, Pt-BTO, Pt-SBTO, Pt-RSTO, Pt-RBTO and Pt-RSBTO in the text.2.4 Characterization
The synthesized materials were characterized by XRD, XPS, TEM, and temperature programmed reduction/oxidation (TPR/TPO). To determine the crystal structure of the materials, the XRD pattern was collected at 28 °C with a PANalytical X-ray diffractometer. The diffractometer was equipped with Cu Kα radiation (λ = 1.5418 Å). The XRD pattern was recorded in the 2θ range from 10° to 80° with steps of 0.02°. XPS data were collected on an AXIS ULTRA instrument using Al Kα (1486.6 eV) as the source. A pass energy of 20 eV was used while recording the spectra. TEM micrographs, high resolution TEM (HRTEM) micrographs, and electron diffraction patterns were obtained using a Tecnai T-20, operating at 200 kV. Compositional analysis was done using the STEM-EDS technique on a Tecnai FEI TITAN G2 operating at 300 kV. Temperature programmed reduction/oxidation was performed on an Autosorb iQ (Quantachrome) instrument equipped with a thermal conductivity detector (TCD).2.5 Catalytic experiments
CO oxidation was performed over bare oxides, reduced-oxides and Pt-decorated support oxides using a gas chromatograph (Mayura Analytical Pvt. Ltd.). 70 mg catalyst were used to prepare the catalytic bed in a quartz reactor and placed inside a furnace, equipped with a PID controller. The concentration of gas at the inlets and outlets was detected using a flame ionization detector (FID) and a methanator. A mixture of 1 vol% CO, 1 vol% O2 and N2 as a balance was used for the experiments and a constant total flow rate of 100 mL min−1 was used. The gas hourly space velocity (GHSV) was calculated to be 22![[thin space (1/6-em)]](https://www.rsc.org/images/entities/char_2009.gif) 500 h−1.
500 h−1.
3 Results
3.1 X-ray diffraction (XRD)
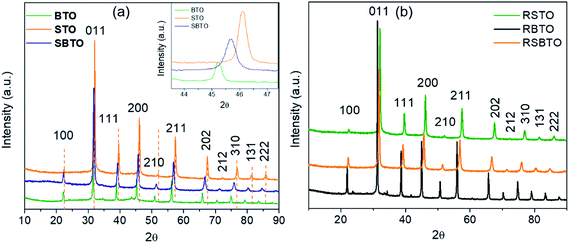
The crystal structure of the synthesized materials was confirmed using XRD. The XRD patterns of STO, BTO and SBTO are shown in Fig. 1a. All the three patterns belong to the cubic perovskite structure with the space group Pm![[3 with combining macron]](https://www.rsc.org/images/entities/char_0033_0304.gif) m. The lattice parameter for STO, BTO and SBTO, calculated from the obtained 2θ values, was found to be 3.90, 4.06 and 3.76 Å, respectively. As can be seen in the inset of Fig. 1a, the reflections for SBTO lie at a 2θ value between those of STO and BTO. It has been shown that the mixed perovskite can either consist of a single solid solution or a biphasic solid solution46 that can be Sr-rich or Ba-rich. In this work, we did not obtain distinct peaks for STO and BTO phases in the XRD pattern. This indicates towards the existence of a single solid solution in SBTO materials.
m. The lattice parameter for STO, BTO and SBTO, calculated from the obtained 2θ values, was found to be 3.90, 4.06 and 3.76 Å, respectively. As can be seen in the inset of Fig. 1a, the reflections for SBTO lie at a 2θ value between those of STO and BTO. It has been shown that the mixed perovskite can either consist of a single solid solution or a biphasic solid solution46 that can be Sr-rich or Ba-rich. In this work, we did not obtain distinct peaks for STO and BTO phases in the XRD pattern. This indicates towards the existence of a single solid solution in SBTO materials.
The XRD patterns of SBTO obtained by changing the parameters of the hydrothermal reaction are shown in Fig. S1.† The observations suggest that even at lower temperatures and lower reaction times, there is no splitting in the peaks. This observation indicates towards the formation of a solid solution in every case. But a clear shift in the peaks is observed by changing the temperature and time of the hydrothermal reaction. This might mean that the incorporation of Ba into SrTiO3 changes with the parameters of the reaction. The reflections for SBTO synthesized at 240 °C for 24 h are observed exactly in between the corresponding reflections of BTO and STO.
The XRD patterns of materials obtained after NaBH4 treatment, RSTO, RBTO and RSBTO, are shown in Fig. 1b. There is no change in the peak positions, and we do not observe any extra peaks compared to the as-prepared materials. There is no detectable change in the lattice parameters and peak broadening of all the three materials after reduction. This suggests that the composition, crystal structure and crystallinity remain intact after the heavy reduction treatment.
3.2 Microstructural analysis
Fig. 2a, c and e show the bright field (BF) images of the as-synthesized support materials, STO, BTO and SBTO, respectively. The morphology of STO appears like distorted cuboids and the selected area electron diffraction (SAED) pattern recorded on the [001] zone axis for the cubic perovskite structure is shown in Fig. 2b. The BTO sample, on the other hand, can be observed as having more distinct cuboidal shapes with rounded corners compared to STO. The BTO cuboids also possess a cubic structure as seen in the SAED pattern (Fig. 2d). The mixed perovskite (SBTO) synthesized by varying the reaction parameters possessed different intermediate morphologies. Fig. S2 (ESI†) shows that at lower temperatures and less reaction time, SBTO appears as tight aggregates. SBTO synthesized at 240 °C for 24 h shows cuboid structures (Fig. S2e†) like BTO with a slightly rough and deformed surface like STO. The SAED pattern (Fig. 2f) of a single cuboid of SBTO shows a cubic pattern like BTO and STO. The d-spacings corresponding to the 110 planes of STO, BTO and SBTO were measured to be 2.76, 2.82 and 2.79 Å, respectively.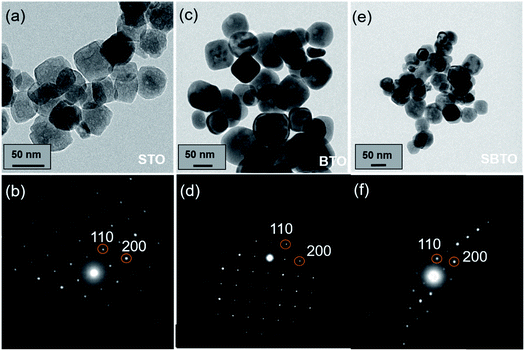 | ||
| Fig. 2 TEM bright field images of the as-prepared (a) STO, (c) BTO and (e) SBTO. The SAED patterns of (b) STO, (d) BTO and (f) SBTO on the [001] zone axis. | ||
It is reported that BaTiO3 and SrTiO3 exhibit complete solid solubility in the phase diagram.45 The XRD patterns obtained for SBTO materials suggest it to be a single solid solution. A very small difference in the d-spacings and 2θ values for the three materials gives room for error in the measurements. We carry out other characterization studies to reinforce the existence of a solid solution. To obtain the composition of SBTO, STEM-EDS mapping was done in various regions in the sample. The quantitative data from EDS maps confirm the presence of Ba and Sr in a 1![[thin space (1/6-em)]](https://www.rsc.org/images/entities/char_2009.gif) :
:![[thin space (1/6-em)]](https://www.rsc.org/images/entities/char_2009.gif) 1 ratio. The STEM-EDS maps are shown in Fig. 3. Ba-rich or Sr-rich region could not be observed in the maps, confirming the formation of a single solid solution of Sr0.5Ba0.5TiO3.
1 ratio. The STEM-EDS maps are shown in Fig. 3. Ba-rich or Sr-rich region could not be observed in the maps, confirming the formation of a single solid solution of Sr0.5Ba0.5TiO3.
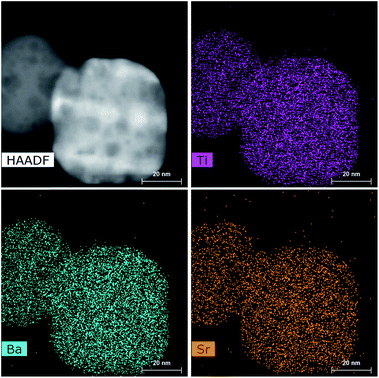 | ||
Fig. 3 STEM-EDS elemental maps showing the presence of Ti, Sr and Ba in the individual nano-cuboids. The quantitative estimation from STEM-EDS suggests Sr![[thin space (1/6-em)]](https://www.rsc.org/images/entities/char_2009.gif) : :![[thin space (1/6-em)]](https://www.rsc.org/images/entities/char_2009.gif) Ba = 1 Ba = 1![[thin space (1/6-em)]](https://www.rsc.org/images/entities/char_2009.gif) : :![[thin space (1/6-em)]](https://www.rsc.org/images/entities/char_2009.gif) 1. 1. | ||
Fig. S3† discusses the changes in morphology and structure of STO, BTO and SBTO after the reduction treatment. As shown in Fig. S3a,† the RSTO cuboids appear to be distorted and agglomerated compared to the STO sample. There is a pronounced presence of void-like structures all over the cuboid, which give them a porous appearance. The HRTEM image shown in Fig. S3b† highlights the presence of the voids and 110 planes of STO. Fig. S3c† shows the RBTO cuboids with the presence of voids. The voids in this case are less in number but more aggregated towards the center of the structure and not on the edges. The cuboids in the RBTO sample appear smooth on the surface like BTO cuboids. The HRTEM image in Fig. S3d† shows the edge of a cuboid of RBTO showing the resolved fringes and spacing corresponding to the (110) planes of BTO. In the case of RSBTO (Fig. S3e†), the cuboids maintain their shape and the surface is smooth. The voids are present all over the cuboidal structures, but lower in number compared to RSTO and more than those of RBTO. The HRTEM image shown in Fig. 4f shows the resolved fringes corresponding to the (110) planes of SBTO. The specific surface areas of all the materials were determined by Brunauer–Emmett–Teller (BET) measurements and are provided in Table S1 (ESI†).
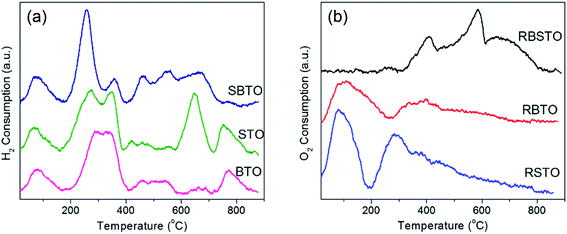 | ||
| Fig. 4 (a) H2-TPR over the as-prepared STO, BTO and SBTO; (b) TPO profiles of reduced supports i.e. RSTO, RBTO and RSBTO. | ||
3.3 H2-temperature programmed reduction
To analyze the extent of reduction in the as-prepared STO, BTO and SBTO, temperature programmed reduction (TPR) was performed in the same H2 flow over 50 mg of the material. The signal corresponding to H2 consumption is plotted against temperature and shown in Fig. 4a. It can be observed in the TPR profiles that reduction/H2 adsorption over the supports takes place in the entire temperature range. The areas were calculated from the normalized plots as 4765, 4601 and 3224 for STO, SBTO and BTO, respectively. The area under the peaks is directly related to the amount of H2 adsorbed/consumed by the material. The TPR plots suggest that the oxide supports follow the order of reduction SBTO > STO > BTO. The colours of the materials recovered after H2-TPR changed from white to light grey. Interestingly, these materials visually appear very differently coloured after H2-TPR and after NaBH4 reduction, suggesting a change in the degree of reduction by both the treatments.3.4 Temperature programmed oxidation
The difference in the oxygen storage capacity of the NaBH4 reduced supports (RSTO, RSBTO and RBTO) can be relatively measured using temperature programmed oxidation (TPO). As shown in Fig. 4b, the oxygen taken up by the material is plotted as the signal against temperature. The amount of oxygen vacancies created in the material after reduction is directly proportional to the area of the curve.47 Compared to RSTO, the RBTO sample shows less O2 consumption until 600 °C. This suggests that STO on being reduced to RSTO tends to generate more oxygen vacancies in the structure compared to RBTO. The overall highest O2 consumption among the reduced supports could be measured for the RSBTO sample. This observation suggests that RSBTO has the highest capacity to carry oxygen. The order of O2 consumption on the reduced supports is found to be RSBTO > RSTO > RBTO. The materials recovered after TPO experiments were white in colour.3.5 CO oxidation studies
The differences observed in the redox behaviour of the as-prepared and reduced supports are tested for its manifestation in CO oxidation. CO oxidation was performed over the bare oxides, STO, BTO and SBTO, and the profiles are shown in Fig. 5a. It can be observed that STO and SBTO convert CO completely at almost similar temperatures (∼490 °C). Over BTO, on the other hand, CO is fully converted to CO2 at a relatively higher temperature. Mostly, the mechanism of CO oxidation followed over bare supports is the Eley–Rideal mechanism,48 where un-adsorbed CO reacts with the O2 dissociated on the catalyst surface. Considering this, as observed from the CO oxidation profiles, BTO interacts with less oxygen from the feed, resulting in delayed full conversion of CO.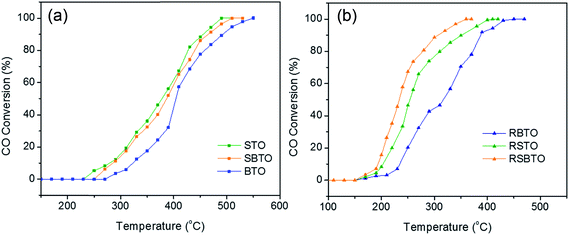 | ||
| Fig. 5 Light-off curves showing CO oxidation activities over (a) STO, BTO and SBTO and over (b) RSTO, RBTO and RSBTO. | ||
Similar CO oxidation experiments were performed over NaBH4-reduced supports, viz. RSTO, RSBTO and RBTO. Interestingly, the temperature of full conversion (Fig. 5b) shifted to a much lower value over all the reduced supports. Assuming the operation of the Eley–Rideal mechanism, this striking enhancement in activity on the reduced supports might be attributed to their enhanced interaction with oxygen from the feed. The presence of oxygen vacancies in the structure after NaBH4 reduction is most likely the reason for this enhanced interaction. Fig. 5b also shows that RSBTO converts CO completely at a significantly lower temperature compared to RSTO and RBTO. This observation is supported by the temperature programmed oxidation (TPO) plots shown in Fig. 6b where the amount of O2 consumed by the RSBTO sample is greater than that consumed by the other two samples. The fact that RBTO is the least active in oxygen consumption and CO oxidation indicates that the tendency to form oxygen vacancies in BTO is the least compared to STO and SBTO. Intuitively, the CO oxidation activity and the oxidation capacity of the mixed oxide (RSBTO) should lie between those of RBTO and RSTO. It is intriguing to observe RSBTO showing better activity and oxidation capacity compared to RSTO.
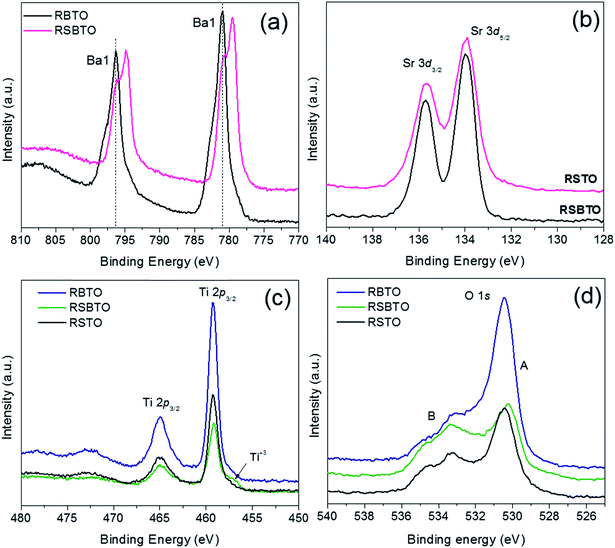 | ||
| Fig. 6 XPS spectra comparing (a) Ba 3d spectra of RBTO and RSBTO, (b) Sr 3d spectra of RSTO and RSBTO, and (c and d) Ti 2p and O 1s spectra of RSTO, RBTO and RSBTO. | ||
3.6 DRS spectroscopy
To obtain qualitative information about the contribution of surface and sub-surface defects in the structures to the bandgap states, DRS was performed. The transformed Kubelka–Munk function is plotted against hυ to obtain the graphs shown in Fig. S4.† Through these Tauc plots, the difference in the absorption of the as-prepared oxides and their reduced versions is discussed. As shown in Fig. S4a–c,† the band gap energy49 is measured by extrapolating the linear region in the as-prepared STO, BTO and SBTO. In the case of the reduced materials, RSTO, RBTO and RSBTO, a reduction in the band gap is observed in the Tauc plots (Fig. S4a–c†). A large tail called the ‘Urbach tail’ which is known to contribute to sub-bandgap absorption49 is observed in Fig. S5c.† The presence of this tail in the DRS spectrum reflects the existence of disorder/defects such as oxygen vacancies.50 This observation is similar to that obtained in the literature,51 where such a tailing in the plot is explained by the presence of oxygen vacancies and defects in the TiO2 structure. The additional presence of the Urbach tail in the reduced samples clearly suggests that the surface structure has been modified by the reduction treatment, leading to structures with more defects.3.7 XPS analysis
To understand the reason behind the better CO oxidation activity over RSBTO, a detailed XPS analysis was done to compare the chemical states of all the elements. Fig. S5† shows a panel comparing XPS spectra of the as-prepared supports, STO, BTO and SBTO. In Fig. S5a,† the Ba 3d doublet at 796 and 781 eV corresponds to Ba atoms in the perovskite lattice.52 Surprisingly, the Ba 3d peak shapes in BTO and SBTO are identical. This would mean that there is no change in the chemical state of Ba in SBTO which could be detected by XPS. In Fig. S5b,† the peaks at 132.7 and 134.5 eV correspond to Sr 3d5/2 and Sr 3d3/2, respectively.The two peaks in the Sr 3d spectra of STO and SBTO are identical and correspond to Sr atoms in the perovskite structure. Fig. S5c and d† show the Ti 2p and O 1s spectra of STO, BTO and SBTO. The two peaks at 565 and 558 eV correspond to Ti 2p1/2 and Ti 2p3/2 of Ti atoms in +4 states, respectively. There is no detectable change in the features of the peaks and hence, it can be assumed that there is no difference in the chemical states of Ti and O on the surface of the materials. The important observation from this study is that the chemical states of Ba are similar in BTO and SBTO and similarly, Sr exists in the same oxidation state in STO and SBTO.
XPS spectra of the reduced supports, RSTO, RBTO and RSBTO, are compared in the panel in Fig. 6. The Ba 3d spectra from RBTO and RSBTO are compared in Fig. 6a. A striking peak splitting can be observed in the Ba 3d spectra of RSBTO, which is absent in the case of RBTO. This suggests that Ba in RSBTO exists in two chemical states in the structure. To understand this difference, the deconvoluted Ba 3d spectra of SBTO and RSBTO are shown in Fig. S6a and b,† respectively. Considering the main Ba 3d peaks for the perovskite structure at 796 and 781 eV as the ‘Ba1’ type, there is a significant presence of peaks at lower binding energies (Ba2) in RSBTO53 (Fig. S6b†). The presence of such peaks was observed in a few cases in the literature.54 Initially the extra peaks were assumed to exist because of Ba atoms in the decomposed BaCO3 layer on the surface of BaTiO3 films.54 Further study of the problem using FTIR ruled out the idea of the presence of carbonates due to the absence of signals corresponding to carbonate species.55 The presence of these extra peaks in our case might correspond to Ba atoms in a different chemical environment upon NaBH4 reduction of SBTO. This might be due to strain in the structure because of a higher number of oxygen vacancies. The reduced intensity (Fig. S6a†) of such a Ba 3d peak splitting in SBTO might suggest that after NaBH4 reduction, SBTO is changed near the surface. In this relaxed environment, the Ba atoms might be present in different chemical environments compared to those in SBTO.54
The Sr 3d spectra of RSTO and RSBTO do not show any difference in the peak shapes (Fig. 6b). This would mean that any change in the chemical states of Sr was not detected. The Ti 2p spectra (Fig. 6c) for all the reduced supports were found to be identical in shape. The presence of a small feature at lower binding energy in the Ti 2p3/2 spectra of RSBTO could be observed. This might correspond to the presence of Ti atoms in +3 oxidation states.13,56 It is to be noted that the presence of Ti3+ might also be one of the reasons of RSBTO having a structure with more oxygen vacancies. The O 1s spectra of the reduced supports are compared in Fig. 6d. The peak at a lower binding energy of 530 eV corresponds to oxygen vacancies or chemisorbed species. In Fig. 6d, there is a difference in the ratio of these two peaks at lower (A) and higher (B) binding energies. The O 1s spectra of RSBTO shows that the A/B ratio is the smallest compared to RSTO and RBTO. This is a clear indication of increased oxygen vacancies in the mixed oxide, making it more susceptible to oxidation as seen in TPO and CO oxidation results.
3.8 Pt-decorated supports
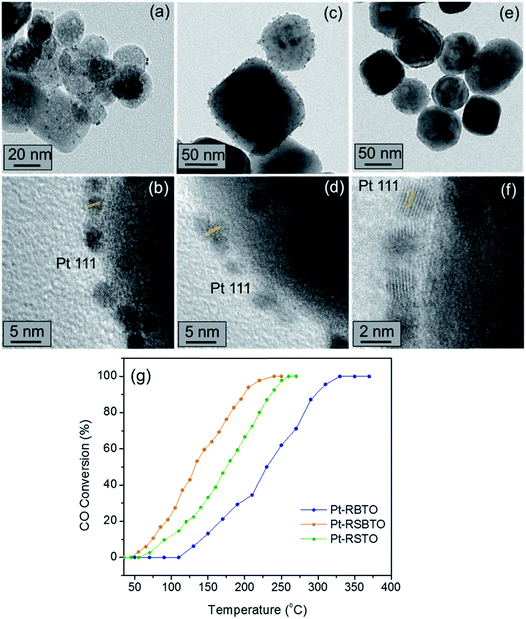
Once established that the reduced supports show enhanced CO oxidation activities compared to the as-prepared oxides, we employ the former materials as the active support for Pt metal catalysts. Ultra-fine Pt nanoparticles are decorated on the reduced supports, RSTO, RBTO and RSBTO, using a facile microwave synthesis as explained in Section 2. Fig. 7a, c and e show bright field TEM images of Pt-decorated RSTO (Pt-RSTO), RBTO (Pt-RBTO) and RSBTO (Pt-RSBTO), respectively. The HRTEM images showing the 111 planes resolved for the Pt nanoparticles are shown below their corresponding BF images. These Pt-decorated catalysts were further tested for their activities in CO oxidation. As observed in Fig. 7g, the Pt-RSBTO catalyst shows better activity than the other two catalysts. The temperature of full conversion of CO is observed to be ∼170 °C over Pt-RSBTO. On the other hand, T100 was observed as 230 °C and 320 °C over Pt-RSTO and Pt-RBTO, respectively.Considering Δ as the difference of T100 over Pt-X (Pt-RSTO, Pt-RBTO and Pt-RSBTO) and X (RSTO, RBTO and RSBTO), we observed the following:
| ΔX=RSTO = 170 °C, ΔX=RSBTO = 180 °C and ΔX=RBTO = 100 °C. |
It is an interesting to observe the reversal of activity and OSC of STO and SBTO upon reduction with NaBH4. A striking presence of an additional Ba 3d peak at lower binding energies in the XPS spectra indicates a deviation in the chemical environment of Ba in RSBTO. This signal was very small in the case of SBTO and absent in the Ba 3d spectra of BTO and RBTO. This would mean that after reducing SBTO, the chemical environment around the Ba atom might be changing, resulting in a split peak in the Ba 3d spectra. Moreover, the presence of a shoulder of Ti3+ was observed in the Ti 2p spectra of RSBTO, which was absent in RBTO, BTO and SBTO. Apart from these changes, the absorption spectra of RSBTO shows an Urbach tail corresponding to a lower band gap value along with the indirect band gap obtained by extrapolating the linear region. This generally indicates the presence of oxygen vacancies/defects in the structure. The findings from the above experiments suggest that the enhancement of CO oxidation activity over RSBTO is indeed a result of generation of greater number of oxygen vacancies after reduction of Ba-incorporated SrTiO3.
The change in adsorption of CO on the SrTiO3 (100) surface with and without oxygen vacancies has been studied using first-principles calculation based on density functional theory.57,58 There have been a few reports exploring the photocatalytic activity and the effect of the size and morphology of the supported nanoparticle.59–61 Our observation of enhancement of catalytic activity by adding Ba to the SrTiO3 support suggests that it could be an ideal system to obtain interesting insights into the interplay between oxygen vacancies, catalyst pre-treatment and catalytic activity.
4 Conclusion
In summary, we show that a solid-solution of the perovskite Ba–Sr–Ti oxide can act as an efficient catalyst support to disperse Pt nanoparticles. The oxide supports show a trend of increasing activity with decreasing A-site cation size, establishing SrTiO3 as the best performing catalyst. Interestingly, the NaBH4 reduced oxide supports show an alteration of the activity trend rendering the mixed reduced oxide (reduced-Sr0.5Ba0.5TiO3) a better catalyst compared to reduced-SrTiO3. Spectroscopic characterization reveals a striking charge accumulation on Ba, along with the existence of Ti3+, which might be a possible reason for the higher activity of the reduced mixed-oxide supported catalyst. Furthermore, detailed adsorption-based characterization shows that the mixed reduced oxide has a higher O2 uptake capacity, emphasizing the role of heavily reduced Ti states on the surface.Conflicts of interest
There are no conflicts to declare.References
- K. Kiss, J. Magder, M. S. VukaSOVich and R. J. Lockhart, J. Am. Ceram. Soc., 1966, 49, 291–295 CrossRef CAS
.
- G. W. Morey, J. Am. Ceram. Soc., 1953, 36, 279–285 CrossRef CAS
.
- J. Baniecki, R. Laibowitz, T. Shaw, P. Duncombe, D. Neumayer, M. Cope, D. Kotecki, H. Shen and Q. Ma, MRS Online Proc. Libr., 1997, 493 Search PubMed
.
- C. Zhang, Y. Jia, Y. Jing, Y. Yao, J. Ma and J. Sun, Phys. B, 2012, 407, 4649–4654 CrossRef CAS
.
- J. Qiu, Solid State Commun., 2010, 150, 1052–1055 CrossRef CAS
.
- M. McQuarrie, J. Am. Ceram. Soc., 1955, 38, 444–449 CrossRef CAS
.
- G. Wang, Y. Ling and Y. Li, Nanoscale, 2012, 4, 6682–6691 RSC
.
- Y. Lv, Y. Zhu and Y. Zhu, J. Phys. Chem. C, 2013, 117, 18520–18528 CrossRef CAS
.
- A. Walsh, C. R. A. Catlow, A. G. Smith, A. A. Sokol and S. M. Woodley, Phys. Rev. B, 2011, 83, 220301 CrossRef
.
- Z. Hou and K. Terakura, J. Phys. Soc. Jpn., 2010, 79, 114704 CrossRef
.
- N. H. Chan, R. Sharma and D. M. Smyth, J. Electrochem. Soc., 1981, 128, 1762–1769 CrossRef CAS
.
- S. B. Lee, M. Saito and F. Phillipp, Z. Metallkd, 2005, 96, 452–454 CrossRef CAS
.
- M. S. Marshall, A. E. Becerra-Toledo, L. D. Marks and M. R. Castell, Phys. Rev. Lett., 2011, 107, 086102 CrossRef PubMed
.
- K. Eom, E. Choi, M. Choi, S. Han, H. Zhou and J. Lee, J. Phys. Chem. Lett., 2017, 8, 3500–3505 CrossRef CAS PubMed
.
- S. Shetty, S. K. Sinha, R. Ahmad, A. K. Singh, G. Van Tendeloo and N. Ravishankar, Chem. Mater., 2017, 29, 9887–9891 CrossRef CAS
.
- R. Pentcheva and W. E. Pickett, Phys. Rev. B, 2006, 74, 035112 CrossRef
.
- J. P. Buban, H. Iddir and S. Öğüt, Phys. Rev. B, 2004, 69, 180102 CrossRef
.
- H. Tan, Z. Zhao, W.-b. Zhu, E. N. Coker, B. Li, M. Zheng, W. Yu, H. Fan and Z. Sun, ACS Appl. Mater. Interfaces, 2014, 6, 19184–19190 CrossRef CAS PubMed
.
- H. W. Kang, S. N. Lim and S. B. Park, Int. J. Hydrogen Energy, 2012, 37, 5540–5549 CrossRef CAS
.
- S. Ouyang, H. Tong, N. Umezawa, J. Cao, P. Li, Y. Bi, Y. Zhang and J. Ye, J. Am. Chem. Soc., 2012, 134, 1974–1977 CrossRef CAS PubMed
.
- N. Jain, A. Roy and S. Nair, Nanoscale, 2019 10.1039/c9nr07664f
.
- X. Chen, L. Liu, Y. Y. Peter and S. S. Mao, Science, 2011, 1200448 Search PubMed
.
- M. Lohrenscheit and C. Hess, ChemCatChem, 2016, 8, 523–526 CrossRef CAS
.
- K. Ding, A. Gulec, A. M. Johnson, N. M. Schweitzer, G. D. Stucky, L. D. Marks and P. C. Stair, Science, 2015, 350, 189–192 CrossRef CAS PubMed
.
- M. M. Schubert, S. Hackenberg, A. C. Van Veen, M. Muhler, V. Plzak and R. J. Behm, J. Catal., 2001, 197, 113–122 CrossRef CAS
.
- R. Kopelent, J. A. van Bokhoven, J. Szlachetko, J. Edebeli, C. Paun, M. Nachtegaal and O. V. Safonova, Angew. Chem., Int. Ed., 2015, 54, 8728–8731 CrossRef CAS PubMed
.
- H. Y. Kim, H. M. Lee and G. Henkelman, J. Am. Chem. Soc., 2012, 134, 1560–1570 CrossRef CAS PubMed
.
- N. Jain and A. Roy, Mater. Res. Bull., 2020, 121, 110615 CrossRef CAS
.
- Z. R. Tang, C. D. Jones, J. K. Aldridge, T. E. Davies, J. K. Bartley, A. F. Carley, S. H. Taylor, M. Allix, C. Dickinson and M. J. J. C. Rosseinsky, ChemCatChem, 2009, 1, 247–251 CrossRef CAS
.
- Z.-R. Tang, J. K. Edwards, J. K. Bartley, S. H. Taylor, A. F. Carley, A. A. Herzing, C. J. Kiely and G. J. Hutchings, J. Catal., 2007, 249, 208–219 CrossRef CAS
.
- S. Fuentes, R. Zarate, E. Chavez, P. Munoz, D. Díaz-Droguett and P. Leyton, J. Mater. Sci., 2010, 45, 1448–1452 CrossRef CAS
.
- D. M. Tahan, A. Safari and L. C. Klein, J. Am. Ceram. Soc., 1996, 79, 1593–1598 CrossRef CAS
.
- J. Li, D. Jin, L. Zhou and J. Cheng, Mater. Lett., 2012, 76, 100–102 CrossRef CAS
.
- C. Lin and T. Yan, MRS Online Proc. Libr., 1994, 346 Search PubMed
.
- J. Barrel, K. J. MacKenzie, E. Stytsenko and M. Viviani, Mater. Sci. Eng., B, 2009, 161, 125–129 CrossRef CAS
.
- E. B. Slamovich and I. A. Aksay, MRS Online Proc. Libr., 1994, 346 Search PubMed
.
- F. A. Rabuffetti, H.-S. Kim, J. A. Enterkin, Y. Wang, C. H. Lanier, L. D. Marks, K. R. Poeppelmeier and P. C. Stair, Chem. Mater., 2008, 20, 5628–5635 CrossRef CAS
.
- P. Balaya, M. Ahrens, L. Kienle, J. Maier, B. Rahmati, S. B. Lee, W. Sigle, A. Pashkin, C. Kuntscher and M. Dressel, J. Am. Ceram. Soc., 2006, 89, 2804–2811 CAS
.
- Y. Mao, S. Banerjee and S. S. Wong, J. Am. Chem. Soc., 2003, 125, 15718–15719 CrossRef CAS PubMed
.
- D. Crandles, B. Nicholas, C. Dreher, C. Homes, A. McConnell, B. Clayman, W. Gong and J. Greedan, Phys. Rev. B, 1999, 59, 12842 CrossRef CAS
.
- Q. Kang, J. Cao, Y. Zhang, L. Liu, H. Xu and J. Ye, J. Mater. Chem. A, 2013, 1, 5766–5774 RSC
.
- P. Martelli, R. Caputo, A. Remhof, P. Mauron, A. Borgschulte and A. Züttel, J. Phys. Chem. C, 2010, 114, 7173–7177 CrossRef CAS
.
- Z. Zheng, B. Huang, J. Lu, Z. Wang, X. Qin, X. Zhang, Y. Dai and M.-H. Whangbo, Chem. Commun., 2012, 48, 5733–5735 RSC
.
- O. Warschkow, M. Asta, N. Erdman, K. R. Poeppelmeier, D. E. Ellis and L. D. Marks, Surf. Sci., 2004, 573, 446–456 CrossRef CAS
.
- J. Basmajian and R. DeVries, J. Am. Ceram. Soc., 1957, 40, 373–376 CrossRef CAS
.
- R. K. Roeder and E. B. Slamovich, J. Am. Ceram. Soc., 1999, 82, 1665–1675 CrossRef CAS
.
- T. Jin, T. Okuhara, G. J. Mains and J. White, J. Phys. Chem., 1987, 91, 3310–3315 CrossRef CAS
.
- P. Rezaei, M. Rezaei and F. Meshkani, Catal. Commun., 2017, 8, 1167–1171 Search PubMed
.
- C. Yim, C. Pang and G. Thornton, Phys. Rev. Lett., 2010, 104, 036806 CrossRef CAS PubMed
.
- G. Liu, W. Jaegermann, J. He, V. Sundström and L. Sun, J. Phys. Chem. B, 2002, 106, 5814–5819 CrossRef CAS
.
- X. Mao, X. Lang, Z. Wang, Q. Hao, B. Wen, Z. Ren, D. Dai, C. Zhou, L.-M. Liu and X. Yang, J. Phys. Chem. Lett., 2013, 4, 3839–3844 CrossRef CAS
.
- C. Xu, Y. Xia, Z. Liu and X. Meng, J. Phys. D: Appl. Phys., 2009, 42, 085302 CrossRef
.
- C. Miot, E. Husson, C. Proust, R. Erre and J. Coutures, J. Mater. Res., 1997, 12, 2388–2392 CrossRef CAS
.
- V. Craciun and R. Singh, Appl. Phys. Lett., 2000, 76, 1932–1934 CrossRef CAS
.
- T. Shaw, Z. Suo, M. Huang, E. Liniger, R. Laibowitz and J. Baniecki, Appl. Phys. Lett., 1999, 75, 2129–2131 CrossRef CAS
.
- M. Oku, K. Wagatsuma and S. Kohiki, Phys. Chem. Chem. Phys., 1999, 1, 5327–5331 RSC
.
- Y. Jiang-Ni, Z. Zhi-Yong, Y. Jun-Feng and Z. Fu-Chun, Chin. Phys. Lett., 2010, 27, 017101 CrossRef
.
- S. F. Yuk and A. Asthagiri, J. Chem. Phys., 2015, 142, 124704 CrossRef PubMed
.
- B.-R. Chen, L. A. Crosby, C. George, R. M. Kennedy, N. M. Schweitzer, J. Wen, R. P. Van Duyne, P. C. Stair, K. R. Poeppelmeier, L. D. Marks and M. J. Bedzyk, ACS Catal., 2018, 8, 4751–4760 CrossRef CAS
.
- H. Tan, Z. Zhao, W.-b. Zhu, E. N. Coker, B. Li, M. Zheng, W. Yu, H. Fan and Z. J. Sun, ACS Appl. Mater. Interfaces, 2014, 6, 19184–19190 CrossRef CAS PubMed
.
- M. Miyauchi, A. Nakajima, A. Fujishima, K. Hashimoto and T. Watanabe, Chem. Mater., 2000, 12, 3–5 CrossRef CAS
.
Footnote |
| † Electronic supplementary information (ESI) available. See DOI: 10.1039/c9na00540d |
| This journal is © The Royal Society of Chemistry 2019 |

