
 Open Access Article
 This Open Access Article is licensed under a Creative Commons Attribution-Non Commercial 3.0 Unported Licence
ITO@SiO2 and ITO@{M6Br12}@SiO2 (M = Nb, Ta) nanocomposite films for ultraviolet-near infrared shielding†
Wanghui
Chen
 abd,
Thi Kim Ngan
Nguyen
abd,
Maxence
Wilmet
ac,
Noée
Dumait
c,
Ourania
Makrygenni
abd,
Yoshio
Matsui
d,
Toshiaki
Takei
e,
Stéphane
Cordier
c,
Naoki
Ohashi
ad,
Tetsuo
Uchikoshi
abd and
Fabien
Grasset
*ad
abd,
Thi Kim Ngan
Nguyen
abd,
Maxence
Wilmet
ac,
Noée
Dumait
c,
Ourania
Makrygenni
abd,
Yoshio
Matsui
d,
Toshiaki
Takei
e,
Stéphane
Cordier
c,
Naoki
Ohashi
ad,
Tetsuo
Uchikoshi
abd and
Fabien
Grasset
*ad
aCNRS-Saint Gobain-NIMS, UMI3629, Laboratory for Innovative Key Materials and Structures (LINK), National Institute for Materials Science (NIMS), 1-1 Namiki, Tsukuba, Ibaraki 305-0044, Japan. E-mail: fabien.grasset@univ-rennes1.fr
bFine Particles Engineering Group, Research Center for Functional Materials (RCFM), NIMS, 1-2-1 Sengen, Tsukuba, Ibaraki 305-0047, Japan
cUniv. Rennes, CNRS, ISCR – UMR6226, 263 av. du Général Leclerc, 35042 Rennes, France
dRCFM, NIMS, 1-1 Namiki, Tsukuba, Ibaraki 305-0044, Japan
eResearch Center for Materials Nanoarchitectonics (MANA), NIMS, 1-1 Namiki, Tsukuba, Ibaraki 305-0044, Japan
First published on 7th August 2019
Abstract
Transparent optical thin films for energy saving applications have recently gained substantial prominence for functional window processes. In this study, highly visible transparent nanocomposite films with ultraviolet (UV) and near-infrared (NIR) blocking capabilities are reported. Such nanocomposite films, prepared by electrophoretic deposition on ITO-coated glass, are composed of indium tin oxide (ITO) nanocrystals (9 nm) and octahedral metal atom clusters (1 nm, Nb6 or Ta6) embedded into silica nanoparticles (∼80 nm). The functional silica nanoparticles were prepared by a reverse microemulsion process. The microstructural characterization proved that ITO nanocrystals are centered in the silica nanoparticles, whereas the metal atom clusters are homogeneously distributed in the silica matrix. The optical absorption spectra of these transparent nanocomposite films exhibit distinct and complementary contributions from their ITO nanoparticles and metal atom clusters (absorption in the UV range) and from the ITO layer on silica.
1 Introduction
The development of functional coatings for window applications using metal, oxide or sulfide nanoparticles (NPs) with localized surface plasmon resonance (LSPR) frequencies in the near-infrared region (NIR) has attracted great attention. This increased interest is due to their strong potential towards energy saving applications by blocking NIR radiation.1–11 In the family of common LSPR oxide materials (CdO, ZnO, In2O3, and WO3−x), Sn:In2O3, indium tin oxide (ITO), appears to be a promising candidate for functional coating on glasses, owing to its LSPR properties. Furthermore, these properties correspond with the most energetic NIR radiation, responsible for heating.12,13 Indeed, the average solar energy distribution on the Earth's surface (after absorption through the atmosphere) is composed of approximately 5% UV radiation (290–380 nm), 46% visible radiation (380–780 nm) and approximately 49% NIR radiation (780–2500 nm). Regarding the absorption process, O3 is responsible for the total radiation absorption below 290 nm, while CO2 and H2O vapor mainly absorb the thermal infrared radiation, with impacts on the Earth's temperature. Thus, almost half of the solar energy comes from infrared radiation, particularly from the highest thermal energy region (780 to 1100 nm).14–16 Despite the abundant availability of commercial ITO-coated glasses in the market, besides the commonly used sputtering process using an ITO target and Ar ion beam, their fabrication routes are limited.17,18 Currently solution-based processes are highly desirable for reducing the cost of these materials and as a viable alternative to the sputtering process for the synthesis of ITO NPs and ITO nano inks.19–22 In parallel, our group has recently proposed the use of transition metal nanoclusters as UV-NIR blocking building blocks. In this regard, they were successfully tested for the development of nanocomposite coatings by electrophoretic deposition (EPD).23 The fabricated coatings were found to be highly transparent in the visible range, with tunable UV and NIR absorption properties. Indeed, octahedral M6 nanoclusters (M = Nb, Mo or Ta) demonstrated promising optical properties for energy saving applications.24–27In this new study, we design multifunctional silica nanocomposite thin films obtained by the combination of the complementary LSPR properties found on ITO NPs with the UV-NIR absorption properties of Nb6 or Ta6 octahedral nanoclusters. Silica NPs of ITO@M6@SiO2 (M = Nb or Ta) were synthesized by a reverse microemulsion (RM) process, and then transparent thin films were fabricated by deposition of the NPs by EPD. It must be noted that both these processes were developed by our groups.28,29 The synthesis of hydrophilic ITO NPs by a solvothermal method, the synthesis of functional SiO2 NPs by the microemulsion process, and the fabrication of thin films and the optical properties of these nanocomposite NPs and thin films are elucidated in this paper. Herein, for the first time, we report on the fabrication of UV-NIR protective transparent silica nanocomposite films. These films allow the absorption of the most energetic UV (330–380 nm) and NIR radiation (780–1100 nm) due to the presence of M6 nanoclusters and the selectivity of the least energetic NIR radiation (1200–2500 nm) due to ITO.
2 Materials and methods
2.1 Materials
InCl3·4H2O, SnCl4·5H2O, ethanol (Ethanol, 99.5%), ethylene glycol (EG), ammonia solution (28%) and tetraethyl orthosilicate (TEOS, 95%) were purchased from Wako Pure Chemical Industries. n-Heptane (98%) was purchased from Kanto Chemical Co. The nonionic surfactant Brij L4, PVP K30, and 25 wt% tetramethylammonium hydroxide (TMAH) in methanol were purchased from Sigma-Aldrich. DI water was purchased from Yamato Kagaku Co. All the chemicals were used as received without further purification.2.2 Preparation of nanoparticles
In this study, as previously reported, solvothermal and sol–gel methods were used to synthesize the ITO NPs.20 The starting compounds Ta6Br14(H2O)4·3H2O (TBH) and K4Nb6Br18 (KNB) were synthesized according to a procedure that was previously published.30,31 The experimental conditions for the microemulsion process were adapted from our previous work.32 The experimental conditions for all these compounds are reported in the ESI.†2.3 Preparation of thin films
Regarding the films, the as-synthesized ITO@M6@SiO2 NPs were dispersed into acetone at different concentrations (0.8 to 2.5 g L−1) followed by ultrasonication prior to their deposition by EPD. The zeta potential and electric conductivity of the suspensions were measured using a zeta-potential analyzer (Malvern Instrument, Ltd., Zetasizer Nano Z). ITO-coated glass (Geomatec Co., Ltd (Japan), 6–8 Ohm sq−1) was washed with distilled water and acetone under ultrasonication. Then, it was connected to a Keithley Model 2400 Series SourceMeter and used as the anodic substrate, and a stainless-steel sheet was used as the cathodic counter electrode. Different tests were carried out by varying the applied voltage from 10 to 30 V and the deposition time from 20 to 90 s. The nanocomposite coated glasses were allowed to dry at room temperature overnight prior to their characterization.2.4 Characterization methods and techniques
Several complementary techniques were used for the characterization of the powders and thin film microstructure. Field emission-scanning electron microscopy (FE-SEM) images were obtained using a JEOL JSM 6301F microscope operating at 7 kV. High resolution TEM images, high angle annular dark field scanning transmission electron microscopy (HAADF-STEM) images and energy-dispersive (EDX) spectra/maps were acquired by using a high resolution transmission electron microscope (HRTEM), JEM-2100F (JEOL Co.), equipped with an EDX detector. Powder X-ray diffraction (XRD) patterns were acquired using a D/MAX Ultima III (Rigaku Co.) diffractometer using Cu Kα radiation (λ = 1.5418 Å) over a range of 20° < 2θ < 90°. Diffuse reflectance UV-Vis-NIR and direct transmission spectra were collected using an integrating sphere equipped with a V-7200 spectrometer (Jasco Co.). Dynamic light scattering (DLS) measurements for measuring the particle size distribution in solution were performed on an Osaka zeta-sizer.3 Results and discussion
Fig. 1a shows the general morphology of the obtained ITO NPs. As can be seen, the ITO NPs have a size centered around 9 nm with a quite narrow size distribution (the size distribution estimated by TEM is reported in the ESI, Fig. S1†). The high magnification HRTEM image (Fig. 1b) and the observed lattice pattern demonstrate the high crystallinity of the ITO NPs. The XRD pattern indicates the single crystalline phase of the ITO NPs (Fig. 1c), as all the diffraction peaks can be indexed to the standard pattern of In2O3 (PDF #65-3170)—the doping of Sn4+ in the lattice of In2O3 gives rise to a small shift towards high angles for all the diffraction peaks.33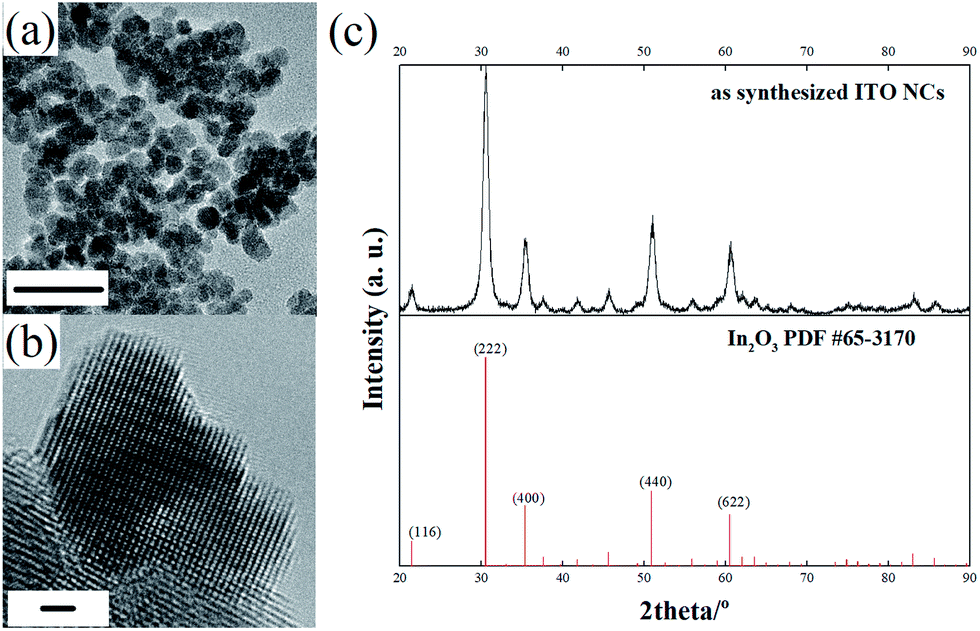 | ||
| Fig. 1 TEM (scale bar: 20 nm) (a) and HRTEM (scale bar: 1 nm) (b) images of the as-synthesized ITO NPs; (c) comparison of the XRD pattern of ITO NPs with the standard diffraction pattern of In2O3. | ||
The obtained ITO NPs could be easily dispersed in water owing to their hydrophilic surface (see the ESI, Fig. S2†).20 Nevertheless, in order to ensure the integration of only one or two ITO NPs per inverse micelle, the NPs had to be fully dispersed in the water phase, i.e. no aggregates of ITO NPs were allowed. The dependence of the as-synthesized ITO NP dispersion in water on the pH was investigated with DLS measurements. As shown in Fig. 2a and b, when the pH of the solution is around ∼9.7, the ITO NPs reach their highest average hydrodynamic diameter (294 nm) with a relatively wide size distribution. Increasing or decreasing the pH has an impact on the dispersion of ITO NPs in water, in terms of both the average hydrodynamic diameter and distribution. ITO NPs are found to have an average hydrodynamic diameter of 59 nm and 38 nm for pH values of ∼2 and ∼12.5, respectively. This behavior is fully consistent with the isoelectric point value of In2O3 NPs with a similar size in water media, i.e. pH = 9.2.34
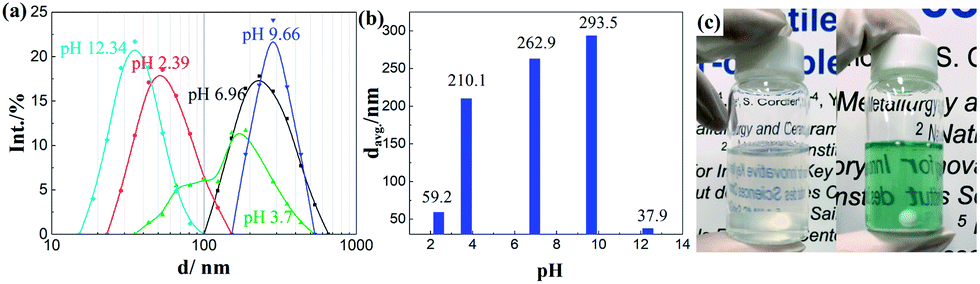 | ||
| Fig. 2 (a) Hydrodynamic size distribution versus intensity (from DLS measurement) of ITO NPs in water by varying the pH; (b) plots of the average hydrodynamic diameter of ITO NPs versus the pH in solution; (c) digital photographs of the RM system containing ITO NPs and ITO@Ta6 NPs. | ||
For RM-based synthesis, a diluted ammonia solution with a pH equal to 12.5 was selected for the dispersion of ITO NPs, based on the following two considerations: (1) at this pH value, the ITO NPs attained the best dispersion combined with a decreased average hydrodynamic diameter and (2) a basic pH is one of the prerequisites for the successful formation of SiO2 from alkoxide in the RM system.35,36 Indeed, the diffusion of the alkoxide into the water droplets promotes its hydrolysis and condensation resulting in the formation of the silica network.37
Digital photographs of the RM systems containing ITO NPs (left) and ITO@Ta6 (right) are shown in Fig. 2c, for the sake of comparison. The high transparency of these two RM systems implies their good uniformity and stability regarding the definition of microemulsions from Danielsson and Lindman: “a microemulsion is a system of water, oil and an amphiphile which is a single optically isotropic and thermodynamically stable liquid solution”.38
Fig. 3a shows a typical HAADF-STEM image of ITO@SiO2 NPs, wherein SiO2 and ITO NPs can be easily distinguished according to the difference in contrast. The resulting SiO2 particles had a uniform spherical morphology with an average size of 85 nm (size distribution estimated by TEM is reported in the ESI, Fig. S3†), attributed to the well confined aqueous phase in the RM system. ITO NPs were found in the center of most SiO2 NPs (Fig. 3b). The EDS mapping (Fig. 3c) further validates the core–shell structure of the ITO@SiO2 NPs, as both In and Sn elements are located in the center of each single particle. Such a uniform morphology also demonstrates the good dispersion of the ITO NPs in aqueous solution in the step before the RM-based synthesis.
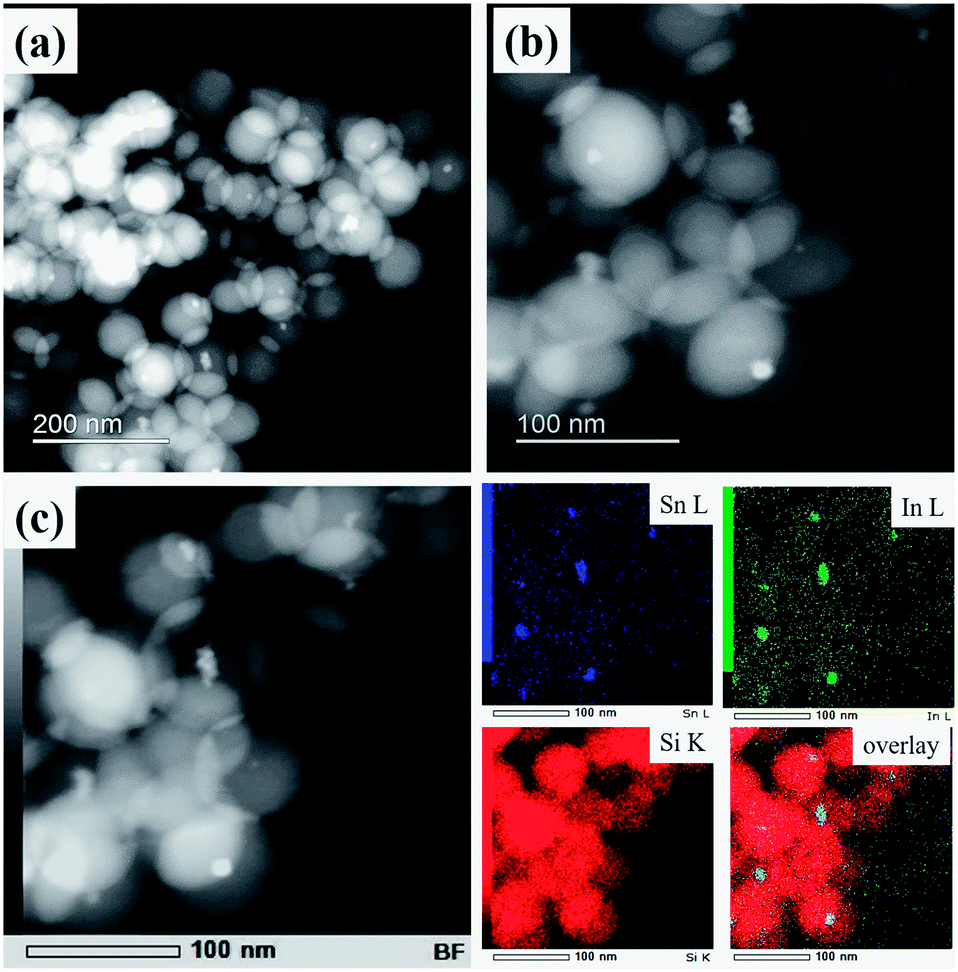 | ||
| Fig. 3 Low (a) and high (b) magnification HAADF-STEM images of ITO@SiO2 NPs; (c) EDS mapping indicating the distribution of Sn L, In L and Si K in ITO@SiO2 NPs. | ||
HAADF-STEM micrographs of the synthesized ITO@M6@SiO2 NPs (M = Nb, Ta) also indicate a similar core–shell structure (results of ITO@Nb6@SiO2 NPs are presented in the ESI, Fig. S4a and b†), with the presence of numerous discrete Ta6 cluster species (Fig. 4a and b). Similar to that of the ITO@SiO2 NPs, the size of ITO@Ta6@SiO2 NPs shows good uniformity, but it slightly decreased to 76 nm on average (size distribution estimated by TEM is reported in the ESI, Fig. S3†). In most cases, ITO NPs were observed at the core of a single ITO@M6@SiO2 nanoparticle, while the presence of M6 cluster species in the shell was validated from the high magnification HAADF-STEM micrograph (ITO@Ta6@SiO2 NPs are presented in Fig. 4b and ITO@Nb6@SiO2 NPs are shown in the ESI, Fig. S4a†). As can be seen, the M6 cluster units are discrete species with a size of 1 nm and they are well dispersed in the whole SiO2 shell, which is in good agreement with a previous study by our group.32 The EDS spectrum in Fig. 4c and d further confirms the successful synthesis of ITO@Ta6@SiO2 NPs, as all the elements (Si, O, In, Sn, Ta, and Br) were detected in a single particle. Similar results were obtained for ITO@Nb6@SiO2 NPs (see the ESI, Fig. S4b†).
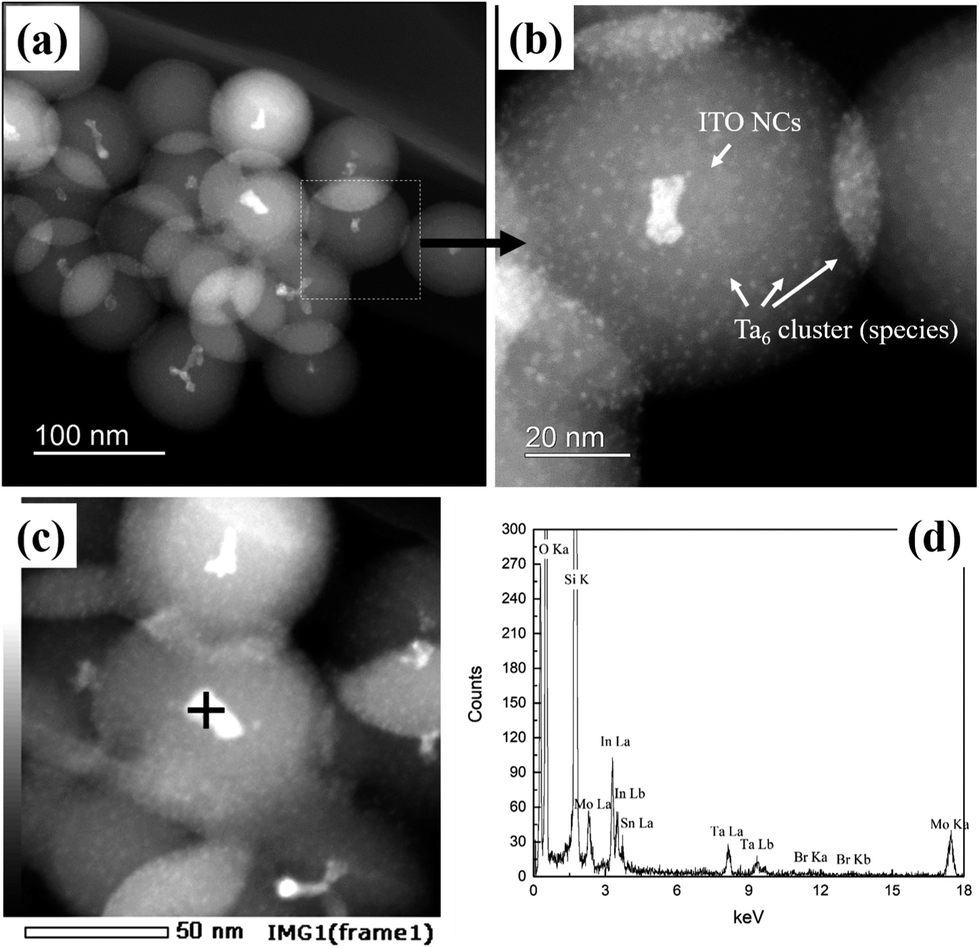 | ||
| Fig. 4 Low (a) and high (b) magnification HAADF-STEM images of ITO@Ta6@SiO2 NPs; (c) STEM image and (d) EDS spectrum (point mode) of ITO@Ta6@SiO2 NPs revealing the co-existence of Si, O, In, Sn, Ta, and Br elements. | ||
It is well known that silica is a material with high transparency in the range of 250 nm to 2000 nm. As seen in Fig. 5, the SiO2 NPs synthesized by the RM method showed almost no absorption in this region.
 | ||
| Fig. 5 Diffuse reflectance UV-Vis-NIR spectra of pure SiO2, ITO@SiO2 and ITO@Ta6@SiO2 NPs containing different concentrations of TBH (from 2 to 6.8 mM). | ||
However their absorption bands at the wavelengths of ∼1400 and 1870 nm were assigned to the OH groups and the surface adhered water molecules. On the other hand, the ITO@SiO2 NPs showed strong absorption in the UV and NIR regions. Firstly, an absorption band can be distinguished at a wavelength below 350 nm.
In the NIR region, absorption bands can be found at wavelengths after 1100 nm and they reach a maximum at 1900 nm. Introducing M6 cluster-based species into the ITO@SiO2 NPs can improve the absorption in these regions. Indeed, as observed in Fig. 5, increasing the concentration of Ta6 cluster provoked an increase in the absorption in all spectral regions. When the concentration of TBH reached a value of 6 mM or higher, three more absorption bands were observed besides those assigned to the ITO NPs. These three peaks, with maxima values of 361, 663 and 850 nm, could be clearly assigned to the absorption of {Ta6Br12}3+ cluster cores.32 A comparison between the absorption spectrum of ITO@SiO2 NPs and that of ITO@Ta6@SiO2 NPs clearly evidences that the latter exhibit the best UV and NIR blocking properties. This distinctly demonstrates that ITO and Ta6 cluster-based units act as complementary functional building blocks, i.e., on one hand they have the LSPR properties of ITO NPs and on the other hand they have the UV-NIR blocking properties of Nb6 or Ta6 octahedral nanoclusters.
The as-synthesized ITO@M6@SiO2 NPs were successfully used for coating on conductive glass by EPD. For the preparation of films based on ITO@M6@SiO2, EPD was performed at 20 V for 20 s by altering the solution concentration. The values of concentration were in the range of 0.8, 1.0 and 2.5 g of NPs per liter.
The zeta potential and the electric conductivity of the ITO@M6@SiO2 suspension in acetone (99.5%) were measured. For instance, the zeta potential and electric conductivity values of the solution with a concentration equal to 2.5 g L−1 are −(22.3 ± 0.6) mV and (19 ± 3) 10−3 mS cm−1, respectively. These results confirm that anodic EPD is effective for the deposition of ITO@M6@SiO2 NPs onto ITO-coated glass. Only the results based on ITO@Nb6@SiO2 NPs are shown in this paper. Similarly, different techniques were used to characterize the films based on ITO@Nb6@SiO2 NPs. The results of these films deposited onto ITO-coated glass are presented below. SEM and UV-Vis-NIR spectroscopy were carried out for the characterization of the morphology and the optical properties. In Fig. 6, the morphology of the films obtained from suspensions with variable concentrations is displayed. As expected, thanks to EPD, the film is composed of a quite dense layer of silica. Nevertheless, the film remained optically transparent in the visible range, as observed in the camera images (Fig. 6), despite the roughness of the surface. The proportional dependence of the film thickness (0.9 to 1.5 microns) on the concentration of the solution is demonstrated in cross sectional SEM images.
 | ||
| Fig. 6 Optical photographs and SEM micrographs, surface morphology and cross sections of ITO@Nb6@SiO2 based films. These films were prepared from solution concentrations equal to 0.8 (a), 1.0 (b), and 2.5 (c, d) g L−1 and deposited by EPD at 20 V for 20 s. | ||
These results were confirmed by UV-Vis-NIR spectroscopy in Fig. 7 showing the decrease in the transparency when the concentration of the solution is increased. Similar results can be obtained by altering the applied voltage or the deposition time (Fig. S5†). As expected, the ITO-coated glass showed high transparency in both UV-A and visible regions. However, the coating with ITO@Nb6@SiO2 NPs had a significant impact on the absorption in the UV and NIR region as reflected by the appearance of a band at 800 nm instead of 1200 nm for the ITO-coated glass. This new absorption band indicates the improvement towards energy saving applications.
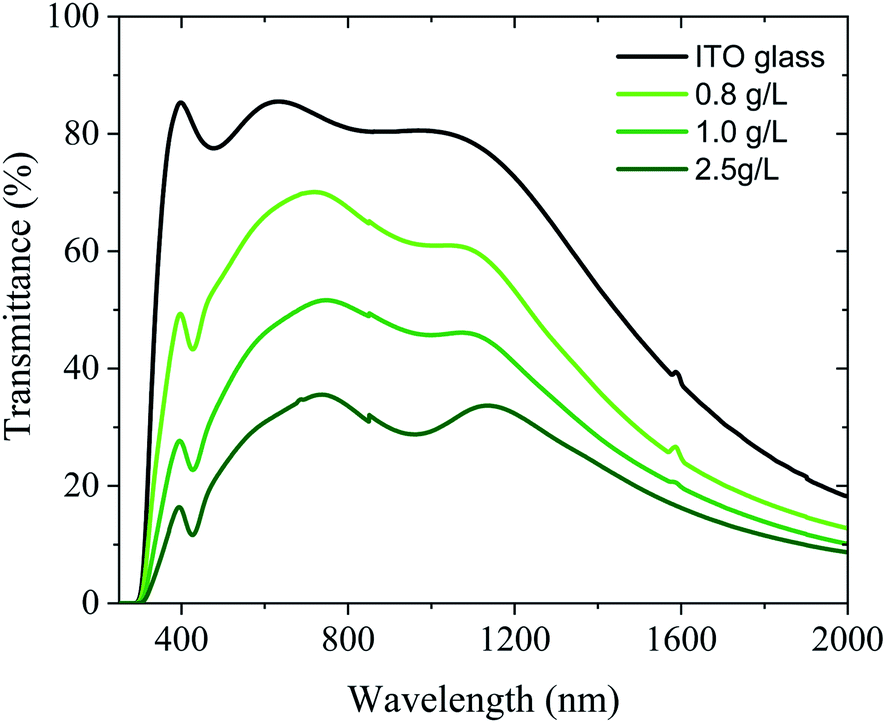 | ||
| Fig. 7 Transmission UV-Vis-NIR spectra of the ITO@Nb6@SiO2 NP based films on the ITO-coated glass by varying the solution concentration (0.8; 1.0; and 2.5 g L−1); the spectrum of the substrate is used as a reference. | ||
Very interestingly, compared to those for pure ITO-coated glass,39 the values of TE are improved by 28% to 66% for the ITO@Nb6@SiO2 films with 0.8 to 2.5 g L−1, respectively (Fig. 8 and Table 1). This reduction markedly manifests the potential of this new nanocomposite coating for energy saving applications. At the same time, when films are fabricated with a solution concentration equal to 0.8 g L−1, the value of the TL remained higher than 60%. This value is perfectly suitable for window applications (Table 1).2,40
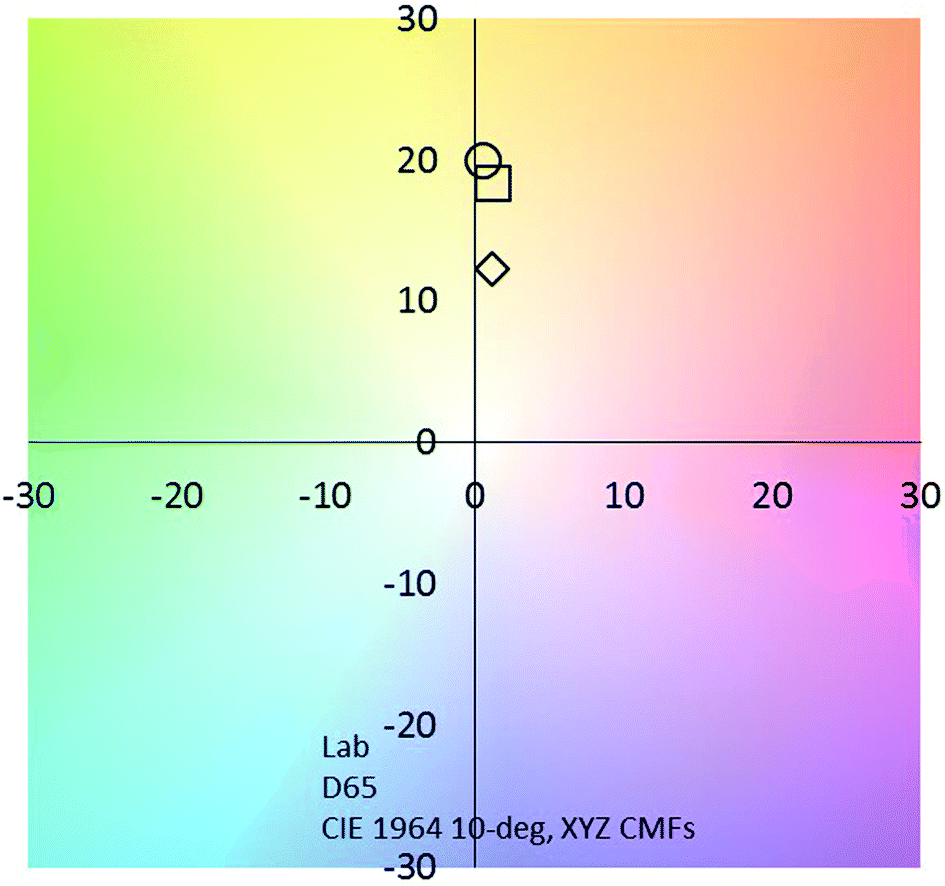 | ||
| Fig. 8 CIE chromaticity coordinates of the ITO@Nb6@SiO2 based films (◊ 0.8 g L−1; □ 1 g L−1; ○ 2.5 g L−1). | ||
| Sample name | L* | a* | b* | T L | T E |
|---|---|---|---|---|---|
| ITO@Nb6@SiO2 20 V 20 s 0.8 g L−1 | 82.470 | 1.167 | 12.314 | 61.8 | 55.6 |
| ITO@Nb6@SiO2 20 V 20 s 1 g L−1 | 70.266 | 1.225 | 18.402 | 41.8 | 39.2 |
| ITO@Nb6@SiO2 20 V 20 s 2.5 g L−1 | 59.196 | 0.542 | 20.067 | 27.8 | 26.4 |
4 Conclusions
In this study, ITO@SiO2 and ITO@M6@SiO2 NPs were successfully synthesized by an RM-based method with a size adequate for transparent coating. The HAADF-STEM and EDS analysis revealed the core–shell structure of these composite nanoparticles and the well-controlled size and uniformity of SiO2 architectures. Herein, the transparent films based on silica nanocomposites, including ITO NPs and M6 clusters, were fabricated by a low-cost EPD solution process for the first time. These films can be potentially used for UV and NIR blocking static applications. Indeed, EPD allowed the fabrication of well controlled films with a thickness of micrometre size, in a very short time (less than 1 min). The UV-Vis-NIR spectra and the values of TL and TE of coated films clearly indicate the UV-NIR blocking properties of these coatings.Conflicts of interest
There is no conflicts to declare.Acknowledgements
The authors wish to thank David Lechevalier and Dr Meng Zhou of Saint-Gobain KK (Tokyo, Japan). This work was carried out as part of the France–Japan international collaboration framework (UMI 3629 LINK).Notes and references
- S. Schelm and G. Smith, Appl. Phys. Lett., 2003, 82, 4346–4348 CrossRef CAS.
- S. Schelm, G. Smith, P. D. Garrett and W. K. Fisher, J. Appl. Phys., 2005, 97, 124314–124318 CrossRef.
- J. E. Song, Y. H. Kim and Y. S. Kang, Curr. Appl. Phys., 2006, 6, 791–795 CrossRef.
- K. Katagiri, R. Takabatake and K. Inumaru, ACS Appl. Mater. Interfaces, 2013, 5, 10240–10245 CrossRef CAS PubMed.
- A. Llordes, G. Garcia, J. Gazquez and D. J. Milliron, Nature, 2013, 500, 323–326 CrossRef CAS PubMed.
- T. M. Mattox, A. Agrawal and D. J. Milliron, Chem. Mater., 2015, 27, 6620–6624 CrossRef CAS.
- C. J. Barile, D. J. Slotcavage and M. D. McGehee, Chem. Mater., 2016, 28, 1439–1445 CrossRef CAS.
- R. W. Johns, H. A. Bechtel, E. L. Runnerstrom, A. Agrawal, S. D. Lounis and D. J. Milliron, Nat. Commun., 2016, 7, 11583 CrossRef CAS PubMed.
- B. H. Kim, C. M. Staller, S. H. Cho, S. Heo, C. E. Garrison, J. Kim and D. J. Milliron, ACS Nano, 2018, 12, 3200–3208 CrossRef CAS PubMed.
- L. V. Besteiro, X. T. Kong, Z. Wang, F. Rosei and A. O. Govorov, Nano Lett., 2018, 18, 3147–3156 CrossRef PubMed.
- M. Kanehara, H. Koike, T. Yoshinaga and T. Teranishi, J. Am. Chem. Soc., 2009, 131, 17736–17737 CrossRef CAS PubMed.
- A. Agrawal, S. H. Cho, O. Zandi, S. Ghosh, R. W. Johns and D. J. Milliron, Chem. Rev., 2018, 118, 3121–3207 CrossRef CAS PubMed.
- Y. T. Kwon, S. H. Ryu, J. W. Shin, W. H. Yeo and Y. H. Choa, ACS Appl. Mater. Interfaces, 2019, 11, 6575–6580 CrossRef CAS PubMed.
- C. G. Granqvist, Thin Solid Films, 2014, 564, 1–38 CrossRef CAS.
- E. Lichtfouse, Sustainable Agriculture Reviews, Springer, 2015 Search PubMed.
- F. Pacheco-Torgal, J. Labrincha, L. Cabeza and C. G. Granqvist, Design, Properties and Applications, Woodhead Publishing, 2015 Search PubMed.
- L. Kerkache, A. Layadi, E. Dogheche and D. Remiens, J. Phys. D: Appl. Phys., 2006, 39, 184–189 CrossRef CAS.
- O. Tuna, Y. Selamet, G. Aygun and L. Ozyuzer, J. Phys. D: Appl. Phys., 2010, 43, 055402–055407 CrossRef.
- Z. Chen, X. Qin, T. Zhou, X. Wu, S. Shao, M. Xie and Z. Cui, J. Mater. Chem. C, 2015, 3, 11464–11470 RSC.
- A. Muramatsu, K. Kanie, T. Sasaki and M. Nakaya, KONA Powder Part. J., 2016, 33, 340–353 CrossRef CAS.
- C. Kim, J. W. Park, J. Kim, S. J. Hong and M. J. Lee, J. Alloys Compd., 2017, g, 712–719 CrossRef.
- S. J. Hong, S. J. Cha and J. Y. Lee, Powder Technol., 2018, 332, 56–62 CrossRef CAS.
- N. T. K. Nguyen, A. Renaud, B. Dierre, B. Bouteille, M. Wilmet, M. Dubernet, N. Ohashi, F. Grasset and T. Uchikoshi, Bull. Chem. Soc. Jpn., 2018, 91, 1763–1774 CrossRef CAS.
- N. T. K. Nguyen, M. Dubernet, Y. Matsui, M. Wilmet, N. Shirahata, G. Rydzek, N. Dumait, M. Amela-Cortes, A. Renaud, S. Cordier, Y. Molard, F. Grasset and T. Uchikoshi, R. Soc. Open Sci., 2019, 6, 181647 CrossRef PubMed.
- T. K. N. Nguyen, A. Renaud, M. Wilmet, N. Dumait, S. Paofai, B. Dierre, W. Chen, N. Ohashi, S. Cordier, F. Grasset and T. Uchikoshi, J. Mater. Chem. C, 2017, 5, 10477–10484 RSC.
- T. K. N. Nguyen, B. Dierre, F. Grasset, A. Renaud, S. Cordier, P. Lemoine, N. Ohashi and T. Uchikoshi, J. Electrochem. Soc., 2017, 164, D412–D418 CrossRef CAS.
- T. K. N. Nguyen, F. Grasset, B. Dierre, C. Matsunaga, S. Cordier, P. Lemoine, N. Ohashi and T. Uchikoshi, ECS J. Solid State Sci. Technol., 2016, 5, R178–R186 CrossRef CAS.
- F. Grasset, F. Dorson, S. Cordier, Y. Molard, C. Perrin, A. M. Marie, T. Sasaki, H. Haneda, Y. Bando and M. Mortier, Adv. Mater., 2008, 20, 143–148 CrossRef CAS.
- Y. Sakka and T. Uchikoshi, KONA Powder Part. J., 2010, 28, 74–90 CrossRef CAS.
- F. W. Koknat, J. A. Parsons and A. Vongvusharintra, Inorg. Chem., 1974, 13, 1699–1702 CrossRef CAS.
- B. G. Hughes, J. L. Meyer, P. B. Fleming and R. E. McCarley, Inorg. Chem., 1970, 9, 1343–1346 CrossRef CAS.
- W. Chen, M. Wilmet, T. G. Truong, N. Dumait, S. Cordier, Y. Matsui, T. Hara, T. Takei, N. Saito, T. K. N. Nguyen, T. Ohsawa, N. Ohashi, T. Uchikoshi and F. Grasset, Heliyon, 2018, 4, e00654 CrossRef PubMed.
- Y. Shen, Y. Lou, Z. Wang and X. Xu, Coatings, 2017, 7(12), 212–218 CrossRef.
- H. Zhang, Z. Ji, T. Xia, H. Meng, C. Low-Kam, R. Liu, S. Pokhrel, S. Lin, X. Wang, Y. P. Liao, M. Wang, L. Li, R. Rallo, R. Damoiseaux, D. Telesca, L. Mädler, Y. Cohen, J. I. Zink and A. E. Nel, ACS Nano, 2012, 6(5), 4349–4368 CrossRef CAS PubMed.
- K. S. Finnie, J. R. Bartlett, C. J. A. Barbé and L. Kong, Langmuir, 2007, 23, 3017–3024 CrossRef CAS PubMed.
- F. Grasset, N. Labhsetwar, D. Li, D. C. Park, N. Saito, H. Haneda, O. Cador, T. Roisnel, S. Mornet, E. Duguet, J. Portier and J. Etourneau, Langmuir, 2002, 18, 8209–8216 CrossRef CAS.
- F. J. Arriagada and K. Osseo-Asare, Colloids Surf., A, 1999, 154, 311–326 CrossRef CAS.
- I. Danielsson and B. Lindman, Colloids Surf., A, 1981, 3, 391–392 CrossRef CAS.
- A. Renaud, M. Wilmet, T. G. Truong, M. Seze, P. Lemoine, N. Dumait, C. Chen, N. Saito, T. Ohsawa, T. Uchikoshi, N. Ohashi, S. Cordier and F. Grasset, J. Mater. Chem. C, 2017, 5, 8160–8168 RSC.
- G. B. Smith, C. A. Deller, P. D. Swift, A. Gentle, P. D. Garrett and W. K. Fisher, J. Nanopart. Res., 2002, 4, 157–165 CrossRef CAS.
Footnote |
| † Electronic supplementary information (ESI) available. See DOI: 10.1039/c9na00400a |
| This journal is © The Royal Society of Chemistry 2019 |