 Open Access Article
Kinetics of electric field induced vertical orientation of halloysite nanotubes in photocurable nanocomposites†
Shuyang
Pan‡
a,
Yuanhao
Guo‡
a,
Yuwei
Chen
ab and
Miko
Cakmak
 *ac
*ac
aDepartment of Polymer Engineering, University of Akron, Akron, Ohio 44325, USA. E-mail: cakmak@purdue.edu
bKey Laboratory of Rubber-Plastics, Ministry of Education/Shandong Provincial Key Laboratory of Rubber-Plastics, Qingdao University of Science & Technology, Qingdao 266042, China
cSchool of Materials Engineering, School of Mechanical Engineering and Birck Nanotechnology Center, Purdue University, West Lafayette, IN 47907, USA
First published on 16th July 2019
Abstract
The fast transient evolution of electric field assisted vertical orientation and assembly of halloysite nanotubes (HNTs) in a photo-curable matrix is investigated using a custom-built real-time birefringence measurement system. The effect of applied electric field strength and HNT loadings on the kinetics of orientation and organization of halloysite nanotubes into nanocolumns is systematically investigated. The following organization in the matrix is frozen by curing the precursor under ultraviolet (UV) light. The final structure is characterized by scanning electron microscopy (SEM) and wide angle X-ray scattering (WAXS). The nanocomposite films show vertically oriented and aligned HNTs due to the electric field. The orientation factor of HNTs decreases with the increase of particle concentration due to the higher viscosity and stronger inter-particle interaction.
1. Introduction
The addition of nanoparticles into the polymer matrix can introduce and enhance properties which are not commonly possible with unfilled polymers. These include thermal1 and electrical conductivity,2 ionic conductivity,3 diffusion4,5 and mechanical properties.6–8 For many fields, the properties need to be improved in the thickness direction of the nanocomposite films such as membranes,9 flexible electronics,10 wound dressing,11 fuel cells,12 photovoltaics,13 supercapacitors,14etc. Many nanoparticles exhibit high anisotropy in properties such as optical,15 thermal conductivity,16 and diffusivity.17 For example, halloysite (Al2Si2O5(OH)4·2H2O) nanotubes (HNTs) are one dimensional (1D) natural nanomaterials and aluminosilicate clay with high aspect ratios and hollow tubular nanostructures.18 HNTs have been massively studied in the field of polymer nanocomposites due to their unique anisotropic properties including ionic conductivity,19 optical15 and dielectric properties.20 Nevertheless, these unique anisotropic properties can't be utilized to the maximum level in the thickness direction of nanocomposites processed by traditional processing methods, because the anisotropic nanoparticles cannot be oriented in the “Z” direction via traditional processing techniques.21,22 Through-thickness “Z” direction orientation and alignment of the nanoparticles can be achieved by directed field assisted methods, such as electric field23–25 or magnetic field.26 When the dielectric particles are exposed to an electric field, they are charged and polarized. The torque they experience induces both rotational and translational motions in the matrix that leads to orientation.27 Due to the mismatch of dielectric constants between the particle and polymer matrix, the electric field induced dipole–dipole interactions between particles lead to the alignment of particles into particle chains.28,29 An electric-field30–32 assembly technique has been used to orient and align montmorillonite clay in the thickness “Z” direction. The preferentially oriented anisotropic montmorillonite clay leads to changes of optical properties of nanocomposites including birefringence, transmission and scattering.33,34 However, the study of thickness direction orientation and alignment of halloysite has not been conducted.In this paper, we introduce a detailed study of vertical direction orientation and alignment of halloysite nanotubes in a photocurable precursor by utilizing a directed electric field. A metrology instrument is utilized to observe the real-time birefringence development of the nanocomposites under an external electric field to determine the kinetics of the orientation and alignment of the anisotropic particles. After orienting and aligning the HNTs under the electric field, the photo-curable matrix is cured by UV light to immobilize HNTs to freeze the developed final structure.
2. Experimental
2.1 Materials
Halloysite nanotubes (HNTs) (diam. × L: 30–70 nm × 1–3 μm), potassium acetate (PA) (≥99.0%, 1.57 g cm−3 at 25 °C) and hydrochloric acid (HCl) (37%) were purchased from Sigma-Aldrich. Norland 65 (NOA65) was supplied by Norland Products.2.2 Preparation of surface modified HNTs
HNTs were chemically treated with potassium acetate (PA) and by procedures described as follows: 4 g of PA (Sigma-Aldrich) and 4 mL of hydrochloric acid (12 mol L−1) were mixed together, and 1000 mL distilled water was added into a glass beaker placed on a hotplate stirrer to form a PA solution. Then 36 g of halloysite particles were added to the PA solution gradually and stirred for 5 h at 60 °C. Then, treated HNTs were washed with distilled water and collected by centrifugation. After drying in a vacuum oven for 24 h, the particles were ground and filtered with a fine metal sieve (100 μm). The hydrochloric acid activates the hydroxyl groups on HNTs and potassium acetate neutralizes the surface charges on the HNT surface which weakens the hydrogen bonding effect between particle agglomerates.2.3 Preparation of nanocomposite membranes
Nanocomposites with 2 wt%, 4 wt% and 6 wt% concentrations of modified HNTs mixed in the matrix using planetary a centrifugal mixer (Thinky Mixer) at 2000 rpm for 30 min and then sonicated using a Hielscher UP400S ultrasonic processor at 50 Hz for 40 seconds. The above procedures were repeated 3 times to obtain well-dispersed suspensions. The suspension was loaded into a cell built with ITO coated transparent glass (bottom electrode) and 1 mm thick spacers, and it was covered with another ITO coated glass as the top electrode. A series of voltages at 100 Hz were applied between the two electrodes for 1000 seconds. The HNTs were polarized under the electric field, then oriented and aligned under dielectrophoretic force in the direction of the electric field. The suspension was cured and the structure was frozen using ultraviolet light (OmniCure S2000 UV lamp) with the UV light source kept 10 cm away from the suspensions for 8 minutes.2.4 Characterization
Real-time birefringence can be calculated using retardation as shown in eqn (1) and (2).
 | (1) |
 | (2) |
![[n with combining macron]](https://www.rsc.org/images/entities/i_char_006e_0304.gif) is the average refractive index of our material.
is the average refractive index of our material.
For this measuring system, 0° retardation is positive, if the refractive index of the polymer chain or particle in the machine direction is higher than transverse direction. The 0° retardation is negative if the refractive index in the transverse direction of the instrument is higher than that in machine direction. For 45° retardation, similarly, a positive retardation can be obtained for a higher refractive index in the film plane while a negative retardation indicates a higher refractive index in the thickness direction of the film.
3. Results and discussion
3.1 Real-time electric-birefringence measurement
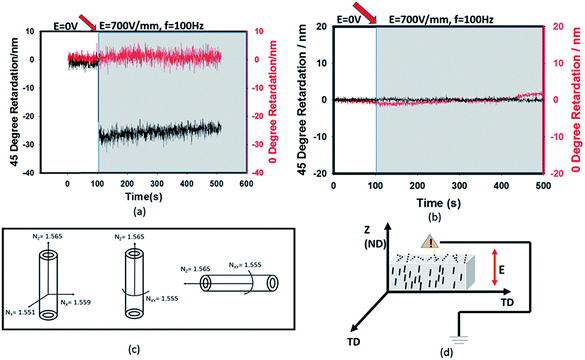
HNTs undergo induced polarization when an electric field is applied to the matrix with dielectric inorganic particles and the extent of polarization depends on the field variables. The field gradients experienced by these polarized particles lead to their rotational and translational motion within the matrix. Using the real-time birefringence measurement instrument described above, the preferential orientation can be tracked rapidly.When an AC (100 Hz) electric field is applied on the matrix with HNTs through the film thickness direction, the 45° retardation decreases immediately to a negative value while the 0° retardation remains constant at zero value as shown in Fig. 2(a). In order to prove that the decrease of 45° retardation is contributed only by HNTs rather than the polymer matrix, the same test is repeated on the film without any filler. Fig. 2(b) shows that there is no obvious change in both 0° and 45° retardation observed with the electric field applied suggesting that the resin has no contribution on the decrease of retardation at 45°. Since the decrease of retardation is only contributed by the orientation of HNTs, the effective thickness (dt = D × C), where D is the film thickness and C is the clay concentration (weight percentage) of HNTs in the film is used to calculate the in- plane and out-of-plane birefringence by using eqn (1) and (2), respectively. HNTs are anisotropic38 and optically biaxial minerals, thus they have three different principal refractive indices39 (Fig. 2(c)). The refractive indices along x and y axes are averaged to the refractive index, so the Nz and Nxy are respectively 1.565 and 1.555, making the intrinsic birefringence Δn = Nxy − Nz = −0.01. Hence the decrease of 45° retardation can be explained by the fact that the HNT axis with a higher refractive index was parallel to the direction of the electric field or thickness direction when the E-field was turned on as shown in Fig. 2(d). Electric field induced dipole–dipole interaction among polarized particles results in dielectrophoretic force leading to the rotational and translational motions of HNT particles along the electric field direction.
3.2 Kinetics of nanoparticle orientation and columnar organization
In order to study the kinetics of HNT orientation, the temporal evolution of birefringence is investigated at a series of applied voltages and particle concentrations. A constant AC frequency of 100 Hz is used during the E-field induced orientation test. When low voltage is applied, the birefringence increases slowly and the final plateau value is relatively low. With higher applied voltage, the rate of birefringence change and the final plateau value immediately increases, as shown in Fig. 3.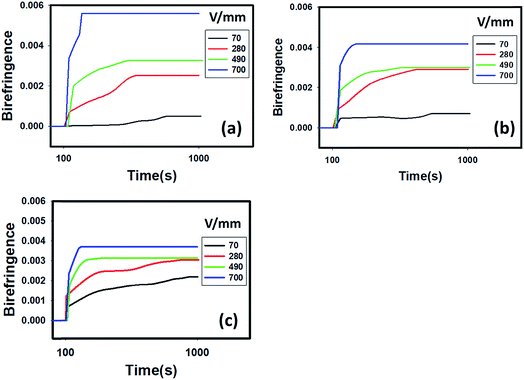 | ||
| Fig. 3 Kinetics of HNT orientation as evidenced by a birefringence response at a series of electric field strengths and clay concentrations of (a) 2 wt%, (b) 4 wt% and (c) 6 wt%. | ||
The final plateau value of birefringence is appreciably decreased with increasing concentration of HNTs when the applied voltage is maintained constant at 700 V as shown in Fig. 4(a). The level of viscosity plays a very important role in the orientation kinetics of HNT particles. Particles orient and rotate due to the torque from dielectrophoretic force which is proportional to the applied voltage and induced dipole. The torque has to be greater than the drag forces due to the viscosity in order to orient the particles. As the concentration of HNTs increases, the viscosity increases the drag forces as shown in ESI (Fig. S1†). The parameter of orientation factor can be calculated from the birefringence by using:
 | (3) |
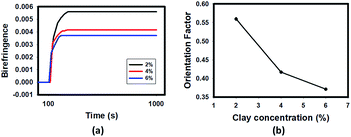 | ||
| Fig. 4 (a) The effect of HNT concentration on the birefringence at a fixed voltage of 700 V mm−1 at 100 Hz; (b) effect of clay concentration on change in orientation calculated through birefringence. | ||
With the increase of HNT concentration in the matrix resin, the orientation factor decreases (Fig. 4(b)). This is due to higher particle concentration resulting in higher drag force and larger interparticle interaction leading to frustrated structure where particles get into each others way. This results in lower orientation of particles as this lack of space and resulting reduced mobility between the particles restricts their preferential orientation in the electric field.
Polarized light microscopy is used to observe the orientation of clay particles when they exhibit optical anisotropy under an E-field. Optical micrographs were taken with a first order lambda plate (red wave plate) inserted along the gamma direction (slow axis) at 45° to the crossed polarizer and analyzer axes, giving a red background (Fig. 5). When HNT particles are oriented with their higher refractive index axis parallel to the slow axis (gamma direction), the HNT particles appear blue since the high refractive index of particles oriented in the same direction as the high refractive index axis of the lambda plate. In contrast, clay particles appear yellow if the particle's axis of higher refractive index is normal to the gamma direction.
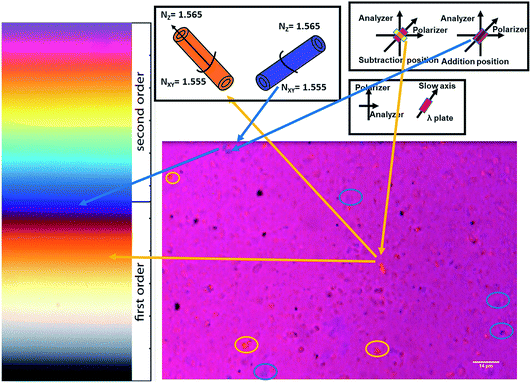 | ||
| Fig. 5 Birefringence response of halloysite nanotubes oriented under an electric field observed with a polarized optical microscope with a first order red wave plate. | ||
Using a polarized microscope with a first order lambda plate, the orientation of HNTs in the matrix can be observed. All observable colors can be observed in the in-plane micrograph obtained using the crossed polarizer and the first order lambda plate including yellow and blue since the HNT particles are randomly dispersed. When the long axis of HNTs is parallel to the slow axis, HNTs turn blue under the E-field applied. Similarly, if the long axis of HNTs is normal to the slow axis, HNTs appear yellow. Since HNTs and polymer chains are randomly distributed, the background still remains red.
In our experiment, the direction of the E-field is set parallel to the slow axis of the lambda plate (45 degrees to polarizer and analyzer axes). The images at different time periods show the orientation of the clay particles in Fig. 6. At the very beginning, the background is red, and yellow and blue colors can be observed at some spots of the image. It is important to note that it is difficult to observe single HNTs under the microscope due to their small dimensions, so the particles with different colors are clusters of HNTs. When the E-field is applied at 100 s, the background color turns from red to dark purple instantly because the well-dispersed HNTs are oriented along the E-field direction (slow axis of the lambda plate). The single halloysite axis with a higher refractive index is along the slow axis resulting in blue color, and thus the addition of blue to red leads to the dark purple color. With progression of time under the E-field applied, increasingly longer and thicker chain formation of HNTs occurs. This can be observed in the time sequence images in Fig. 6. The polarization field on one inclusion disturbs the electric field on the neighbouring inclusion producing attractive and repulsive forces between inclusions. The attractive and repulsive forces cause the formation of head-to-tail or particle chain morphologies.
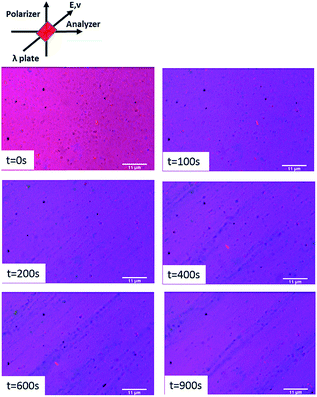 | ||
| Fig. 6 Time sequence images showing alignment of HNTs in the electric field (700 V mm−1, 100 Hz) with the electric field parallel to the slow axis of the red wave λ plate. | ||
3.3 WAXS of nanocomposites with oriented HNTs
WAXS is used to study the orientation of HNTs in the matrix after curing by shining UV light for 8 min Fig. 7(a) shows the WAXS pattern of modified HNTs. The observed peak at 2θ = 11.75° is attributed to the (001) plane of HNTs.40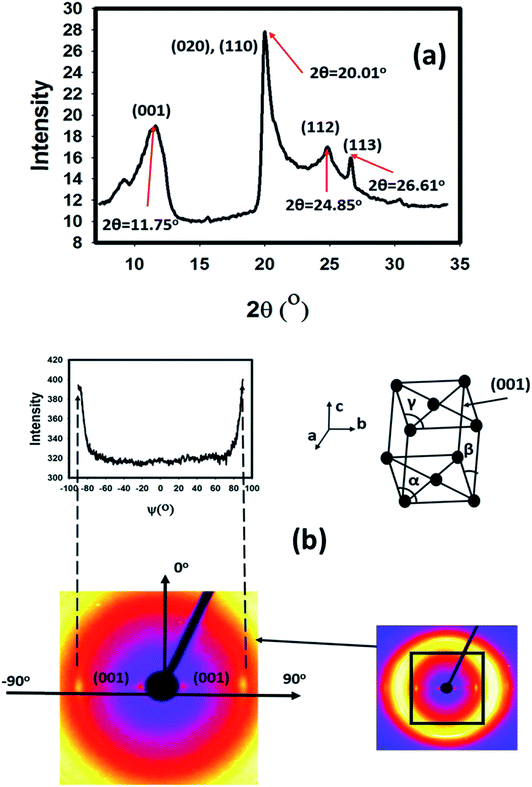 | ||
| Fig. 7 (a) WAXD spectra for modified HNTs, (b) Azimuthal scan of the WAXS pattern of the 4 wt% HNT nanocomposite and unit cell of the halloysite nanotube crystal and its (001) plane. | ||
It is reported41 that halloysite has a monoclinic unit cell (β≠90°, α, γ = 90°), and the cell parameters are: a = 5.14 Å, b = 8.9 Å, c = 7.2 Å and β = 99.7° (Fig. 7(b)). The anisotropic WAXS pattern shows azimuthally narrow diffraction spots corresponding to the diffraction from the (001) crystallographic planes of halloysite with the plane oriented along the direction of the E-field (thickness direction) when the electric field was applied.
Three X-ray patterns are obtained with X-rays directed along two mutually perpendicular transverse directions (TD) and one out-of-plane normal direction (ND). When X-rays pass through the thickness direction of the film, no anisotropy was observed (Fig. 8). However, when X-rays pass through the transverse direction which is perpendicular to the thickness direction, a narrow azimuthal breadth of the diffraction peak can be observed from the X-ray patterns signifying the sharp orientation of HNT particles along the thickness direction. This confirms that HNTs were orientated in the thickness direction of the nanocomposite film, which is parallel to the direction of the applied electric field (Fig. 8(d)).
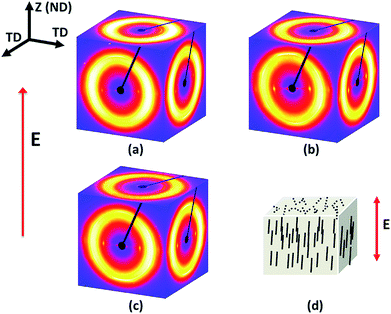 | ||
| Fig. 8 WAXD patterns of (a) 2 wt%, (b) 4 wt% and (c) 6 wt% HNTs composite films under an electric field of 700 V at 100 Hz. (d) Sketch of electrically aligned HNTs in the matrix. | ||
By plotting the intensity as a function of the azimuthal angle, the orientation factor of the (001) plane can be obtained and is given by:
 | (4) |
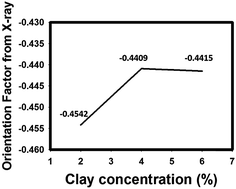 | ||
| Fig. 9 Orientation factors calculated from WAXS for nanocomposite films with different HNT concentrations. | ||
The orientation factors calculated from birefringence and WAXS analysis were similar to the value of orientation factor decreased with HNT loading at 700 V mm−1. As a solid observation technique, WAXD again proves that larger tactoids due to higher HNT concentration result in a lower orientation factor of HNTs due to higher drag force and larger interparticle interaction.
3.4 Morphology of the composite with oriented HNTs in the thickness direction
The halloysite nanotubes used in this study had a tubular shape with diameters in the range of 30–70 nm and lengths of 1–3 μm, as shown in Fig. 10(a). Different concentrations of treated HNTs in the photocurable resin matrix at 700 V at 100 HZ are prepared and their morphology is characterized by SEM as shown in Fig. 10. Fig. 10(b) shows the cross sectional morphology of 2% treated HNTs aligned in the matrix under the electric field, which shows good dispersion of HNTs. Single halloysite nanotubes were found axially oriented and aligned in the electric field direction (thickness direction). With the concentration of HNTs increasing, alignment of HNTs in the electric field direction was more obvious as shown in Fig. 10(c) and (d). Fig. 10(d) shows the SEM image of 6% treated HNTs aligned in the matrix under the electric field, and a good dispersion of HNTs can still be observed in the matrix. The cross sectional morphology shows the oriented and aligned HNTs along the electric field direction.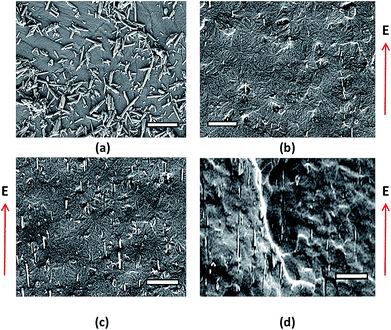 | ||
| Fig. 10 (a) Morphology of halloysite particles, (b) 2 wt%, (c) 4 wt% and (d) 6 wt% treated HNTs aligned in the matrix under an electric field strength of 700 V mm−1 at 100 Hz (scale bar = 2 μm). | ||
4. Conclusions
The kinetics of HNT orientation under an electric field is investigated by using a custom-built real-time birefringence measurement system. The increasing rate and final plateau value of birefringence increases with the applied electric field, indicating that HNTs are oriented more and faster in the vertical direction (along the field direction) with increasing voltage at constant HNT concentration. Viscosity is a crucial property that plays an important role in clay orientation under an electric field and the increase in viscosity hinders orientation of HNTs. Both WAXS and SEM techniques prove that the high orientation of HNTs in the film normal direction to the electric field provides a novel method to create nanocomposite films with unique structures.Conflicts of interest
There are no conflicts to declare.Acknowledgements
The authors would like to acknowledge Third Frontier, Wright Center of Innovation program (CMPND) of the State of Ohio.References
- Y. Chen, Y. Guo, S. Batra, E. Unsal, E. Wang, Y. Wang, X. Liu, Y. Wang and M. Cakmak, RSC Adv., 2015, 5(112), 92071–92079 RSC.
- L. V. Kayser and D. J. Lipomi, Adv. Mater., 2019, 31(10), 1806133 CrossRef PubMed.
- M. Du, B. Guo and D. Jia, Eur. Polym. J., 2006, 42(6), 1362–1369 CrossRef CAS.
- C. Lu and Y.-W. Mai, Phys. Rev. Lett., 2005, 95(8), 088303 CrossRef PubMed.
- B. Xu, Q. Zheng, Y. Song and Y. Shangguan, Polymer, 2006, 47(8), 2904–2910 CrossRef CAS.
- A. J. Crosby and J. Y. Lee, Polym. Rev., 2007, 47(2), 217–229 CrossRef CAS.
- S. Tjong, Mater. Sci. Eng., R, 2006, 53(3), 73–197 CrossRef.
- Z. Guo, T. Pereira, O. Choi, Y. Wang and H. T. Hahn, J. Mater. Chem., 2006, 16(27), 2800–2808 RSC.
- B. R. Vaughan and E. Marand, J. Membr. Sci., 2008, 310(1), 197–207 CrossRef CAS.
- D. A. Kunz, J. Schmid, P. Feicht, J. Erath, A. Fery and J. Breu, ACS Nano, 2013, 7(5), 4275–4280 CrossRef CAS PubMed.
- Y. Guo, S. Pan, F. Jiang, E. Wang, L. Miinea, N. Marchant and M. Cakmak, RSC Adv., 2018, 8(15), 8173–8180 RSC.
- D. Yuan, Z. Liu, S. W. Tay, X. Fan, X. Zhang and C. He, Chem. Commun., 2013, 49(83), 9639–9641 RSC.
- W. U. Huynh, J. J. Dittmer, N. Teclemariam, D. J. Milliron, A. P. Alivisatos and K. W. Barnham, Phys. Rev. B: Condens. Matter Mater. Phys., 2003, 67(11), 115326 CrossRef.
- H. Lin, L. Li, J. Ren, Z. Cai, L. Qiu, Z. Yang and H. Peng, Sci. Rep., 2013, 3, 1353 CrossRef PubMed.
- K. Murata and K. Haraguchi, J. Mater. Chem., 2007, 17(32), 3385–3388 RSC.
- M. Tanimoto, T. Yamagata, K. Miyata and S. Ando, ACS Appl. Mater. Interfaces, 2013, 5(10), 4374–4382 CrossRef CAS PubMed.
- T. Lai and M. Mortland, Clays Clay Miner., 1968, 16, 129–136 CrossRef.
- M. Liu, Z. Jia, D. Jia and C. Zhou, Prog. Polym. Sci., 2014, 39(8), 1498–1525 CrossRef CAS.
- R. Prasanth, N. Shubha, H. H. Hng and M. Srinivasan, Eur. Polym. J., 2013, 49(2), 307–318 CrossRef CAS.
- E. David, M. Fréchette, B. Zazoum, C. Daran-Daneau, A. Ngô and H. Couderc, J. Nanomater., 2013, 2013, 65 Search PubMed.
- Y. Konishi and M. Cakmak, Polymer, 2005, 46(13), 4811–4826 CrossRef CAS.
- B. Yalcin and M. Cakmak, Polymer, 2004, 45(8), 2691–2710 CrossRef CAS.
- Y. Guo, Y. Chen, E. Wang and M. Cakmak, ACS Appl. Mater. Interfaces, 2017, 9(1), 919–929 CrossRef CAS PubMed.
- H. G. Schoberth, V. Olszowka, K. Schmidt and A. Böker, in Complex Macromolecular Systems I, Springer, 2010, pp. 1–31 Search PubMed.
- Y. Guo, S. Batra, Y. Chen, E. Wang and M. Cakmak, ACS Appl. Mater. Interfaces, 2016, 8(28), 18471–18480 CrossRef CAS PubMed.
- Y. Chen, Y. Guo, S. Batra, E. Wang, Y. Wang, X. Liu, Y. Wang and M. Cakmak, Nanoscale, 2015, 7(35), 14636–14642 RSC.
- T. C. Halsey, Science, 1992, 258(5083), 761–766 CrossRef CAS PubMed.
- L. Nayak, M. Rahaman, D. Khastgir and T. Chaki, Polym. Bull., 2011, 67(6), 1029–1044 CrossRef CAS.
- X. Liu, J. Liu, Y. Guo and M. Cakmak, Compos. Sci. Technol., 2017, 153, 62–70 CrossRef CAS.
- M. L. Jiménez, L. Fornasari, F. Mantegazza, M. C. Mourad and T. Bellini, Langmuir, 2011, 28(1), 251–258 CrossRef PubMed.
- S. Batra, E. Unsal and M. Cakmak, Adv. Funct. Mater., 2014, 24(48), 7698–7708 CrossRef CAS.
- Z. Liu, P. Peng, Z. Liu, W. Fang, Q. Zhou, X. Liu and J. Liu, Compos. Sci. Technol., 2018, 165, 39–47 CrossRef CAS.
- B. Huang, T. G. van de Ven and R. J. Hill, J. Phys. Chem. C, 2011, 115(17), 8447–8456 CrossRef CAS.
- R. A. Rica, M. L. Jiménez and Á. V. Delgado, Soft Matter, 2012, 8(13), 3596–3607 RSC.
- E. Unsal, J. Drum, O. Yucel, I. Nugay, B. Yalcin and M. Cakmak, Rev. Sci. Instrum., 2012, 83(2), 025114 CrossRef CAS PubMed.
- O. Yucel, E. Unsal and M. Cakmak, Macromolecules, 2013, 46(17), 7112–7117 CrossRef CAS.
- Y. Eguchi, E. Unsal and M. Cakmak, Macromolecules, 2013, 46(18), 7488–7501 CrossRef CAS.
- D. Oakley and B. Jennings, Clay Miner., 1982, 17(3), 313 CrossRef.
- V. Richard, H. C. W. S. Gaines, E. E. Foord, B. Mason and R. Abraham, Dana's New Mineralogy, 1997, vol. 1872, pp. 1411–1414 Search PubMed.
- C. Indley, Crystal structures of clay minerals and their X-ray identification, 1982, vol. 5, p. 125 Search PubMed.
- T. Imai, H. Nakano, K. Urabe and M. Ohyanagi, J. Ceram. Soc. Jpn., 2004, 112, S1153–S1155 Search PubMed.
Footnotes |
| † Electronic supplementary information (ESI) available. See DOI: 10.1039/c9na00369j |
| ‡ Shuyang Pan and Yuanhao Guo contributed equally to this work and this manuscript was written through contributions of all authors. |
| This journal is © The Royal Society of Chemistry 2019 |


