
 Open Access Article
 This Open Access Article is licensed under a
 Creative Commons Attribution 3.0 Unported Licence
Fast identification of optimal pure platinum nanoparticle shapes and sizes for efficient oxygen electroreduction†
Marlon
Rück
 a,
Aliaksandr
Bandarenka
b,
Federico
Calle-Vallejo
c and
Alessio
Gagliardi
*a
a,
Aliaksandr
Bandarenka
b,
Federico
Calle-Vallejo
c and
Alessio
Gagliardi
*a
aDepartment of Electrical and Computer Engineering, Technical University of Munich, 80333 München, Germany. E-mail: alessio.gagliardi@tum.de
bPhysics Department, Technical University of Munich, 85748 Garching, Germany
cDepartment of Materials Science and Physical Chemistry, Institute of Theoretical and Computational Chemistry (IQTC), University of Barcelona, 08028 Barcelona, Spain
First published on 3rd June 2019
Abstract
Recent advances in experimental synthesis of nanostructures have shown that the interplay between nanoparticle shapes and sizes is crucial to achieve catalysts with high mass activity toward oxygen electroreduction. This is particularly important for proton-exchange membrane fuel cells (PEMFCs), in which expensive and scarce Pt electrocatalysts are used. In this work, we propose a theoretical approach for oxygen electroreduction on PEMFCs to identify not only the size of optimal nanoparticles, but also their shapes. Remarkably, high mass activities up to 4.28 A mgPt−1 are predicted for rod-like nanostructures. Furthermore, we examine nanostructure size effects to guide chemical routes for experimental synthesis of the identified electrocatalysts. Our fast theoretical evaluation of thousands of different nanostructures aids in the search for active catalysts, as substantially enhanced mass activities over commercial Pt/C are predicted for pure Pt electrocatalysts, thus unveiling great potential to reduce the Pt loading in PEMFCs.
Introduction
General chemical strategies are currently pursued to accelerate the oxygen reduction reaction (ORR), so as to pave the way for economically viable polymer electrolyte membrane fuel cells.1 Recent advances in nanostructure synthesis have greatly aided in the search for nanostructured electrocatalysts which harbor enhanced catalytic mass activities over current commercial Pt/C electrocatalysts.2 During the past few years, record mass activities for the ORR have been reported for various nanostructured Pt-alloy electrocatalysts. For instance, PtNi alloys with octahedral nanostructures3,4 and PtNi alloy nanoframes5 demonstrate superior activities.Based on the Sabatier principle, which is one of the pillars of modern catalysis, it is widely accepted that the ORR activity is largely controlled by the adsorption energies of its reaction intermediates.6–8 More precisely, numerous experimental studies on pure Pt and Pt-alloy model structures unraveled that weakening the *OH adsorption energies by ∼0.1–0.15 eV with respect to Pt(111) gives rise to improved catalytic activities.9–13
Furthermore, for a pure metal, the relation between adsorption energies and morphology is provided by structural descriptors such as generalized coordination numbers.14,15,40 The generalized coordination number of a given site i
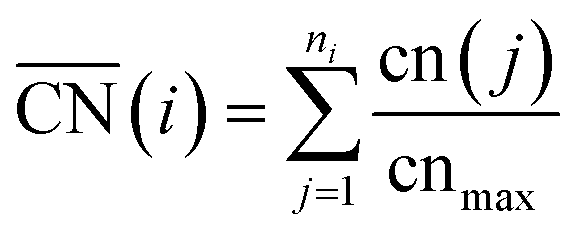 | (1) |
 comprises finite size effects and local site structures up to the second coordination sphere of the active sites. Density Functional Theory (DFT) studies have shown that the adsorption energies of all crucial ORR intermediates, i.e. *O, *O2, *OH, and *OOH, are linearly related with
  .13,14 Generalized coordination numbers also capture strain effects on pure Pt and Pt-alloys, so that strained Pt catalysts approximately follow the same linear trends in *OH and *OOH adsorption energies (for pure Pt)16 and *O2 adsorption energies (for Pt alloys)17 as the unstrained Pt catalysts. This is noteworthy, as a number of recent works have put forward the importance of strain for the ORR.12,18–21
Coordination–activity plots based on the Sabatier principle and the DFT-assessed free energies of the intermediates (which are calculated as in ref. 6), show that local Pt site structures with  are expected to yield activity enhancements relative to Pt(111).2,13,15,16 Importantly, this range in
  corresponds to a weakening of ∼0–0.15 eV in *OH binding energy relative to Pt(111), which coincides with the experimental range mentioned above.9–13 The effects of the local site structure demonstrate that the interplay between shape and size of nanostructures determines the adsorption energies and, therefore, shape22,23 and size24,25 engineering are crucial to achieve electrocatalysts with high mass activity.
On certain model Pt stepped surfaces, active sites with  are arranged in a side-by-side formation.15 Furthermore, it is suggested that active sites can be tailored in cavities13 and at concavities15,18,26 of Pt nanostructures.
From an experimental perspective, the synthesis and characterization of several thousands of different nanostructures is time-consuming and expensive. Thus, fast computational screening of nanostructures can provide experimenters with prospective nanostructures to be synthesized, characterized, and evaluated electrocatalytically. However, in computational studies, elaborating detailed mass activity predictions within feasible computation times is also a rather demanding task. For instance, the concept of  provides important knowledge of active local site structures, but it does not tell how plenty of those active local site structures can be incorporated into stable nanostructured electrocatalysts with high mass activity.
A recent computational model27 allows for the rapid prediction of mass activities of regular nanoparticles, where the structures of Pt electrocatalysts are evaluated at the nanoscale based on  . In that study, mass activities in good agreement with experiments have been computed in units of amperes per milligram.
Herein, we screen shapes and sizes of nanostructures to identify Pt electrocatalysts which feature high mass activity, controllable size distribution, and decent mechanical stability. Since Gielis' Superformula28 includes a continuous parameter space to create various kinds of shapes, we propose a generalization of it in three dimensions29,30 to design a wide variety of continuous symmetric shapes (see Methods section). Pt nanoparticles are carefully optimized toward highest mass activity by Penalty Attractive and Repulsive Particle Swarm Optimization (PARPSO).31 To account for high stability under ORR conditions, low-coordinated sites with cn < 6 are avoided. The enhancement in mass activities of tailored nanostructured electrocatalysts is benchmarked against Tanaka commercial Pt/C electrocatalysts with 0.55 A mgPt−1 mass activity.32
Results and discussion
To explore the shapes and sizes of nanostructured Pt electrocatalysts, we will start our analysis with one of the simplest and most common class of shapes, namely sphere-like nanoparticles. The analysis of sphere-like nanoparticles will be followed by the investigation of rod-like nanostructures, which constitute a second, more complex class of shapes. Both types of shapes are generated by two distinct variations of the Superformula. Note that each Superformula shape fulfills either C3 or C4 rotational symmetry with respect to the z-axis.Sphere-like nanoparticles
Six sphere-like nanoparticles with high predicted mass activities are identified in two different screenings, which are numbered from S I to S VI in Fig. 1. The nanoparticles S I to S V, which are obtained by the first screening (see ESI†), have relatively large sizes from ∼4 nm and mass activities in the range of 0.83 A mgPt−1 to 1.05 A mgPt−1.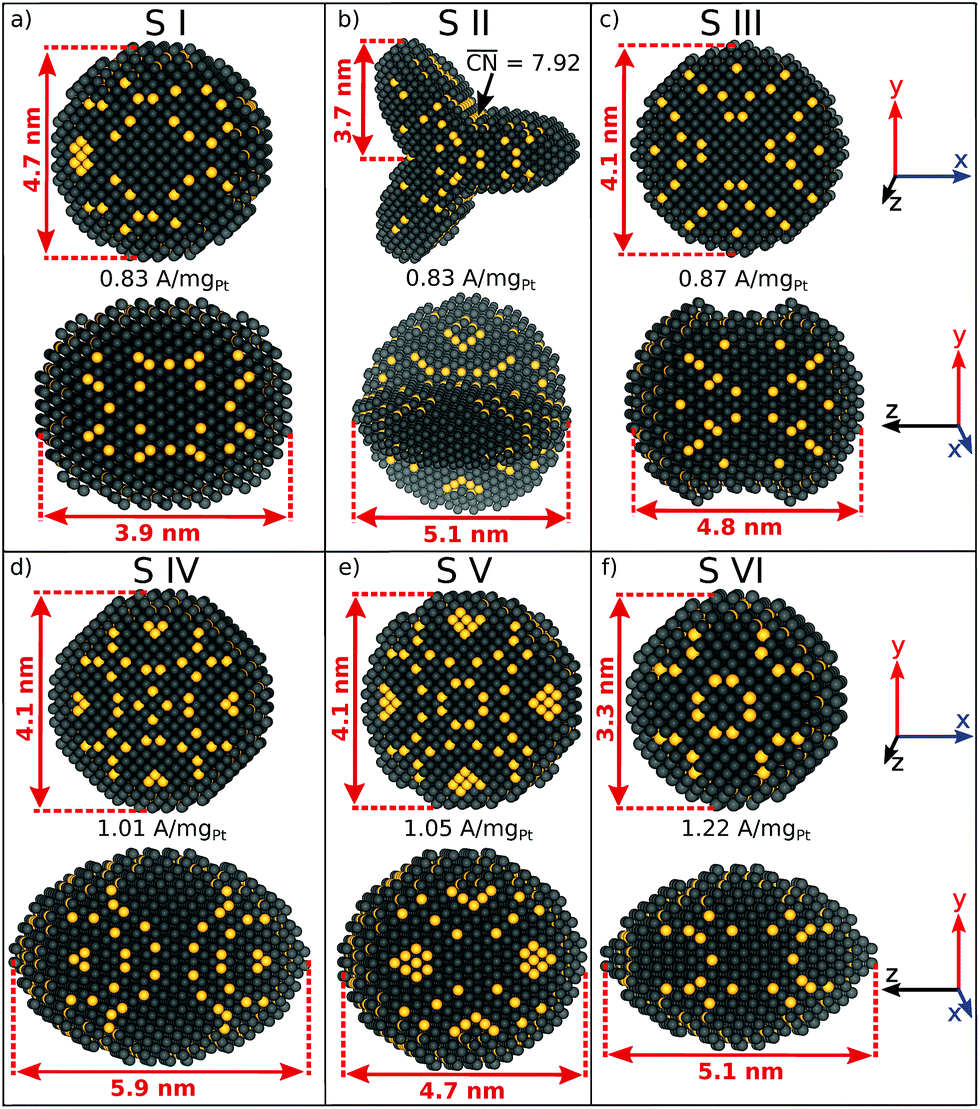 | ||
Fig. 1 (a–f) Active sphere-like nanoparticles identified by two screenings. Active sites with  are highlighted in yellow. Note that, although shape S II has a tripod shape in the x–y plane, and a sphere-like shape in the y–z plane, the shape S II originates from the spherical coordinate related Superformula. are highlighted in yellow. Note that, although shape S II has a tripod shape in the x–y plane, and a sphere-like shape in the y–z plane, the shape S II originates from the spherical coordinate related Superformula. | ||
A comparison between S III and S V shows that both nanoparticles have similar sizes, but their different shapes lead to different arrangements of active sites. Both shapes have similar lengths along the x-, y-, and z-axes, but a different surface curvature with respect to the z-axis. Consequently, the nanoparticle S V should have 20% larger mass activity compared to S III. This illustrates that nanostructure shapes have significant effects on the catalytic activity for a given size.
Lowering the nanoparticle size to 3.3 nm along the x- and y-axes (see Fig. 1f) renders nanoparticle S VI, which is obtained by the second screening. The shape S VI has an increased predicted mass activity of 1.22 A mgPt−1, corresponding to a ∼2.2-fold enhancement over Tanaka commercial Pt/C electrocatalysts.32
Albeit the nanoparticles S V and S VI are the most mass-active shapes and sizes identified in the two associated screenings, their mass activities depend sensitively on the size. To focus on intermediate sizes, a size limit of ∼3.6 nm is used in the screenings (see ESI†). Above this size limit, Fig. 2a reveals that the shape S V is optimal in size, so that it should be 30% more mass-active than other electrocatalysts of similar sizes. Furthermore, the structure sensitivity increases toward small nanostructure sizes, in line with ref. 33. This observation is rationalized considering that slight changes in the structure of the active sites have stronger effects on the mass activity for small-sized and lightweight nanostructures. In contrast, for larger nanostructures, the mass activities follow more closely the overall trend.
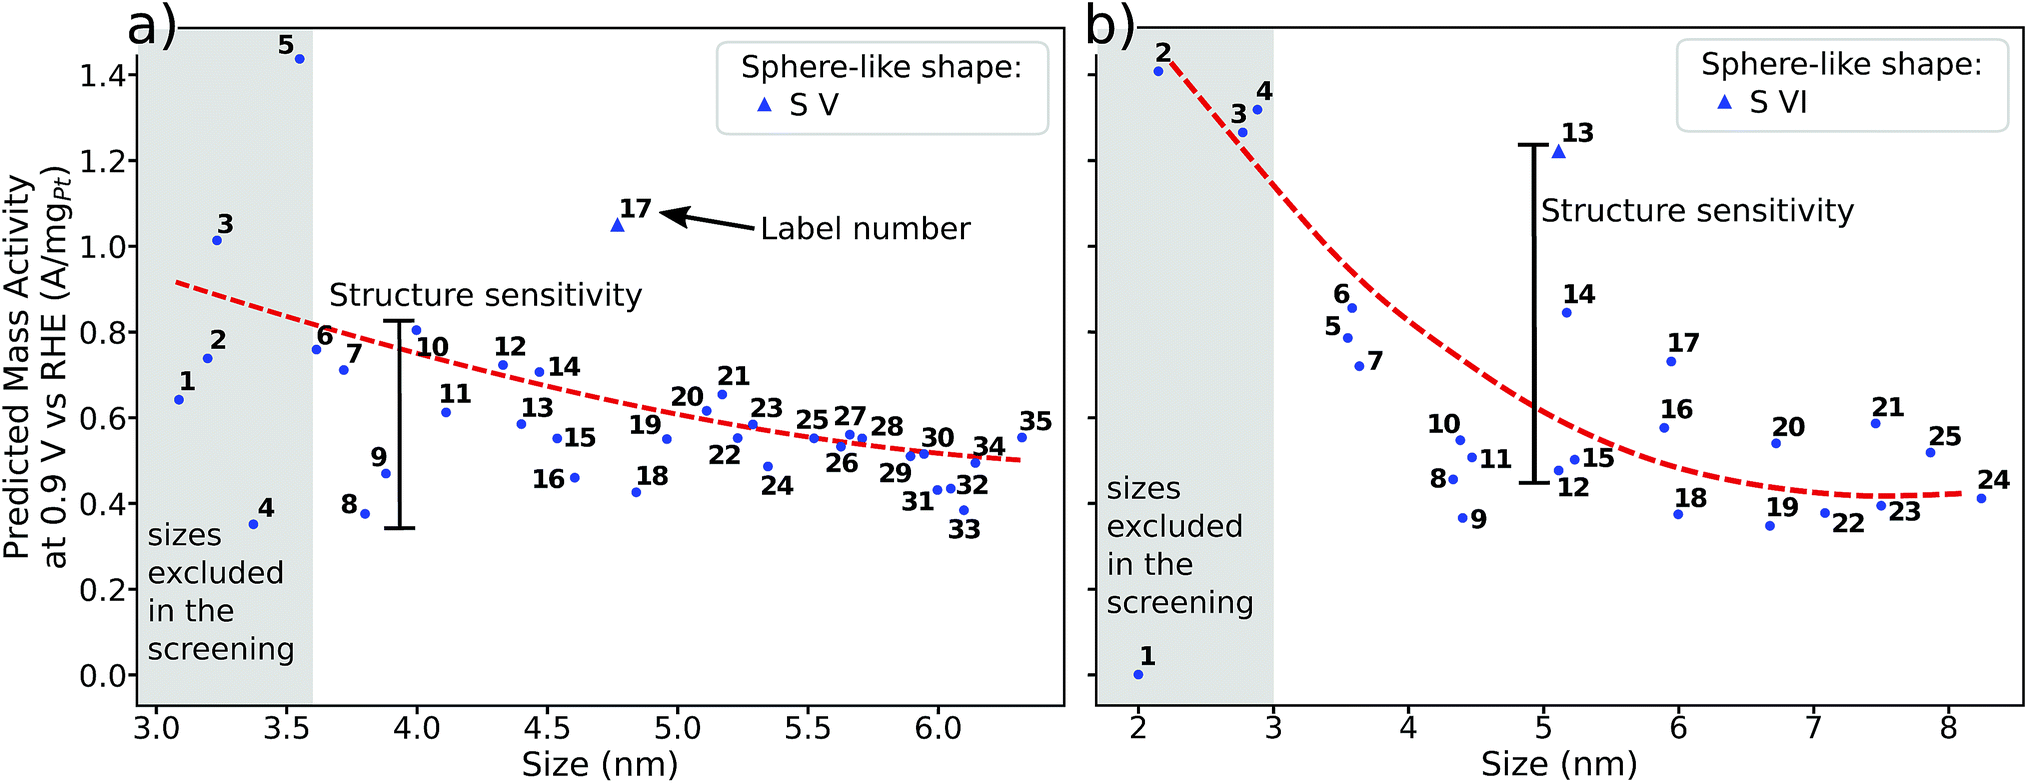 | ||
| Fig. 2 Size effects on the predicted mass activity for the sphere-like shapes (a) S V and (b) S VI. All nanoparticles in (a) and (b) are illustrated in the ESI.† The red dashed curves are provided as a guide to the eye to indicate the overall mass activity trend. Sizes below ∼3.6 nm in (a) and ∼3 nm in (b) (see grey shaded areas) are excluded in the screenings to focus on intermediate sizes. Note that panels (a) and (b) have the same mass activity scale. | ||
Nanoparticle S VI exhibits similar size effects. Above the size limit of ∼3 nm included in the screening, the mass activity of S VI is optimized with respect to the particle size. The enhanced activity of shape S VI originates from a high distribution of active sites near the optimal value  , while less active Pt(111) sites with
  dominate on electrocatalyst 12 of similar size (see Fig. S8†). Below the size limit of ∼3 nm, higher mass activities up to 1.38 A mgPt−1 are detected for electrocatalysts 2, 3, and 4. Unlike shapes S V and S VI, the shape S II is ranked 31st in the mass activity in the associated screening. Since the optimization algorithm focuses on the optimization of the most mass-active nanostructures, lowering the size of S II may improve the mass activities, as shown in Fig. 3. Averaging over the electrocatalysts 12–30 yields a mass activity of 0.81 A mgPt−1 with a mean nanostructure size of ∼4.31 nm and a relatively large size distribution of 0.98 nm.
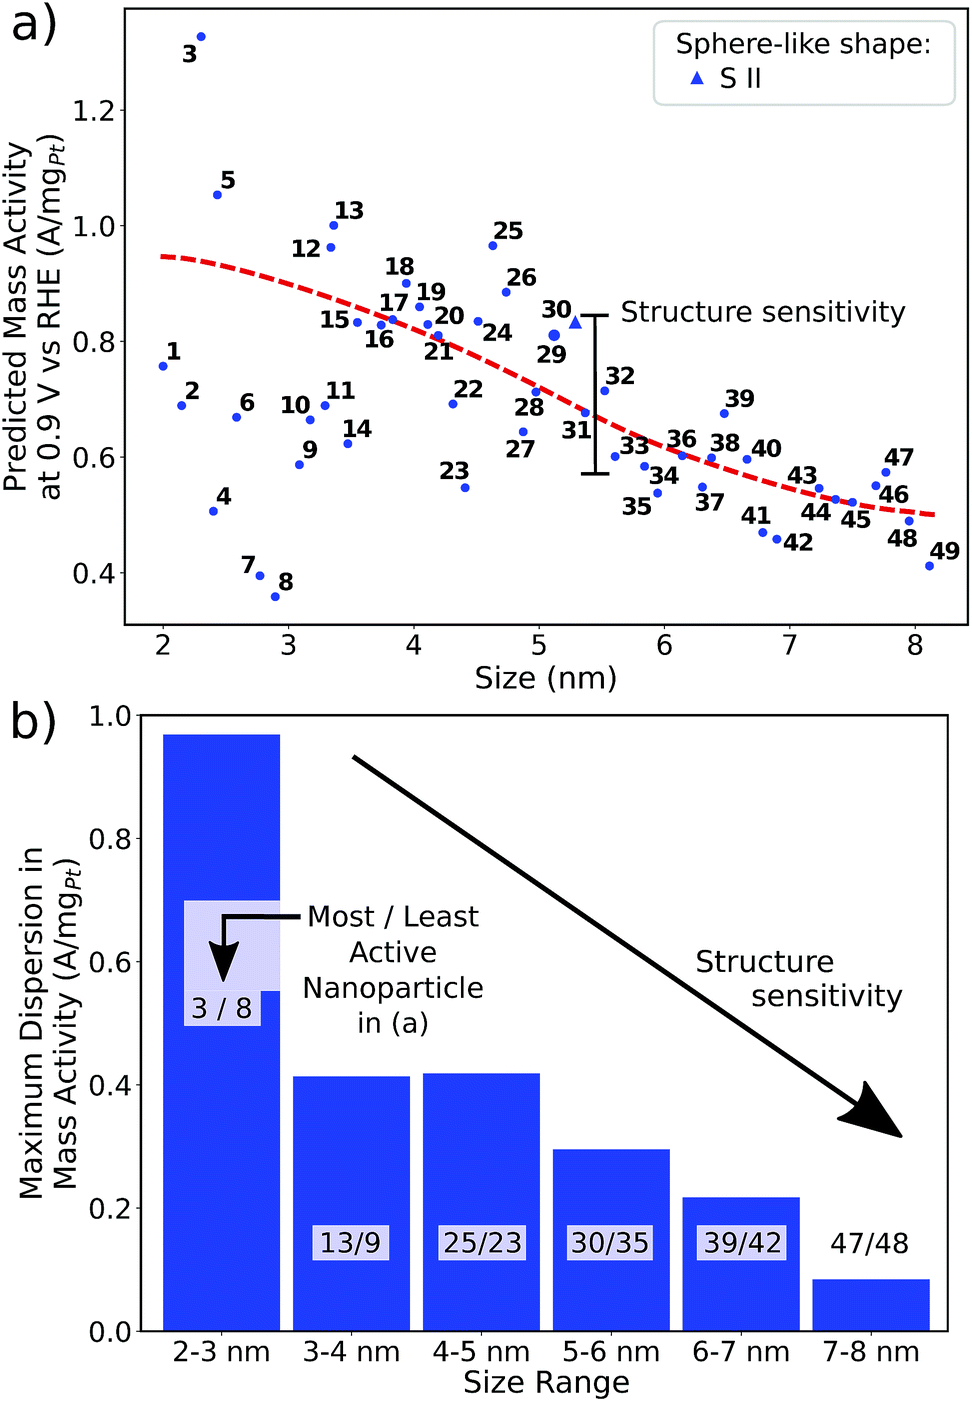 | ||
| Fig. 3 (a) Size effects on the predicted mass activity for the sphere-like shape S II. The red dashed curve is provided as a guide to the eye to indicate the overall mass activity trend. (b) The maximum dispersion in mass activity, i.e. the mass activity difference between the most active and the least active nanoparticles, is depicted for several size ranges. | ||
In line with the above discussion, the structure sensitivity of shape S II decreases toward larger nanoparticle sizes. Fig. 3b shows that the dispersion in mass activity between the most active and least active nanoparticles is 1 A mgPt−1 at small sizes in the 2–3 nm range. Toward larger sizes, the dispersion is reduced by 90%, where 0.1 A mgPt−1 is observed in the 7–8 nm size range.
Shape S II provides important information on how active local site structures with  can be created in nanostructured electrocatalysts. Five active sites up to
  are lined up side by side at the 120° kink as shown in Fig. 1b. This observation demonstrates that optimal local site structures near
  can be tailored by means of concave kinks. However, the convexity along the 120° kink in S II leads to downgraded
  , and therefore less active sites at the edges of the nanoparticle. This problem is resolved in the rod-like nanostructures discussed below.
Rod-like nanostructures
The rod-like nanostructures presented in this study feature rectilinear kinks without convexities, so that active local site structures are periodically extended over the nanostructure length along the z-axis, as shown in Fig. 4a and S1.† We present 12 rod-like nanostructures numbered from C I to C XII in Fig. 4, which are obtained from three different screenings. The length along the z-axis is fixed to ∼4.7 nm as illustrated in Fig. 4a. To account for arbitrary length in this study, sites at the outer edge along the z-axis are excluded for the prediction of mass activities (see Fig. S1†). | ||
Fig. 4 (a–l) Active nanostructured electrocatalysts with rod-like shapes identified by the screenings. Active sites with  , which are taken into account for mass activity prediction, are highlighted in yellow. , which are taken into account for mass activity prediction, are highlighted in yellow. | ||
The nanostructures have lengths from 2.2 nm to 3.9 nm along the x- and y-axes. Nanostructures with relatively large lengths from 3.3 nm in Fig. 4b–h harbor mass activities up to 3.75 A mgPt−1. Smaller nanostructures in Fig. 4i-l reach mass activities up to 4.28 A mgPt−1, corresponding to a ∼7.8-fold enhancement in mass activity over Tanaka commercial Pt/C electrocatalysts.32 Thus, the rod-like nanostructures in Fig. 4 are over 3 times more active than the sphere-like nanoparticles in Fig. 1.
Comparing C III and C XII, both nanostructures have similar shapes whereas the sizes differ by almost 1 nm. The smaller nanostructure C XII has almost twofold mass activity over the larger nanostructure C III. In contrast, the nanostructures C I and C XI have similar sizes, but their different shapes result in markedly different mass activities. Again, this suggests that the interplay between nanostructure shapes and sizes is crucial to find nanocatalysts with high mass activities.
Size effects are studied for the most mass-active electrocatalysts in the associated screenings, i.e. C VII, C XI and C XII (for the size measure, please see the Methods section on Nanostructure size effects). As depicted in Fig. 5, the relatively large nanostructure C VII is optimal in size, whereas small changes in the local site structures give rise to considerably downgraded mass activities by ca. 50% for electrocatalysts 10 and 13. The large difference in mass activity can be rationalized from the  distribution (provided in the ESI†). For instance, electrocatalyst 10 has only half as many active sites compared to the optimized shape C VII of slightly larger size. Thus, experimental activity measurements on C VII would strongly depend on the size distribution at the atomic scale. The smaller and more mass-active nanostructure C XI is also optimal in size, and small size variations have large effects on the mass activity, as well. This is depicted in Fig. 6. In particular, the electrocatalysts 8–15 in Fig. 6 feature the same nanostructure centers, but the lengths of the legs are different. Shortening the legs of C XI (see electrocatalyst 8) and elongating them (see electrocatalysts 12, 13, and 15) downgrade the mass activity. Nonetheless, a high average mass activity of 2.71 A mgPt−1 is predicted at mean nanostructure size (2.96 ± 0.96) nm for electrocatalysts 8–15. This constitutes a 4.9-fold mass activity increase over Tanaka commercial Pt/C electrocatalysts. Size effects on the most mass-active nanostructure C XII are presented in Fig. 7a. Although electrocatalysts 1–18 are all 2.6 nm in size, the associated mass activities are widely scattered. A detailed evaluation of electrocatalysts 1–18 reveals that they have different local site structures at concave kinks. Plotting the mass activities versus the number of atoms relative to nanostructure C XII (see inset in Fig. 7a) uncovers two groups of nanostructures. Electrocatalysts 1–9 have high mass activities of 3.41–4.27 A mgPt−1 whereas the electrocatalysts 10–18 have significantly lower mass activities in the range of 1.02–2.59 A mgPt−1.
 | ||
| Fig. 5 Size effects on the predicted mass activity for the rod-like shape C VII. The red dashed curve is provided as a guide to the eye to indicate the overall mass activity trend. | ||
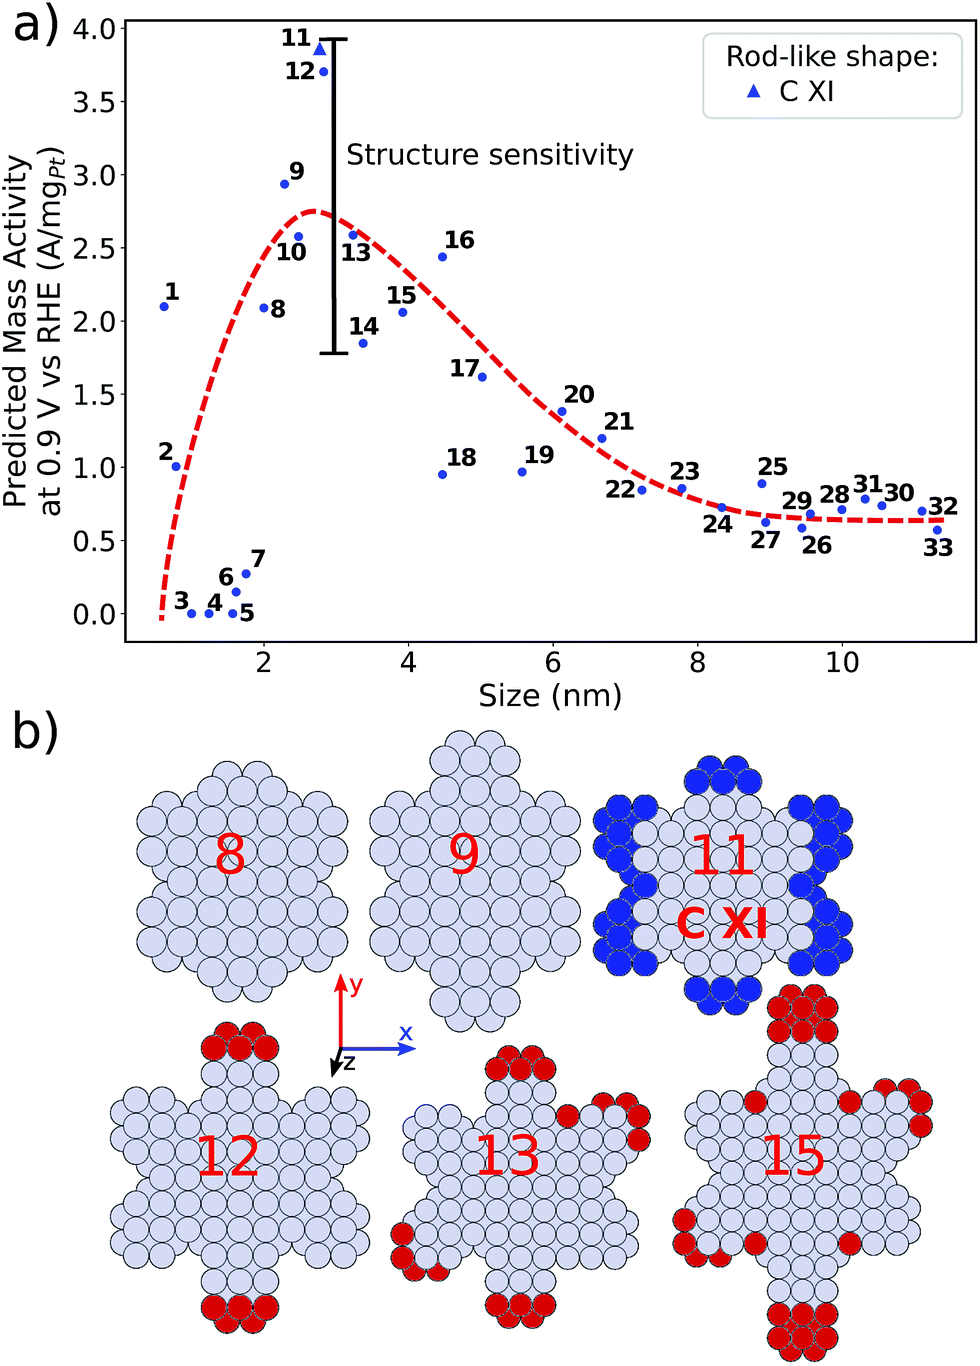 | ||
| Fig. 6 (a) Size effects on the predicted mass activity for the rod-like shape C XI. The red dashed curve is provided as a guide to the eye to indicate the overall mass activity trend. (b) Electrocatalysts 8, 9, 11–13, and 15 are presented. Shortened nanostructure legs in electrocatalyst 8, compared to C XI, are highlighted by blue atoms. Enlarged nanostructure legs of electrocatalysts 12, 13, and 15, compared to C XI, are colored in red. | ||
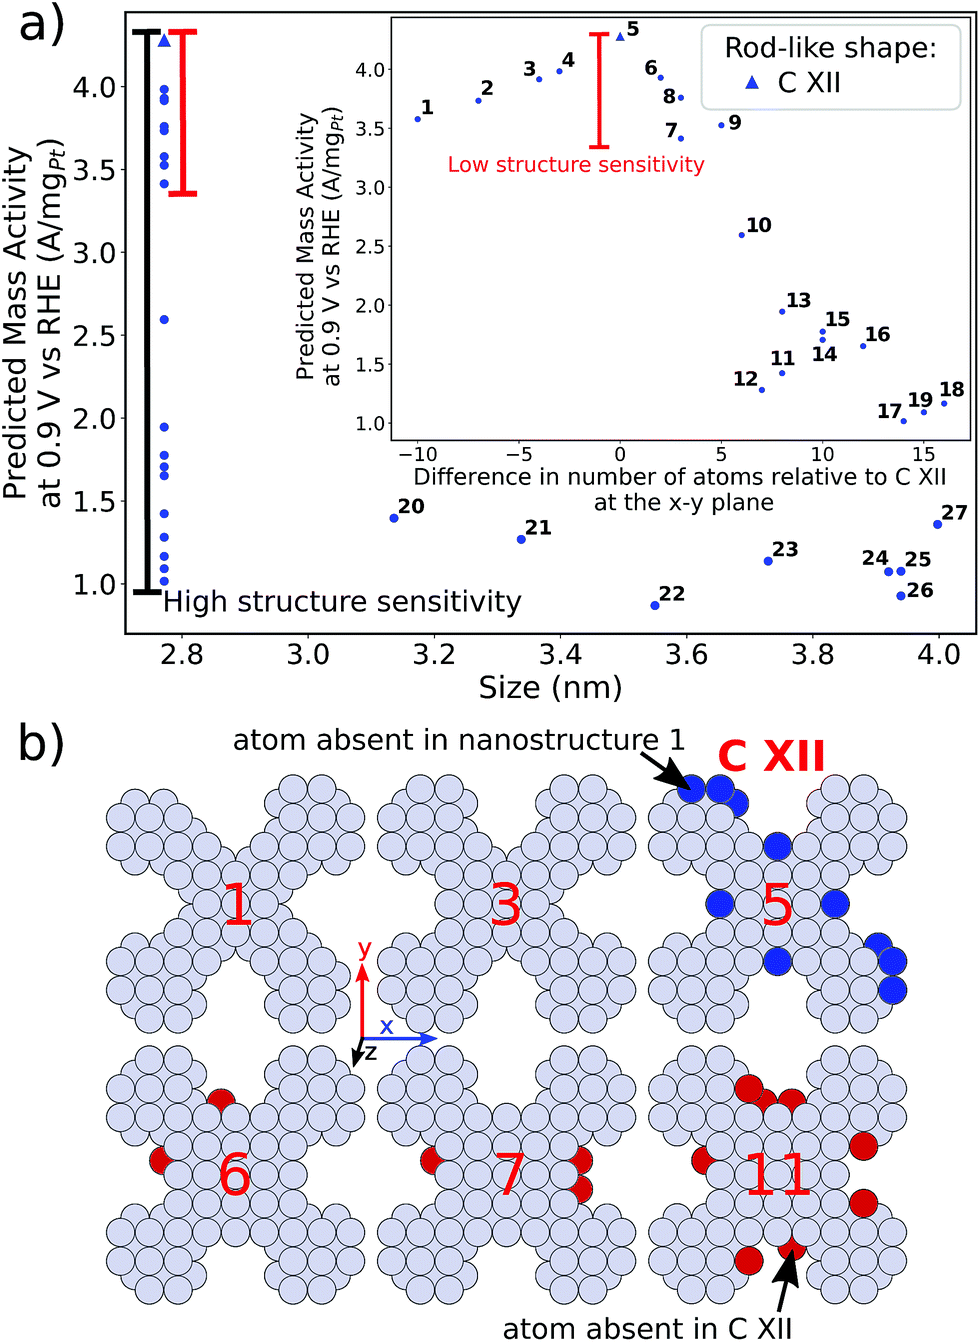 | ||
| Fig. 7 (a) Size effects on the predicted mass activity for the rod-like shape C XII. For electrocatalysts 1–18, the mass activities versus the difference in the number of atoms relative to C XII at the x–y plane are shown in the inset. The structure sensitivity between electrocatalysts 1–18, which have similar overall sizes, is illustrated by the black horizontal bar. The red horizontal bar shows the relatively small structure sensitivity between electrocatalysts 1–9 which differ in the number of additional atoms. (b) Electrocatalysts 1, 3, 5–7, and 11 are presented. Additional atoms, which are absent in electrocatalyst in C XII, are highlighted in red. Atoms in C XII, which are absent in electrocatalyst 1, are highlighted in blue. | ||
As illustrated in Fig. 7b, the difference in the number of atoms relative to C XII, which are located at the x–y plane and highlighted in red, increases from 2 to 8 on electrocatalysts 6–11. In the case of only few additional atoms, as for electrocatalysts 6 and 7, the mass activities are still on a high level near 3.41 A mgPt−1 and above. Absence of several atoms (highlighted in blue) on electrocatalysts 1–4 in fact keeps the mass activity above 3.5 A mgPt−1. In contrast, more than ca. 5 additional atoms results in considerably downgraded mass activity as illustrated for electrocatalyst 11.
Thus, realizing C XII with diagonal size of 2.6 nm (see Fig. 4) and few additional atoms would enable high mass activities of ∼3.79 A mgPt−1, corresponding to the average mass activity of electrocatalysts 1–9.
Experimental perspective
From an experimental perspective, it is useful to summarize the mass activity enhancement of tailored nano-electrocatalysts compared to Tanaka commercial Pt/C electrocatalysts, as in Fig. 8. The sphere-like nanoparticle S II harbors relatively small mass activity enhancement of ∼150% over Tanaka commercial Pt/C electrocatalysts, but low structure sensitivity likely allows for straightforward experimental synthesis.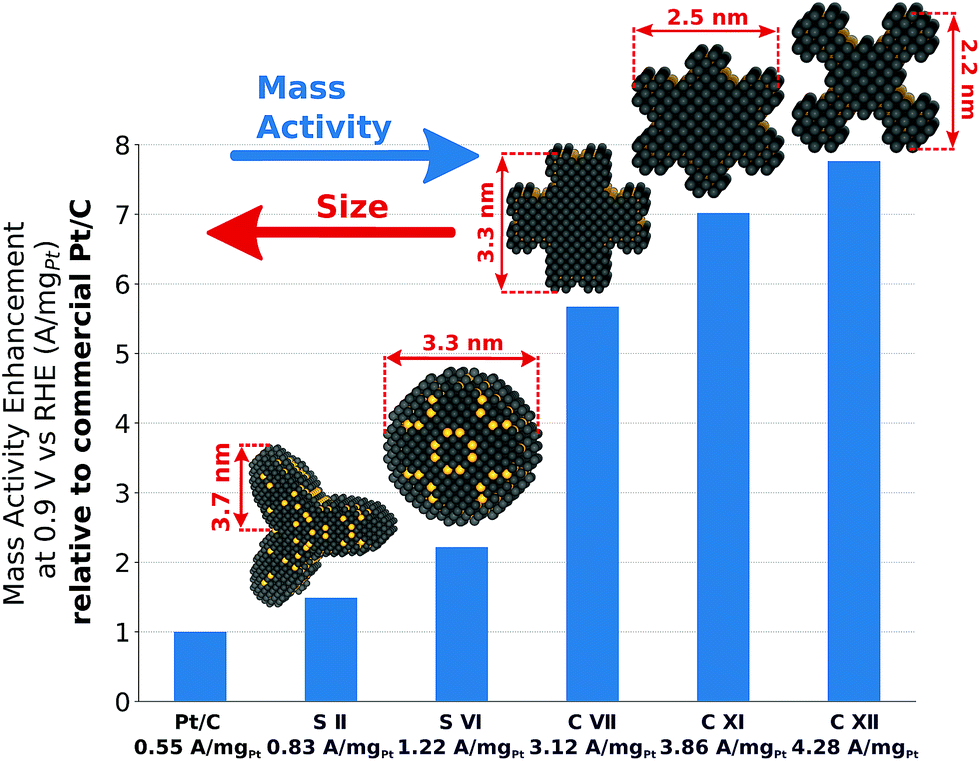 | ||
| Fig. 8 Mass activity enhancement of S II, S VI, C VII, C XI, and C XII over Tanaka commercial Pt/C electrocatalysts.32 | ||
The shape S VI achieves the highest mass activity enhancement among all sphere-like shapes investigated here. However, large structure sensitivity for similar sizes would necessitate narrow size distributions to reach in experiments the predicted mass activity of 1.22 A mgPt−1.
Because of active and abundant local site structures at concave nanostructure kinks, rod-like nanostructures are predicted to have remarkably high mass activities. Nonetheless, C VII exhibits large structure sensitivity, which may downgrade the high mass activity. In contrast, the two most mass-active electrocatalysts, namely C XI and C XII, feature controllable structure sensitivity and mass activity enhancements of ∼702% and ∼776% over Tanaka commercial Pt/C electrocatalysts. These structures are representative in the sense that high average mass activities from 2.7 A mgPt−1 to 3.7 A mgPt−1 are maintained upon possible structural variations.
It is noteworthy that similar nanocatalyst shapes of Pt-alloys have been presented before in experiments34,35 and in theoretical studies.26 The pure Pt nanocatalysts proposed in this study may likely be synthesized using templates, for which metal–organic frameworks are suitable.36 High-resolution transmission electron microscopy could be used to resolve their structures at the subnanoscale.37
Beside high mass activity and controllable structure sensitivity, electrocatalyst stability is a critical aspect in fuel cell environments. To account for high stability under ORR conditions, low-coordinated sites with cn < 6 are avoided, except for sites placed at the outer edge in z-direction of rod-like nanostructures (see Fig. S1†). Importantly, Kibsgaard et al. have investigated the stability of Pt mesostructures with respect to the site coordination.38 The fraction of edge sites and corner sites in such Pt mesostructures is determined to be 11%. The coordination of such sites, which is given in range of cn = 5 to cn = 7, is similar to the minimal coordination cn = 6 in our study. However, it has been shown experimentally that those Pt mesostructures feature increased stability over ETEK commercial Pt/C electrocatalysts. Hence, this experimental insight strongly suggests that the condition cn ≥ 6 for the sites of any electrocatalyst in our study is an appropriate constraint to achieve stable tailored nanostructured electrocatalysts. We further note that the above-mentioned stellated shapes,34,35 which contain Pt-rich shells and Ag-rich cores, are an indication for appropriate intrinsic stability of such shapes. Ref. 18 (and references therein) also shows that a variety of Pt-based concave nanoparticles can be synthesized experimentally, which are ORR active and fairly stable.
Conclusions
In this article, we have proposed a theoretical approach to identify pure Pt electrocatalysts with high ORR mass activities, appropriate mechanical stability and controllable structure sensitivity through careful variations in their sizes and shapes. The generalization of Gielis' Superformula in three dimensions is used to design a wide variety of symmetric shapes with tunable size, which are optimized toward highest mass activity by the particle swarm optimizer PARPSO.Our analysis of sphere-like nanoparticles predicts mass activities up to 1.22 A mgPt−1. Moreover, rod-like nanostructures are found to be over 3 times more active than sphere-like nanoparticles. For rod-like nanostructures, we predict mass activities up to 4.28 A mgPt−1, corresponding to a ∼7.8-fold enhancement over Tanaka commercial Pt/C electrocatalysts. Such high activities originate from numerous active sites located at concave kinks, which are tailored toward optimal coordination near  . Upon small size changes, the most active rod-like nanostructures retain high mass activities in some cases above 3.41 A mgPt−1. The comparison with recent experimental stability studies strongly suggests that the nanocatalysts proposed in this article are at least as stable as commercial Pt/C electrocatalysts.
In sum, the high predicted mass activities of pure Pt electrocatalysts from this study show great potential to reduce the Pt loading in PEMFCs. The chemical routes for synthesis, which are obtained from the size effect studies, may foster and support upcoming experimental works on pure Pt electrocatalysts.
Computational methods
Prediction of mass activities
A recently developed computational model performs rapid prediction of mass activities of nanostructured Pt electrocatalysts in absolute units of amperes per milligram.27 Within that computational model, catalytic activities are predicted upon evaluation of local site structures described by generalized coordination numbers .13–15,40 Particularly, the model involves
• a linear relation between  and *OH binding energies with respect to the gas phase from DFT studies and
• experimental ORR activities versus *OH binding energies given relatively to Pt(111), which are measured on pure Pt and Pt-alloy electrocatalysts.
The linear DFT relation is used to map the experimental *OH binding energies onto  , which yields the fitted volcano-shaped activity trend
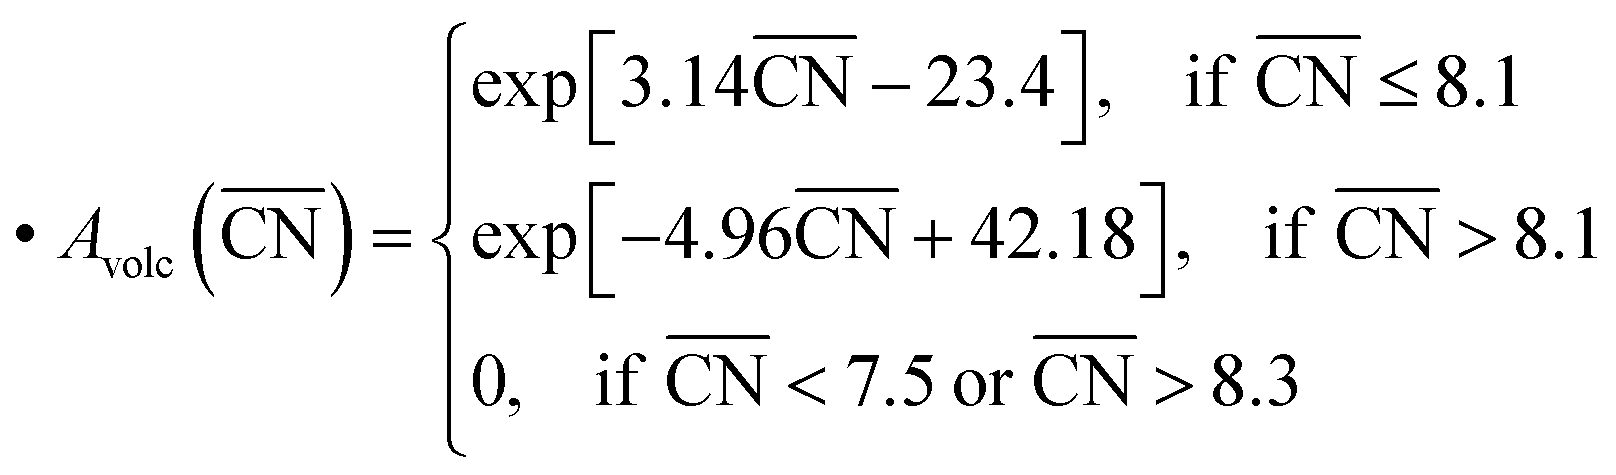 | (2) |
 . The highest activity contribution with respect to Pt(111) is given by
 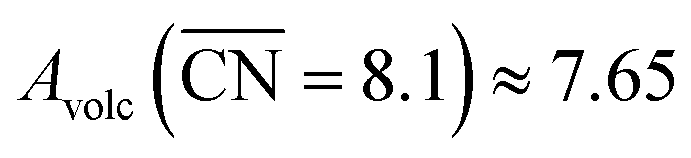 , where
  corresponds to a weakening of 0.115 eV in *OH binding energy relative to Pt(111). Since enhanced activities over Pt(111) are expected for sites with
  from the Sabatier analysis,13,15 activity contributions from sites with
  and
and  are neglected in Avolc (see also ref. 27 for a more detailed discussion). Hence, the edges of the volcano-shaped activity trend are given by Avolc (7.5) ≈ 1.16 and Avolc (8.3) ≈ 2.75.
Employing the Pt atomic mass mPt = 195.084 u, the site density on the Pt(111) surface dPt(111) = 1.503 × 1015 cm−2 and the specific activity jPt(111) = 2 mA cm−2 of Pt(111),13 mass activities are calculated by summing over activity contributions as
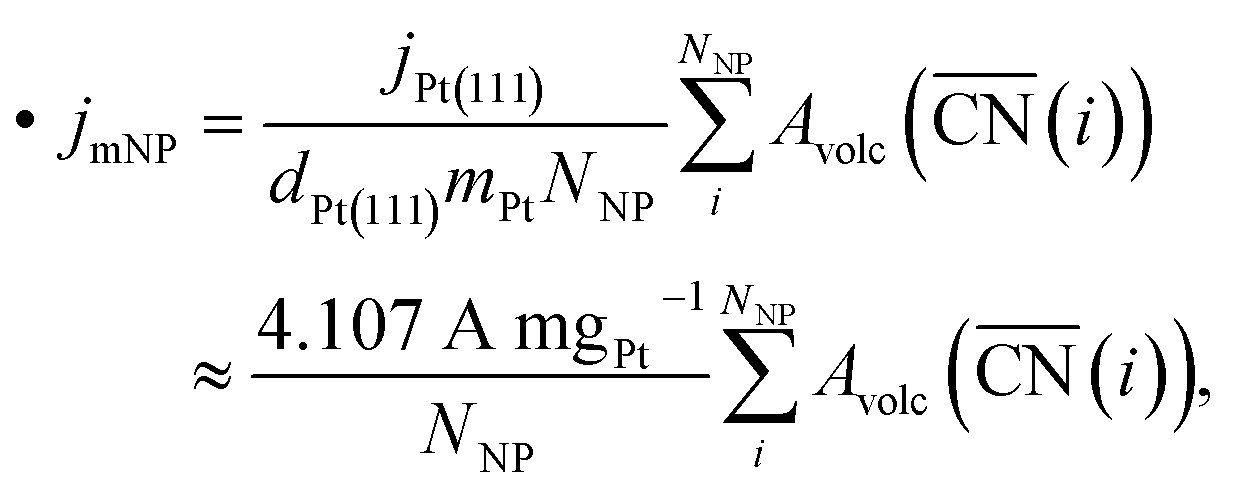 | (3) |
 .
.
Tailoring nanostructured Pt electrocatalysts
Gielis' Superformula provides a wide variety of shapes.28 A three-dimensional version of the Superformula has been applied on nanophotonic30 and dielectric29 materials. We introduce a generalization of the Superformula in three dimensions which fulfills C3 or C4 rotational symmetries with respect to the z-axis. All Superformula shapes are C2 symmetric around the x- and y-axes.Discrete surface meshes are constructed from shapes which are generated by the generalized Superformula. Surface meshes are used to cut the shape out of the Pt bulk. Note that the Pt fcc bulk structure is itself C4 symmetric such that C3 symmetric Superformula shapes do not generally yield C3 symmetric nanostructures. Furthermore, the discrete surface mesh points are not necessarily distributed in a symmetric arrangement which may lead to small symmetry deviations in the nanostructures. This feature is exploited to study structure sensitivity arising from asymmetrically added atoms.
Beyond that, low-coordinated sites with cn < 6 are strictly avoided, except for sites placed at the outer edges in z-direction of rod-like nanostructures (see ESI†). We use the Atomic Simulation Environment (ASE)39 for calculations and visualization of nanostructures.
The generalized Superformula in three dimensions is given by
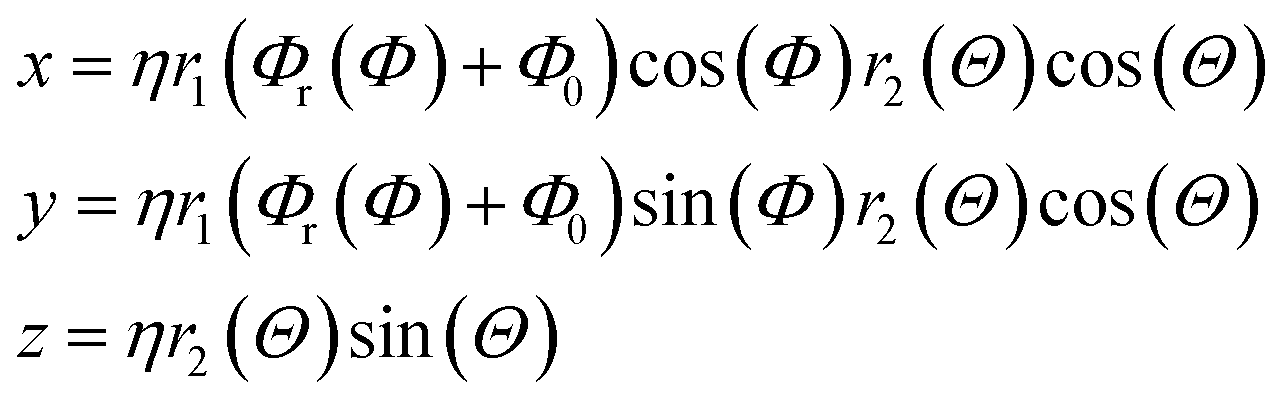 | (4) |
 | (5) |
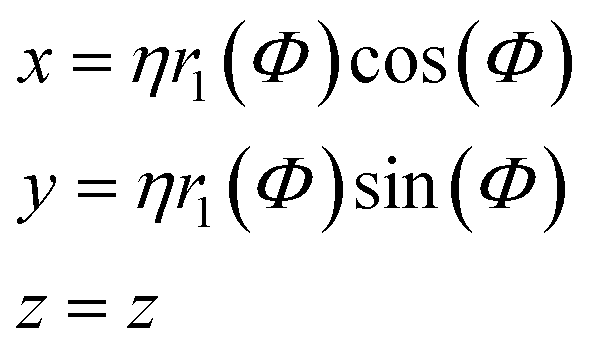
Since eqn (4) is related to spherical coordinates, nanostructures obtained from eqn (4) are referred to as sphere-like nanoparticles. The Superformula in eqn (4) comprises fourteen distinct parameters. Each six of them, i.e. m(Φ), n1(Φ), n2(Φ), n3(Φ), a(Φ), b(Φ) and m(Θ), n1(Θ), n2(Θ), n3(Θ), a(Θ), b(Θ) are associated with the azimuthal angle Φ and the altitude angle Θ, respectively. The size parameter η defines the size of the shape. The three dimensional space is spanned by Φ∈[−π, π] and Θ∈[−π/2, π/2].
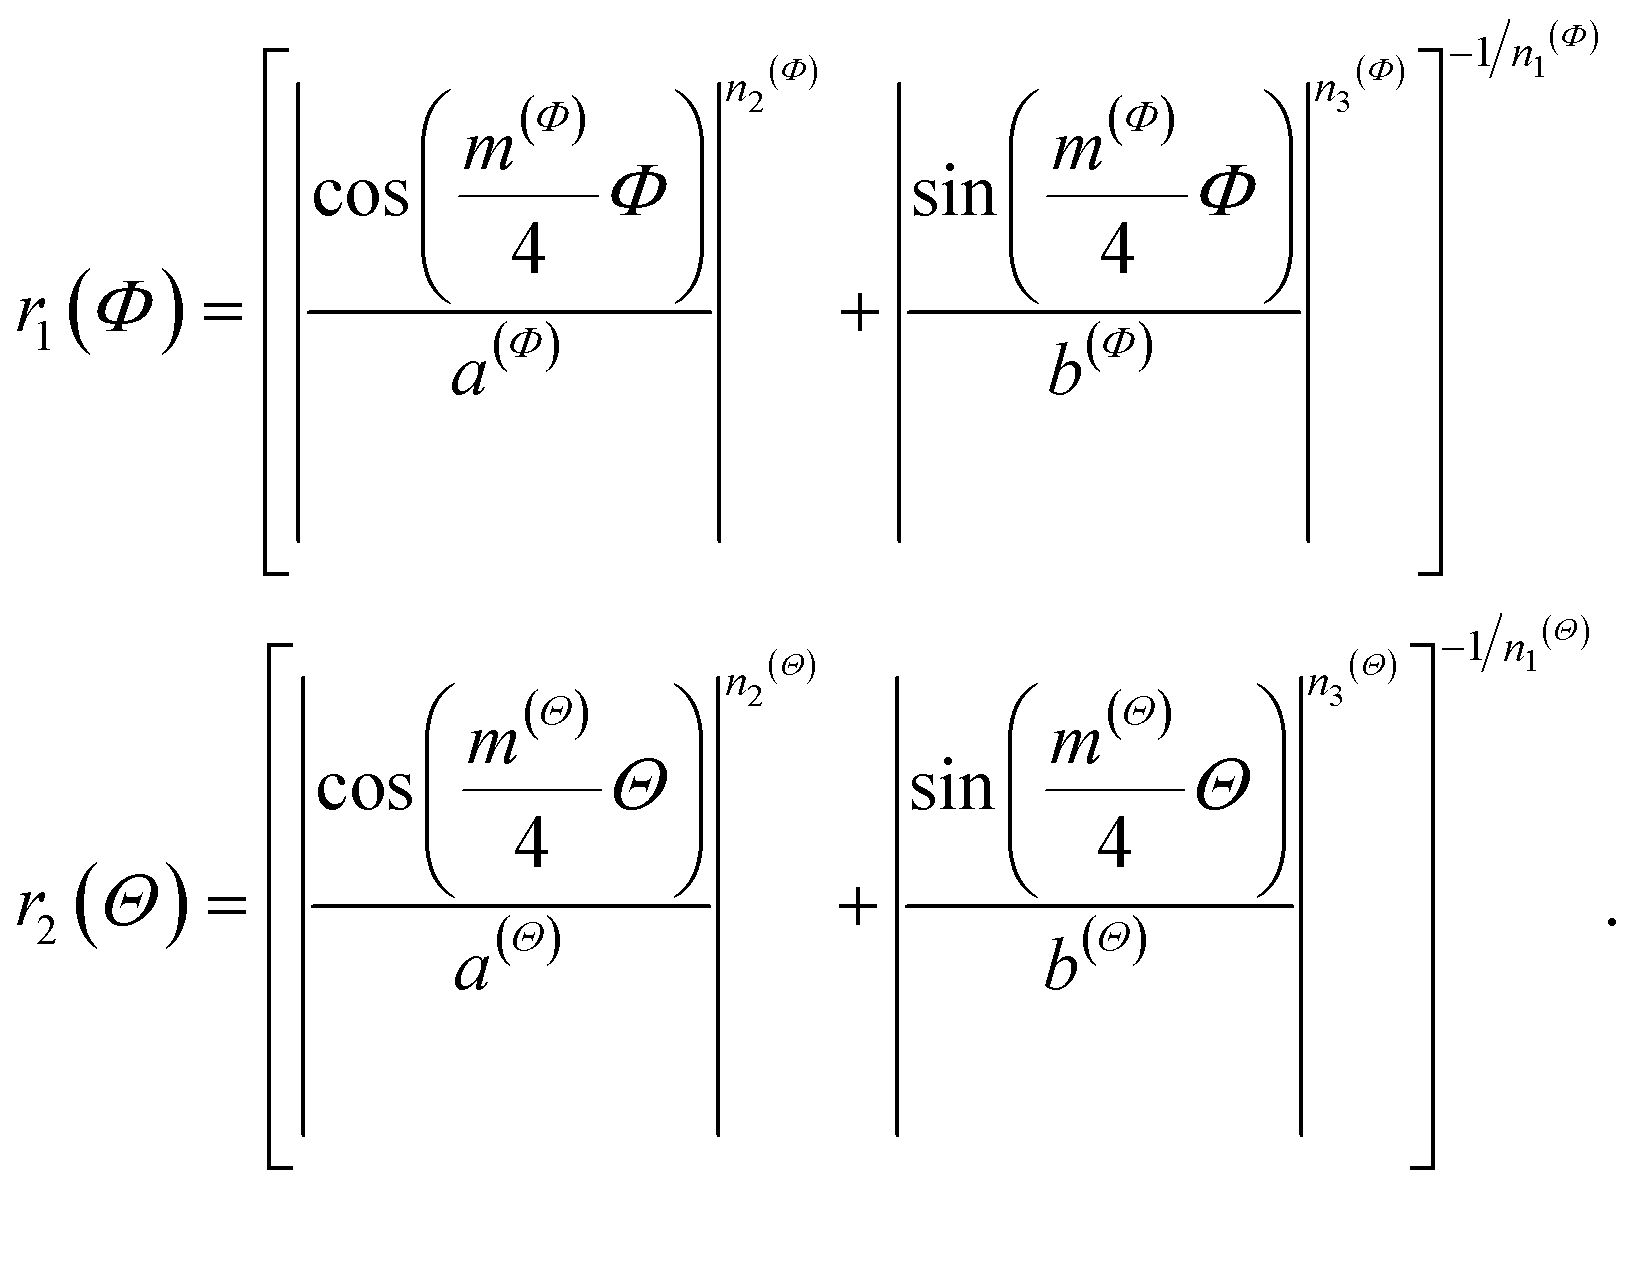
Since rotational symmetries may strongly facilitate experimental synthesis, we construct Superformula shapes which fulfill C3 and C4 symmetries. The functions
 | (6) |
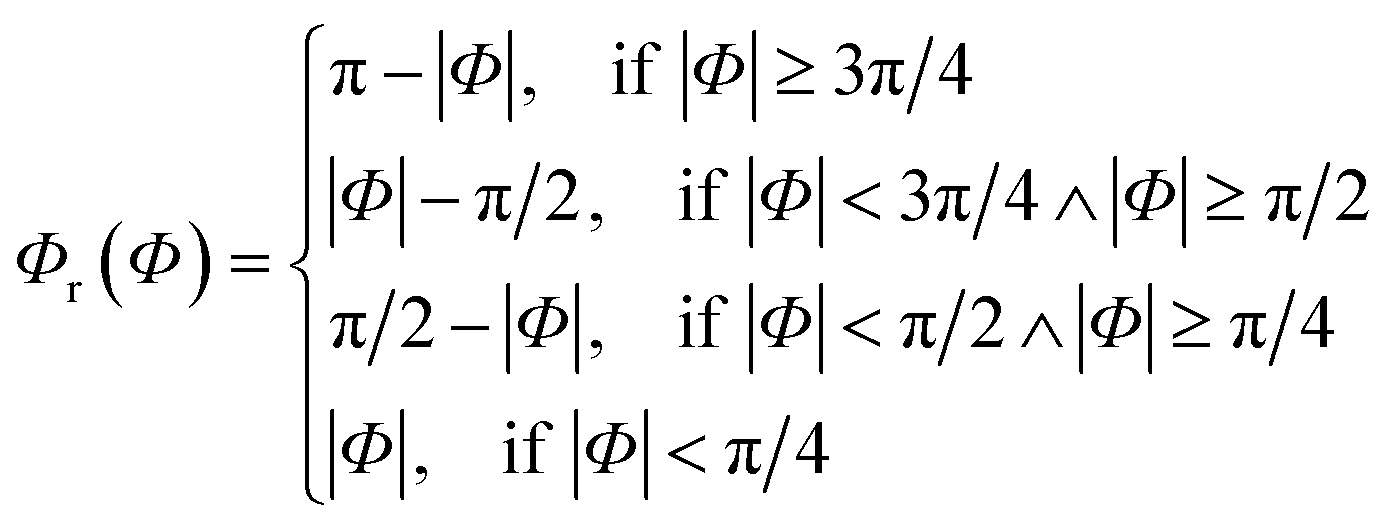 | (7) |
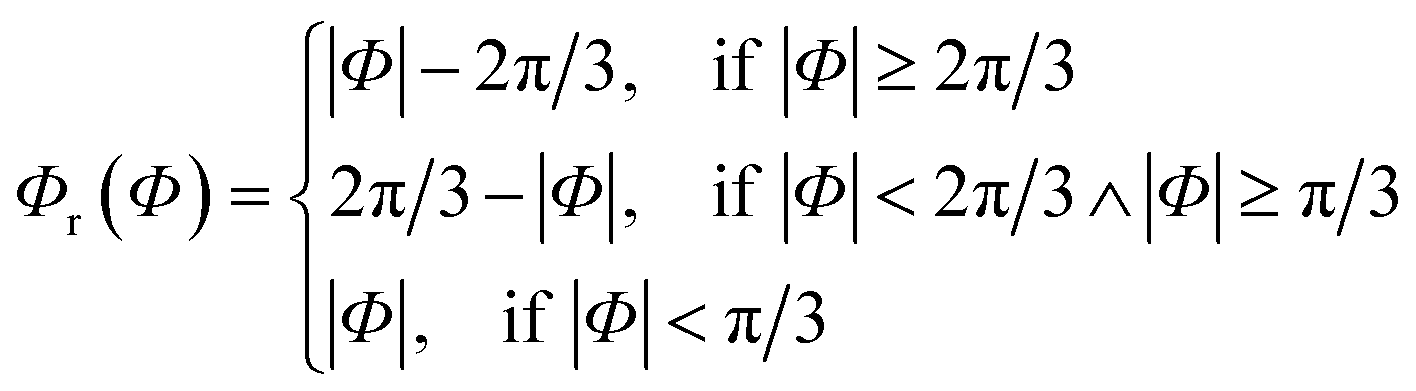
In addition to sphere-like nanoparticles, we investigate rod-like nanostructures generated by the Superformula
 | (8) |
For further details on the examined nanostructures and the associated Superformula parameters, we refer the reader to the ESI.†
Nanostructure screening and optimization
To identify the most mass-active nanostructures in the screenings of tailored nanostructures, we use Penalty Attractive and Repulsive Particle Swarm Optimization (PARPSO).31 Nanostructures are optimized toward highest mass activity, where the optimization scheme includes four major steps:(1) N = 50 parameter ensembles are initialized randomly. Note that each parameter ensemble comprises 14 parameters (for sphere-like nanoparticles) or 8 parameters (for rod-like nanostructures), which are involved in the two Superformulas in eqn (4) and (8).
(2) N = 50 nanostructures are constructed from the Superformula in eqn (4) for sphere-like nanoparticles or eqn (8) for rod-like nanostructures.
(3) Mass activities of all N = 50 nanostructures are determined by eqn (3).
(4) PARPSO slightly modifies the single parameters of all N nanoparticle ensembles toward optimized mass activity. This step is performed under the influence of random fluctuations and previous information about the mass activity, for which the mathematical details are presented below. Unless the maximum iteration kmax is reached, the algorithm continues with step 2.
For each screening, kmax = 604 to kmax = 800 iterative optimization steps are performed. Specific details about all screenings, including the optimized parameter ensembles, are provided in the ESI.† Thus, up to 40![[thin space (1/6-em)]](https://www.rsc.org/images/entities/char_2009.gif) 000 nanostructures are evaluated within one screening. Using parallel computing in each iterative step and rapid prediction of mass activities,27 one screening is performed within few days of computation time.
000 nanostructures are evaluated within one screening. Using parallel computing in each iterative step and rapid prediction of mass activities,27 one screening is performed within few days of computation time.
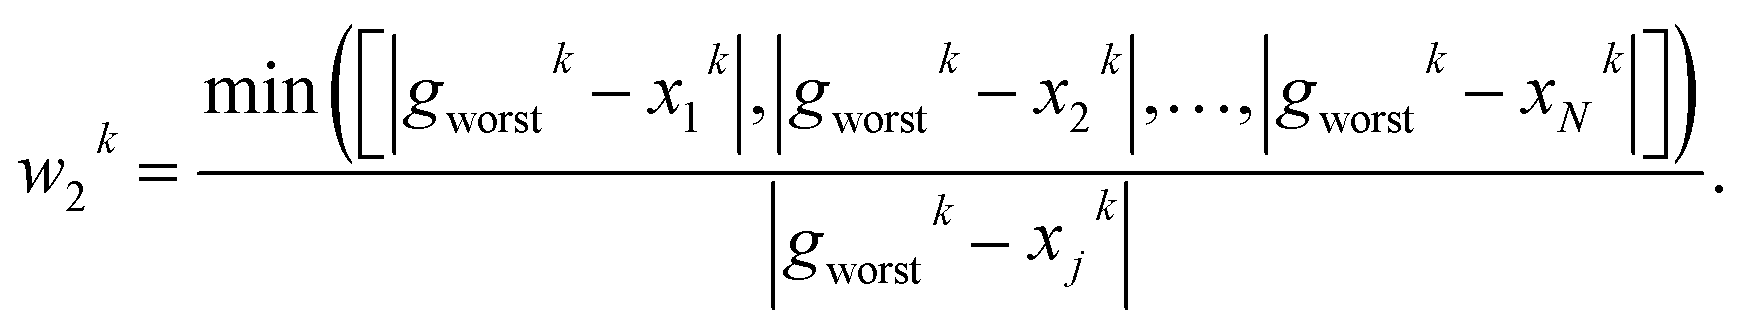
PARPSO considers three overall aspects to optimize nanostructures parameter ensembles toward highest mass activity in step 4. Each parameter ensemble xjk at iterative step k is optimized with respect to a tradeoff between the best parameters pbest,jk of each parameter ensemble and the overall best parameters gbestk out of all parameter ensembles. The variable dk, taking values 1 or −1, balances the search near pbest,jk against the search near gbestk. In addition, PARPSO involves a penalty factor w2 to repulse each parameter ensemble from the worst parameters gworstk out of all parameter ensembles.
In each iterative step k, each parameter ensemble is updated as xjk+1 = xjk + Vjk+1 with
| Vjk+1 = w1kVjk + dk+1[c1r1k(pbest,jk − xjk) + c2r2k(gbestk − xjk)] − w2kc3r3k(gworstk − xjk). | (9) |
The variable dk+1 is given by
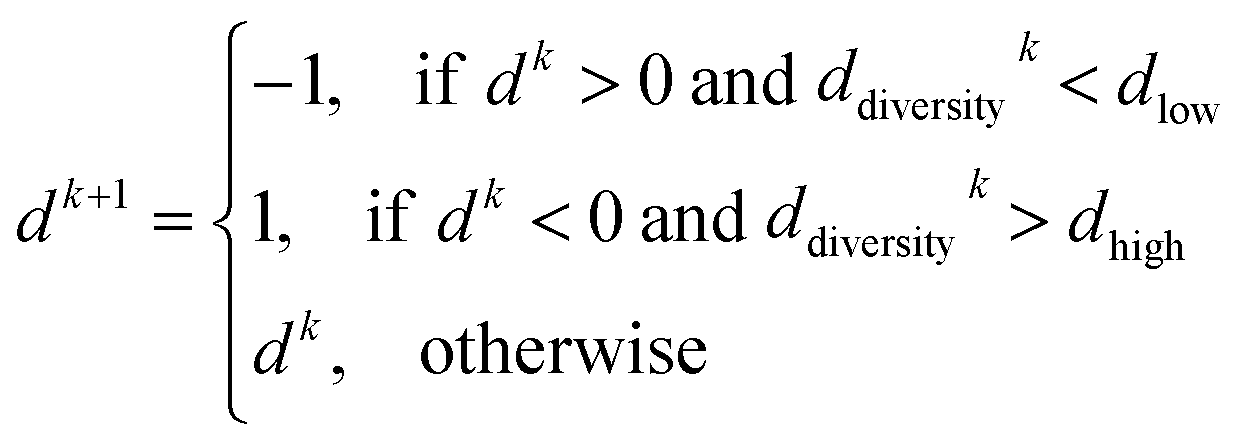 | (10) |
 | (11) |
 | (12) |
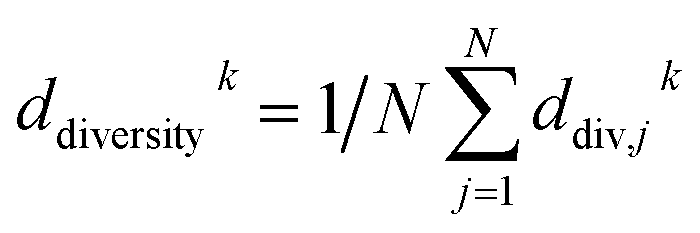
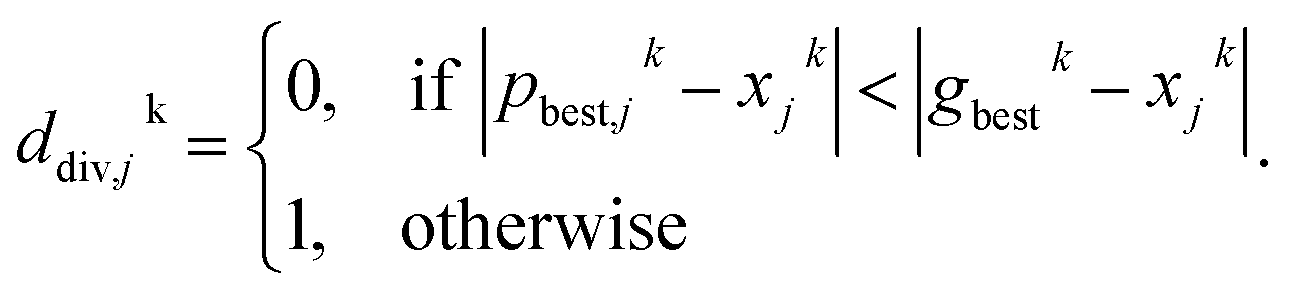
If most parameter ensembles are located near pbest,jk (gbestk), the diversity ddiversityk will take values near zero (one). Furthermore, the penalty factor w2k is given by
 | (13) |
The prefactor
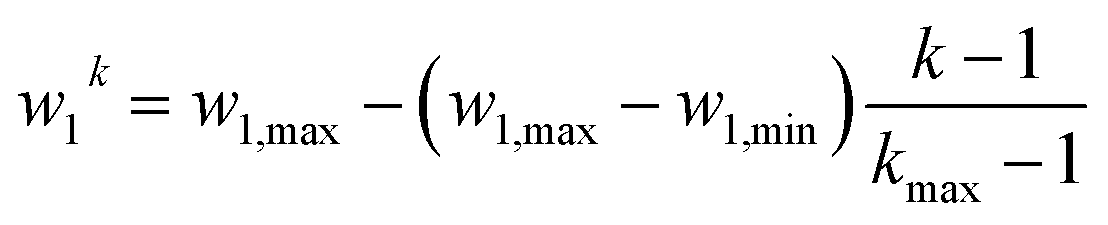 | (14) |
In this way, our high-throughput screening is highly focused on the search for the most mass-active electrocatalyst, though electrocatalysts with slightly lower mass activity are also taken into account. Ca. 175000 shapes are screened in total.
Nanostructure size effects
Changes in the nanostructure size upon varying the size parameter η in the Superformula are analyzed in this study. For sphere-like nanoparticles, the size measure corresponds to the largest distance between any two atoms of the nanostructure. For rod-like nanostructures, the size measure is defined as the largest distance between any two atoms in the x–y plane of the nanostructure. As discussed above, all nanostructures are obtained by cutting the Superformula shape out of the Pt fcc bulk. Low-coordinated sites with cn < 6 are avoided, except for sites located at the outer edges in the z-direction of rod-like nanostructures (see ESI†).Conflicts of interest
There are no conflicts to declare.Acknowledgements
This work is supported by the German Research Foundation (DFG) under Grant No. 355784621 and the excellence cluster Nanosystems Initiative Munich (NIM) of the DFG. F. C. V thanks the Spanish MICIU for a Ramón y Cajal research contract (RYC-2015-18996) and financial support through the program “Units of Excellence María de Maeztu” (grant MDM-2017-0767).Notes and references
- I. E. L. Stephens, J. Rossmeisl and I. Chorkendorff, Science, 2016, 354, 1378–1379 CrossRef CAS PubMed.
- P. Strasser, M. Gliech, S. Kuehl and T. Moeller, Chem. Soc. Rev., 2018, 47, 715–735 RSC.
- C. Cui, L. Gan, H. H. Li, S. H. Yu, M. Heggen and P. Strasser, Nano Lett., 2012, 12, 5885–5889 CrossRef CAS PubMed.
- S. I. Choi, S. Xie, M. Shao, J. H. Odell, N. Lu, H. C. Peng, L. Protsailo, S. Guerrero, J. Park, X. Xia, J. Wang, M. J. Kim and Y. Xia, Nano Lett., 2013, 13, 3420–3425 CrossRef CAS PubMed.
- C. Chen, Y. Kang, Z. Huo, Z. Zhu, W. Huang, H. L. Xin, J. D. Snyder, D. Li, J. A. Herron, M. Mavrikakis, M. Chi, K. L. More, Y. Li, N. M. Markovic, G. A. Somorjai, P. Yang and V. R. Stamenkovic, Science, 2014, 343, 1339–1343 CrossRef CAS PubMed.
- J. K. Nørskov, J. Rossmeisl, A. Logadottir, L. Lindqvist, J. R. Kitchin, T. Bligaard and H. Jónsson, J. Phys. Chem. B, 2004, 108, 17886–17892 CrossRef.
- V. Stamenkovic, B. S. Mun, K. J. Mayrhofer, P. N. Ross, N. M. Markovic, J. Rossmeisl, J. Greeley and J. K. Nørskov, Angew. Chem., Int. Ed., 2006, 45, 2897–2901 CrossRef CAS PubMed.
- J. Greeley, I. E. L. Stephens, A. S. Bondarenko, T. P. Johansson, H. A. Hansen, T. F. Jaramillo, J. Rossmeisl, I. Chorkendorff and J. K. Nørskov, Nat. Chem., 2009, 1, 552–556 CrossRef CAS PubMed.
- I. E. L. Stephens, A. S. Bondarenko, F. J. Perez-Alonso, F. Calle-Vallejo, L. Bech, T. P. Johansson, A. K. Jepsen, R. Frydendal, B. P. Knudsen, J. Rossmeisl and I. Chorkendorff, J. Am. Chem. Soc., 2011, 133, 5485–5491 CrossRef CAS PubMed.
- I. E. L. Stephens, A. S. Bondarenko, U. Grønbjerg, J. Rossmeisl and I. Chorkendorff, Energy Environ. Sci., 2012, 5, 6744–6762 RSC.
- V. Čolić and A. S. Bandarenka, ACS Catal., 2016, 6, 5378–5385 CrossRef.
- M. Escudero-Escribano, P. Malacrida, M. H. Hansen, U. G. Vej-Hansen, A. Velázquez-Palenzuela, V. Tripkovic, J. Schiøtz, J. Rossmeisl, I. E. L. Stephens and I. Chorkendorff, Science, 2016, 352, 73–76 CrossRef CAS PubMed.
- F. Calle-Vallejo, J. Tymoczko, V. Colic, Q. H. Vu, M. D. Pohl, K. Morgenstern, D. Loffreda, P. Sautet, W. Schuhmann and A. S. Bandarenka, Science, 2015, 350, 185–189 CrossRef CAS PubMed.
- F. Calle-Vallejo, J. I. Martínez, J. M. García-Lastra, P. Sautet and D. Loffreda, Angew. Chem., Int. Ed., 2014, 53, 8316–8319 CrossRef CAS PubMed.
- F. Calle-Vallejo, M. D. Pohl, D. Reinisch, D. Loffreda, P. Sautet and A. S. Bandarenka, Chem. Sci., 2017, 8, 2283–2289 RSC.
- F. Calle-Vallejo and A. Bandarenka, ChemSusChem, 2018, 11, 1824–1828 CrossRef CAS PubMed.
- G. G. Asara, L. O. Paz-Borbón and F. Baletto, ACS Catal., 2016, 6, 4388–4393 CrossRef CAS.
- R. Chattot, O. Le Bacq, V. Beermann, S. Kühl, J. Herranz, S. Henning, L. Kühn, T. Asset, L. Guétaz, G. Renou, J. Drnec, P. Bordet, A. Pasturel, A. Eychmüller, T. J. Schmidt, P. Strasser, L. Dubau and F. Maillard, Nat. Mater., 2018, 17, 827–833 CrossRef CAS PubMed.
- P. Strasser, S. Koh, T. Anniyev, J. Greeley, K. More, C. Yu, Z. Liu, S. Kaya, D. Nordlund, H. Ogasawara, M. F. Toney and A. Nilsson, Nat. Chem., 2010, 2, 454–460 CrossRef CAS PubMed.
- S. E. Temmel, E. Fabbri, D. Pergolesi, T. Lippert and T. J. Schmidt, ACS Catal., 2016, 6, 7566–7576 CrossRef CAS.
- Y. J. Deng, V. Tripkovic, J. Rossmeisl and M. Arenz, ACS Catal., 2016, 6, 671–676 CrossRef CAS.
- E. Antolini and J. Perez, J. Mater. Sci., 2011, 46, 4435–4457 CrossRef CAS.
- V. Tripković, I. Cerri, T. Bligaard and J. Rossmeisl, Catal. Lett., 2014, 144, 380–388 CrossRef.
- F. J. Perez-Alonso, D. N. McCarthy, A. Nierhoff, P. Hernandez-Fernandez, C. Strebel, I. E. L. Stephens, J. H. Nielsen and I. Chorkendorff, Angew. Chem., Int. Ed., 2012, 51, 4641–4643 CrossRef CAS PubMed.
- G. A. Tritsaris, J. Greeley, J. Rossmeisl and J. K. Nørskov, Catal. Lett., 2011, 141, 909–913 CrossRef CAS.
- K. Rossi, G. G. Asara and F. Baletto, Phys. Chem. Chem. Phys., 2018, 21, 4888–4898 RSC.
- M. Rück, A. Bandarenka, F. Calle-Vallejo and A. Gagliardi, J. Phys. Chem. Lett., 2018, 9, 4463–4468 CrossRef PubMed.
- J. Gielis, Am. J. Bot., 2003, 90, 333–338 CrossRef PubMed.
- S. Huclova, D. Erni and J. Fröhlich, J. Phys. D: Appl. Phys., 2010, 43, 365405 CrossRef.
- C. Forestiere, Y. He, R. Wang, R. M. Kirby and L. Dal Negro, ACS Photonics, 2016, 3, 68–78 CrossRef CAS.
- M. K. Baek, J. B. Park and K. Y. Lee, IFAC-PapersOnLine, 2016, 49, 284–289 CrossRef.
- A. Orfanidi, P. Madkikar, H. A. El-Sayed, G. S. Harzer, T. Kratky and H. A. Gasteiger, J. Electrochem. Soc., 2017, 164, F418–F426 CrossRef CAS.
- S. I. Sanchez, L. D. Menard, A. Bram, J. H. Kang, M. W. Small, R. G. Nuzzo and A. I. Frenkel, J. Am. Chem. Soc., 2009, 131, 7040–7054 CrossRef CAS PubMed.
- H. Liu, F. Ye, Q. Yao, H. Cao, J. Xie, J. Y. Lee and J. Yang, Sci. Rep., 2014, 4, 3969 CrossRef PubMed.
- Y. Feng, F. Ye, H. Liu and J. Yang, Sci. Rep., 2015, 5, 1–11 CAS.
- R.-K. Huang, S.-S. Wang, D.-X. Liu, X. Li, J.-M. Song, Y.-H. Xia, D.-D. Zhou, J. Huang, W.-X. Zhang and X.-M. Chen, J. Am. Chem. Soc., 2019, 141, 5645–5649 CrossRef CAS PubMed.
- J. Fichtner, B. Garlyyev, S. Watzele, H. A. El-Sayed, J. N. Schwämmlein, W. J. Li, F. M. Maillard, L. Dubau, J. Michalička, J. M. Macak, A. Holleitner and A. S. Bandarenka, ACS Appl. Mater. Interfaces, 2019, 11, 5129–5135 CrossRef CAS PubMed.
- J. Kibsgaard, Y. Gorlin, Z. Chen and T. F. Jaramillo, J. Am. Chem. Soc., 2012, 134, 7758–7765 CrossRef CAS PubMed.
- A. H. Larsen, J. J. Mortensen, J. Blomqvist, I. E. Castelli, R. Christensen, M. Dułak, J. Friis, M. N. Groves, B. Hammer, C. Hargus, E. D. Hermes, P. C. Jennings, P. B. Jensen, J. Kermode, J. R. Kitchin, E. L. Kolsbjerg, J. Kubal, K. Kaasbjerg, S. Lysgaard, J. B. Maronsson, T. Maxson, T. Olsen, L. Pastewka, A. Peterson, C. Rostgaard, J. Schiøtz, O. Schütt, M. Strange, K. S. Thygesen, T. Vegge, L. Vilhelmsen, M. Walter, Z. Zeng and K. W. Jacobsen, J. Phys.: Condens. Matter, 2017, 29, 273002 CrossRef PubMed.
- F. Calle-Vallejo, P. Sautet and D. Loffreda, J. Phys. Chem. Lett., 2014, 5, 3120–3124 CrossRef CAS PubMed.
Footnote |
† Electronic supplementary information (ESI) available: Details on the rod-like nanostructures, the screenings, the parameter ensembles, and the nanostructures from the size effect studies including  distributions are provided. See DOI: 10.1039/c9na00252a distributions are provided. See DOI: 10.1039/c9na00252a |
| This journal is © The Royal Society of Chemistry 2019 |