 Open Access Article
Effect of graphene oxide (GO) nanosheet sizes, pinhole defects and non-ideal lamellar stacking on the performance of layered GO membranes: an atomistic investigation†
Abhijit
Gogoi
 a,
Aditya
Koneru
b and
K.
Anki Reddy
 *b
*b
aDepartment of Mechanical Engineering, Indian Institute of Technology, Guwahati, Assam, India
bDepartment of Chemical Engineering, Indian Institute of Technology, Guwahati, Assam, India. E-mail: anki.reddy@iitg.ac.in; Fax: +91 361 2582291; Tel: +91 361 258 3532
First published on 28th May 2019
Abstract
The effect of non-idealities, namely pinhole defects and non-ideal lamellar stacking of nanosheets, on the performance of size-differentiated graphene oxide (GO) laminates is investigated using equilibrium molecular dynamics (MD) simulations. With the increase in sizes of the constituent GO nanosheets the water permeability of the layered GO membranes decreases and salt rejection increases. But with the inclusion of non-idealities the difference in water permeability between these membranes substantially reduced. The pinholes on the GO nanosheets provide shorter routes for trans-sheet flow, thereby increasing the water permeability of the membranes. The non-ideal stacking of the nanosheets without pinhole defects results in slight reduction in water permeability because of blockage of permeation pathways inside the membranes. However, with pinhole defects non-ideal stacking becomes favorable for water permeation through the layered GO membranes; as this time the non-ideal stacking leads to formation of voids inside the membranes, which act as routes for shorter permeation pathways. The effect of these non-idealities is more significant for layered GO membranes composed of large GO nanosheets. Although the water permeability through the layered GO membrane is greatly enhanced because of these non-idealities (about 10 times), the corresponding variation in the salt rejection is very low (<2%).
Introduction
Water scarcity is one of the most crucial challenges encountered by today's human civilization. Although 71% of the earth's surface is covered with water the amount of useable/accessible water is very low (<0.3%). With the explosive growth of human population and rapid industrialization the demand for useable water is continuously increasing. This urges the research community to look for efficient sea water desalination/water purification techniques which can provide a long term solution to this critical problem. Out of these techniques, membrane based separation technology has emerged as one of the most reliable and convenient approaches to counteract the global water crisis.1,2 In recent years nanoporous two-dimensional (2D) materials such as graphene, graphene oxide (GO), and molybdenum disulfide have gained considerable research interest for highly selective separation applications.3–9 GO is a chemical derivative of graphite which is rich in oxygen containing functional groups (hydroxyl, epoxy, carboxyl, etc.) and has extensively been studied in recent years for membrane based separation applications.10–17 GO membranes preferentially have a laminate structure with a nanometer scale interlayer distance.18–20 The spacing inside the interlayer gallery of these GO laminates acts as a nanocapillary through which water and other molecules/ions can selectively permeate through.21–23 The functional groups and interlayer separation of a layered GO membrane can aptly be tuned for specific separation applications.24–27Previous investigations on GO membranes attributed them with extraordinary separation capability with high water flux and mechanical strength.20,28,29 However, the behaviour or mechanism of water flow through the lamellar structure of a GO membrane is still not fully explored.30 The fast water permeation through the layered GO membrane was attributed to the presence of unoxidized pristine graphene regions inside the interlayer gallery of layered GO membranes.31 But extensive experimental studies show that the area of unoxidized pristine graphene regions present inside the interlayer gallery of layered GO membranes is only about 16% of the total surface area and they are highly scattered.32–35 So it is very unlikely that the high water permeability through layered GO membranes corresponds to the frictionless interaction between the atomically smooth, hydrophobic carbon structures alone. Recent atomistic simulation studies also support this notion.36–38
The performance of a layered GO membrane also depends on the size of the constituent GO nanosheets. With the increase in the size of the GO nanosheets the water permeability of the layered GO membrane decreases and its salt rejection increases.36,37,39 Very recently it was reported that with the inclusion of non-idealities in layered GO membranes, there is substantial reduction in the difference in water permeability of the size-differentiated GO laminates by the experimental and simulation (using finite element analysis) study of Saraswat et al.30 The two major factors (or non-idealities) contributing to this scenario are
• Pinhole defects on the constituent GO nanosheets: pinhole defects located on the GO nanosheets can play a pivotal role in water permeation through layered GO membranes by providing a shorter route for trans-sheet flow.30,32,40
• Imperfect stacking of the GO nanosheets: the ideal (or perfect) lamellar stacking of GO nanosheets in layered GO membranes may not be possible in practical scenarios. This may lead to the presence of voids and disordered micro-structures in the layered GO membrane which can serve as alternate permeation pathways/blockages inside the layered GO membrane.21,30,37,41,42
So, to get an meticulous insight into the water permeability of the layered GO membrane, the consideration of these non-idealities is very much crucial. However in most of the previously reported atomistic simulations on GO membranes, these non-idealities were not taken into consideration.36,37,43–46 In the present study we investigate the effect of these non-idealities on the performance of the layered GO membrane using equilibrium molecular dynamics (MD) simulations. The effect of the non-ideality (i.e. pinhole defect or non-ideal lamellar stacking or both) on the size-differentiated GO laminates has also been investigated in detail. To model the size-differentiated GO laminates three different configurations of layered GO membranes are considered which differ in the pore offset distance (W). A larger value of W indicates layered GO membranes composed of GO nanosheets of larger lateral dimensions and vice versa.36,37,39 For each of the three membrane configurations (which differ in the value of W) four different scenarios have been studied to get a comparative estimation of the effect of the non-idealities on the performance of layered GO membranes. The four different scenarios are as follows: (a) no pinhole defects and the nanosheets are ideally stacked together, (b) no pinhole defects with non-ideal lamellar stacking, (c) pinhole defects but the nanosheets are ideally stacked together, and (d) pinhole defects with non-ideal lamellar stacking. MD simulations prove to be a handy tool in this aspect as it provides a consistent way to make a comparative study on the effect of these non-idealities on the performance of layered GO membranes.
Methodology
Membrane construction
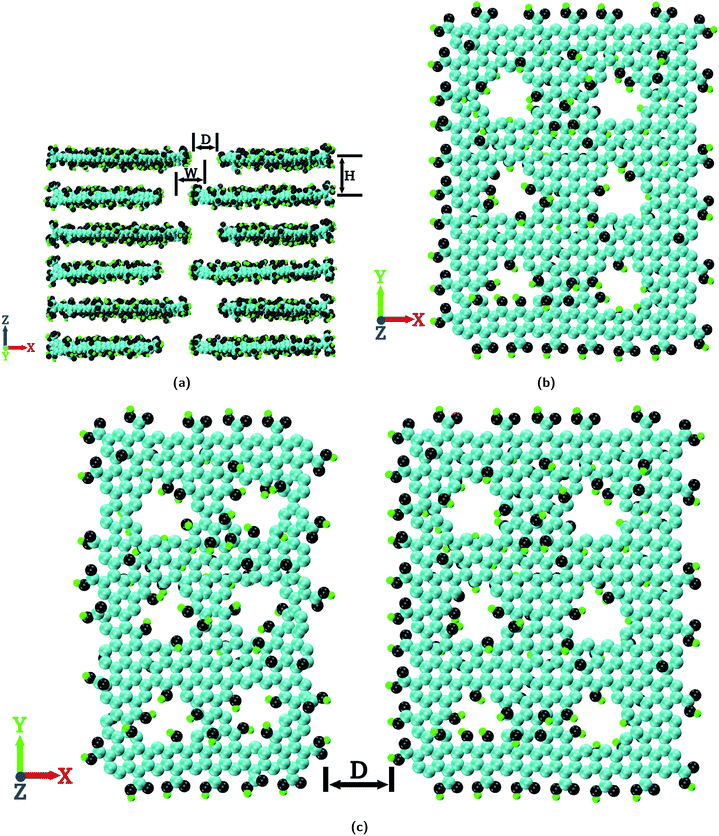
The chemical composition of the GO nanosheets considered in the present study is C10O1(OH)1(COOH)0.5 (ref. 47 and 48) where the hydroxyl and epoxy functional groups are located on the basal plane of the GO nanosheets and the carboxyl functional groups are located on the edges. With this chemical composition, GO nanosheets of different sizes are constructed using the Visual Molecular Dynamics (VMD) package.49 A representative image of the GO nanosheets is shown in Fig. S1a of the ESI.† The sizes of the GO nanosheets are 23.0 × 49.0 Å2, 31.0 × 49.0 Å2, 39.0 × 49.0 Å2 and 47.0 × 49.0 Å2. These GO nanosheets are arranged in space to construct the layered GO membrane as shown in Fig. 1a.The membrane shown in Fig. 1a is the most ideal one to be considered where there are no pinhole defects on the GO nanosheets and the GO nanosheets are ideally (or perfectly) aligned i.e. an ideal lamellar structure (IL). As can be seen from Fig. 1a, for a layered GO membrane there are 3 basic geometric parameters; D, W and H which are termed the pore width, pore offset distance and interlayer distance, respectively. In this study we consider three different values of W, viz., 0.0 Å, 8.0 Å and 24.0 Å. A layered GO membrane with W = 0.0 Å resembles a GO membrane composed of GO nanosheets of smaller lateral dimensions, a GO membrane with W = 8.0 Å resembles a membrane composed of GO nanosheets of medium lateral dimensions and a membrane with W = 24.0 Å resembles a membrane composed of GO nanosheets of large lateral dimensions.36,37,39 In the present study the values of D and H are the same for all the membrane configurations which are 7.0 × 49.0 Å2 and 10.0 Å, respectively.3,36,37,39,50
For the construction of layered GO membranes with pinhole defects, GO nanosheets which contain pinholes (or pores) on the basal plane are constructed as shown in Fig. 1b. The effective diameter of these pinhole defects is 5.0 Å.51 The edges of these pinhole defects are functionalized with hydroxyl groups.46,52 The number of pores in each GO nanosheet are considered in such a way that each layer of the GO membrane contains 12 such pores (or pinholes). This is the case of maximum possible pinhole defects present in a single layer of the GO membrane in the timescale of the present simulation study as shown in Fig. 1c.
The membranes thus constructed are then hydrated in a water box of size 77.0 × 49.0 × 58.0 Å3 which contains 6300 water molecules. The water molecules within 2.0 Å of GO nanosheets are removed. Then energy minimization is performed on this hydrated membrane. After energy minimization the hydrated membrane is equilibrated for 10.0 ns at a temperature of 300.0 K and 1.0 atm pressure (NPT ensemble). During this equilibration run the GO nanosheets are constrained with a force constant of 1.0 kcal mol−1 Å−2 to maintain the ideal lamellar structure of the layered GO membrane. All the simulations reported in the present study are performed with the NAMD53 package using OPLS-AA force field parameters54 with a time step of 1.0 fs. The water molecules are modeled with the TIP3P water model55 and their bond lengths are constrained using the SETTLE algorithm.56 The van der Waals interactions are computed using the Lennard-Jones potential with a cut off distance of 12.0 Å. The long range electrostatic interactions are computed using the Particle Mesh Ewald (PME) method.57 For controlling the pressure, a modified Nosé–Hoover method is used where the barostat oscillation time and damping factors were both set to 0.3 ps. Temperature is controlled by using Langevin dynamics with a damping factor of 5 ps−1.
We also considered layered GO membrane configurations where the GO nanosheets are not perfectly stacked together (GO nanosheets are not perfectly parallel to each other or a non-ideal lamellar structure) for both the cases, i.e., without pinhole defects and with pinhole defects.
To construct non-ideal lamellar stacked hydrated GO membranes, during the 10.0 ns equilibration of the membranes (both with and without pinhole defects) only the GO nanosheets at the two ends (i.e., top and bottom) are constrained. All other GO nanosheets in between the top and bottom GO layers are allowed to move freely during this equilibration run. This gives a non ideal lamellar stacked hydrated GO membrane either with pinhole defects or without pinhole defects as shown in Fig. S2–S7 of the ESI.† The geometric configurations of the layered GO membranes considered in the present study and their corresponding abbreviations are tabulated in Table 1
| Membrane abbreviations | Geometric configuration of the membrane | ||
|---|---|---|---|
| W (Å) | Pinhole defects | Lamellar stacking | |
| 0-NP-IL | 0.0 | No | Ideal |
| 0-NP-nIL | 0.0 | No | Non-ideal |
| 0-P-IL | 0.0 | Yes | Ideal |
| 0-P-nIL | 0.0 | Yes | Non-ideal |
| 8-NP-IL | 8.0 | No | Ideal |
| 8-NP-nIL | 8.0 | No | Non-ideal |
| 8-P-IL | 8.0 | Yes | Ideal |
| 8-P-nIL | 8.0 | Yes | Non-ideal |
| 24-NP-IL | 24.0 | No | Ideal |
| 24-NP-nIL | 24.0 | No | Non-ideal |
| 24-P-IL | 24.0 | Yes | Ideal |
| 24-P-nIL | 24.0 | Yes | Non-ideal |
The atomistic simulation has an advantage in this aspect as we can maintain consistency in the preparation of the layered GO membrane with non-ideal lamellar stacking. In the present study the non-ideal lamellar stacked GO membranes are prepared using the same procedure in a deterministic way using MD simulations, in which the GO nanosheets (except at the top and bottom layers of the membrane) of the layered GO membranes are allowed to move freely in the 10.0 ns NPT equilibration run as mentioned earlier. This provides a consistent way to investigate the effect of pinhole defects and non-ideal lamellar stacking of GO nanosheets on the performance of the layered GO membrane along with the pore offset distance W. In other words, we will be able to investigate, how significant are the effects of pinhole defects and non-ideal lamellar stacking on the performance of the layered GO membrane as the size of the constituent GO nanosheets (or W) of the membrane increases/decreases.
Simulation system and methodology
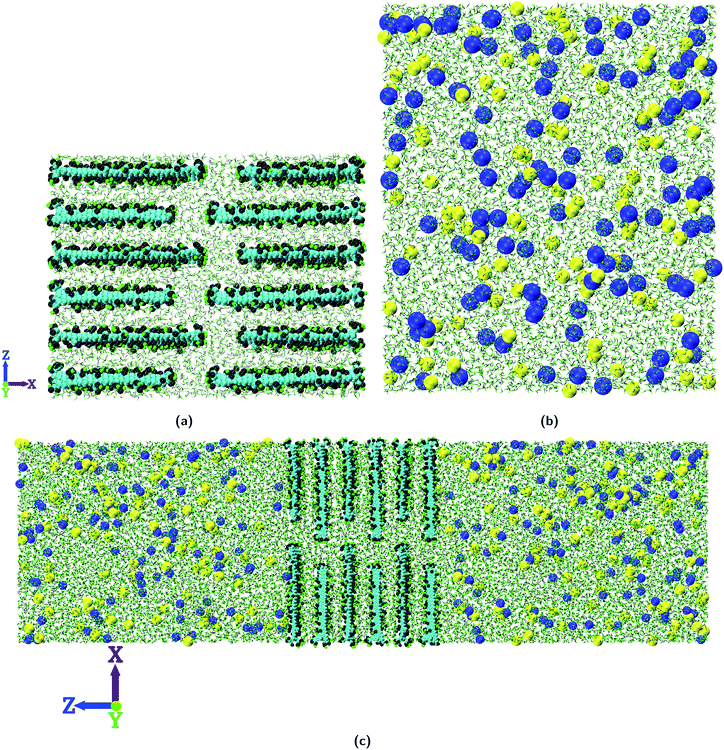
After the construction of the hydrated membranes, each of them is sandwiched between two equilibrated NaCl solutions (10![[thin space (1/6-em)]](https://www.rsc.org/images/entities/char_2009.gif) 000 water molecules with 108 NaCl molecules, 0.56 M solution) to construct the simulation system as shown in Fig. 2. The simulation system is first energy minimized and then equilibrated at a temperature of 300.0 K and 1.0 atm pressure (NPT ensemble) for 1.0 ns. Finally the production run is carried out at a constant temperature of 300.0 K (NVT ensemble) for 40 ns with a time step of 1.0 fs. The GO nanosheets are constrained to their initial positions with a force constant of 1.0 kcal mol−1 Å−2 in both the equilibration and production run. Periodic boundary conditions (PBC) are applied in all the three independent directions (i.e., X, Y, and Z) and simulation data are stored every 20 ps for post-processing.
000 water molecules with 108 NaCl molecules, 0.56 M solution) to construct the simulation system as shown in Fig. 2. The simulation system is first energy minimized and then equilibrated at a temperature of 300.0 K and 1.0 atm pressure (NPT ensemble) for 1.0 ns. Finally the production run is carried out at a constant temperature of 300.0 K (NVT ensemble) for 40 ns with a time step of 1.0 fs. The GO nanosheets are constrained to their initial positions with a force constant of 1.0 kcal mol−1 Å−2 in both the equilibration and production run. Periodic boundary conditions (PBC) are applied in all the three independent directions (i.e., X, Y, and Z) and simulation data are stored every 20 ps for post-processing.
Results and discussion
Using equilibrium MD simulations the water permeation events through the layered GO membranes of different geometric configurations are computed. When a water molecule crosses the top layer of the GO membrane then a water permeation event in the +Z direction is counted. Similarly, when a water molecule crosses the bottom layer of the membrane, a water permeation event in the −Z direction is counted. The water permeation events for a membrane is the sum of water permeation events in the +Z direction and −Z direction. Using the same procedure the salt permeation events of the layered GO membranes are computed.Typically for a membrane, the water permeability is reported in terms of water flux. However in the present study there is no net driving force on the water molecules as it is an equilibrium MD simulation. So we compare the water permeability of different membrane configurations in terms of water permeation events. On the same note it is worth mentioning that the water flux reported from atomistic simulations (Gai et al. reported 28.1 L cm−2 h−1,8 Gogoi et al. reported 8.55 L cm−2 h−1,37 and Liu et al. reported 14.36 L cm−2 h−1 (ref. 58)) are very high (up to a few orders of magnitude) as compared to experimental observations (Hu and Mi reported 8.0–27.6 L cm−2 h−125 and Huang et al. reported 71.0 L cm−2 h−1 (ref. 59)). This is primarily due to the difference in thickness of the membranes considered in the atomistic simulations and experiments.60 In atomistic simulations the thickness of the membranes are in the order of a few nm because of the limitations of computational resources. On the other hand in experiments the thickness of the membranes ranges from hundreds of nm to a few μm. As the water flux through a membrane is inversely proportional to the membrane thickness,59,60 to get an analogy between the water flux obtained in atomistic simulations and those of experimental observations we need to go for proper scaling of the membrane thickness in simulations with regard to the experiments. The variations of water flux with membrane thickness in regard to the present equilibrium MD simulations are reported in the ESI (Fig. S20 and Table S2†).
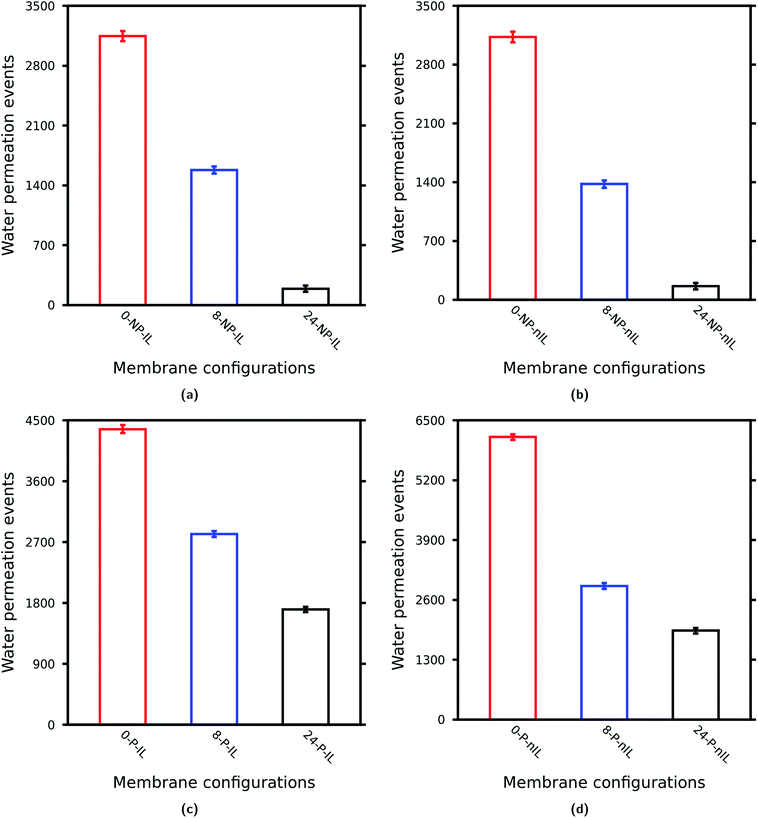
As depicted in Fig. 3 with the increase in W of the layered GO membrane the water permeability decreases irrespective of the presence of pinhole defects and non-ideal lamellar stacking.36,37,39 However, with the inclusion of non-idealities the difference in water permeability between these membranes substantially reduced. This suggests that with the inclusion of the non-idealities the effect of nanosheet sizes on the performance of the layered GO membrane becomes less significant. To get an idea about the effect of individual non-idealities on the water permeability through layered GO membranes with different values of W, we calculated the water permeability ratios as tabulated in Table 2.
| Case | Geometric conditions | Membranes | Water permeability ratio |
|---|---|---|---|
| Case-1 | No pinholes and with ideal lamellar stacking (Fig. 3a) | (0-NP-IL)![[thin space (1/6-em)]](https://www.rsc.org/images/entities/char_2009.gif) : :![[thin space (1/6-em)]](https://www.rsc.org/images/entities/char_2009.gif) (8-NP-IL) (8-NP-IL)![[thin space (1/6-em)]](https://www.rsc.org/images/entities/char_2009.gif) : :![[thin space (1/6-em)]](https://www.rsc.org/images/entities/char_2009.gif) (24-NP-IL) (24-NP-IL) |
16.47![[thin space (1/6-em)]](https://www.rsc.org/images/entities/char_2009.gif) : :![[thin space (1/6-em)]](https://www.rsc.org/images/entities/char_2009.gif) 8.27 8.27![[thin space (1/6-em)]](https://www.rsc.org/images/entities/char_2009.gif) : :![[thin space (1/6-em)]](https://www.rsc.org/images/entities/char_2009.gif) 1.0 1.0 |
| Case-2 | No pinholes and with non-ideal lamellar stacking (Fig. 3b) | (0-NP-nIL)![[thin space (1/6-em)]](https://www.rsc.org/images/entities/char_2009.gif) : :![[thin space (1/6-em)]](https://www.rsc.org/images/entities/char_2009.gif) (8-NP-nIL) (8-NP-nIL)![[thin space (1/6-em)]](https://www.rsc.org/images/entities/char_2009.gif) : :![[thin space (1/6-em)]](https://www.rsc.org/images/entities/char_2009.gif) (24-NP-nIL) (24-NP-nIL) |
19.31![[thin space (1/6-em)]](https://www.rsc.org/images/entities/char_2009.gif) : :![[thin space (1/6-em)]](https://www.rsc.org/images/entities/char_2009.gif) 8.50 8.50![[thin space (1/6-em)]](https://www.rsc.org/images/entities/char_2009.gif) : :![[thin space (1/6-em)]](https://www.rsc.org/images/entities/char_2009.gif) 1.0 1.0 |
| Case-3 | With pinholes and with ideal lamellar stacking (Fig. 3c) | (0-P-IL)![[thin space (1/6-em)]](https://www.rsc.org/images/entities/char_2009.gif) : :![[thin space (1/6-em)]](https://www.rsc.org/images/entities/char_2009.gif) (8-P-IL) (8-P-IL)![[thin space (1/6-em)]](https://www.rsc.org/images/entities/char_2009.gif) : :![[thin space (1/6-em)]](https://www.rsc.org/images/entities/char_2009.gif) (24-P-IL) (24-P-IL) |
2.56![[thin space (1/6-em)]](https://www.rsc.org/images/entities/char_2009.gif) : :![[thin space (1/6-em)]](https://www.rsc.org/images/entities/char_2009.gif) 1.65 1.65![[thin space (1/6-em)]](https://www.rsc.org/images/entities/char_2009.gif) : :![[thin space (1/6-em)]](https://www.rsc.org/images/entities/char_2009.gif) 1.0 1.0 |
| Case-4 | With pinholes and with non-ideal lamellar stacking (Fig. 3d) | (0-P-nIL)![[thin space (1/6-em)]](https://www.rsc.org/images/entities/char_2009.gif) : :![[thin space (1/6-em)]](https://www.rsc.org/images/entities/char_2009.gif) (8-P-nIL) (8-P-nIL)![[thin space (1/6-em)]](https://www.rsc.org/images/entities/char_2009.gif) : :![[thin space (1/6-em)]](https://www.rsc.org/images/entities/char_2009.gif) (24-P-nIL) (24-P-nIL) |
3.17![[thin space (1/6-em)]](https://www.rsc.org/images/entities/char_2009.gif) : :![[thin space (1/6-em)]](https://www.rsc.org/images/entities/char_2009.gif) 1.50 1.50![[thin space (1/6-em)]](https://www.rsc.org/images/entities/char_2009.gif) : :![[thin space (1/6-em)]](https://www.rsc.org/images/entities/char_2009.gif) 1.0 1.0 |
In Table 2, 4 different cases (Case-1, Case-2, Case-3 and Case-4) are reported. Case-1 (Fig. 3a) is the scenario of the most ideal layered GO membrane which is free from any pinhole defects and the nanosheets are stacked in parallel with each other. In Case-2 (Fig. 3b), only non-ideal stacking of GO nanosheets is considered. In this case the difference in water permeability between the layered GO membranes with different values of W increases slightly as compared to that in Case-1. In Case-3 (Fig. 3c) only pinhole defects are considered. As we can see, with the inclusion of pinhole defects the difference in water permeability between the membranes reduces substantially. The scenario of Case-4 (Fig. 3d) is an interesting one where pinhole defects and non-ideal lamellar stacking are considered together. When both pinhole defects and non-ideal lamellar stacking are considered, the difference in water permeability reduces as compared to the ideal case (Case-1). However, in the scenario of Case-3, the ratio of water permeability between the layered GO membrane composed of small nanosheets and layered GO membrane composed of large nanosheets is 2.56![[thin space (1/6-em)]](https://www.rsc.org/images/entities/char_2009.gif) :
:![[thin space (1/6-em)]](https://www.rsc.org/images/entities/char_2009.gif) 1.0, but for Case 4, this ratio is 3.17
1.0, but for Case 4, this ratio is 3.17![[thin space (1/6-em)]](https://www.rsc.org/images/entities/char_2009.gif) :
:![[thin space (1/6-em)]](https://www.rsc.org/images/entities/char_2009.gif) 1.0. On the other hand the ratio of water permeability between the layered GO membrane composed of medium sized nanosheets and layered GO membrane composed of large nanosheets is 1.65
1.0. On the other hand the ratio of water permeability between the layered GO membrane composed of medium sized nanosheets and layered GO membrane composed of large nanosheets is 1.65![[thin space (1/6-em)]](https://www.rsc.org/images/entities/char_2009.gif) :
:![[thin space (1/6-em)]](https://www.rsc.org/images/entities/char_2009.gif) 1.0 for Case-3 and 1.50
1.0 for Case-3 and 1.50![[thin space (1/6-em)]](https://www.rsc.org/images/entities/char_2009.gif) :
:![[thin space (1/6-em)]](https://www.rsc.org/images/entities/char_2009.gif) 1.0 for Case 4. So, for the former case the ratio is increasing and for the latter case the ratio is decreasing. This suggests that the effectiveness of pinhole defects and non-ideal lamellar stacking on the performance of layered GO membrane is also dependent on the sizes of the constituent GO nanosheets. However, it is pretty much clear that with the inclusion of non-idealities in the layered GO membranes the difference in water permeability between layered GO membranes of different sheet sizes reduces to a much lower value (the ratio comes down to about 3.0 from about 16.0) which is in accordance with the experimental observation of Saraswat et al.30
1.0 for Case 4. So, for the former case the ratio is increasing and for the latter case the ratio is decreasing. This suggests that the effectiveness of pinhole defects and non-ideal lamellar stacking on the performance of layered GO membrane is also dependent on the sizes of the constituent GO nanosheets. However, it is pretty much clear that with the inclusion of non-idealities in the layered GO membranes the difference in water permeability between layered GO membranes of different sheet sizes reduces to a much lower value (the ratio comes down to about 3.0 from about 16.0) which is in accordance with the experimental observation of Saraswat et al.30
We also compare the effect of the non-idealities on the water permeability through layered GO membranes with a particular value of W. Fig. 4 shows the effect of non-idealities on the water permeability through layered GO membranes for a particular value of W. To compare the effect of different non-idealities on the water permeability through layered GO membranes with a particular value of W, the water permeability ratios are computed as shown in Table 3.
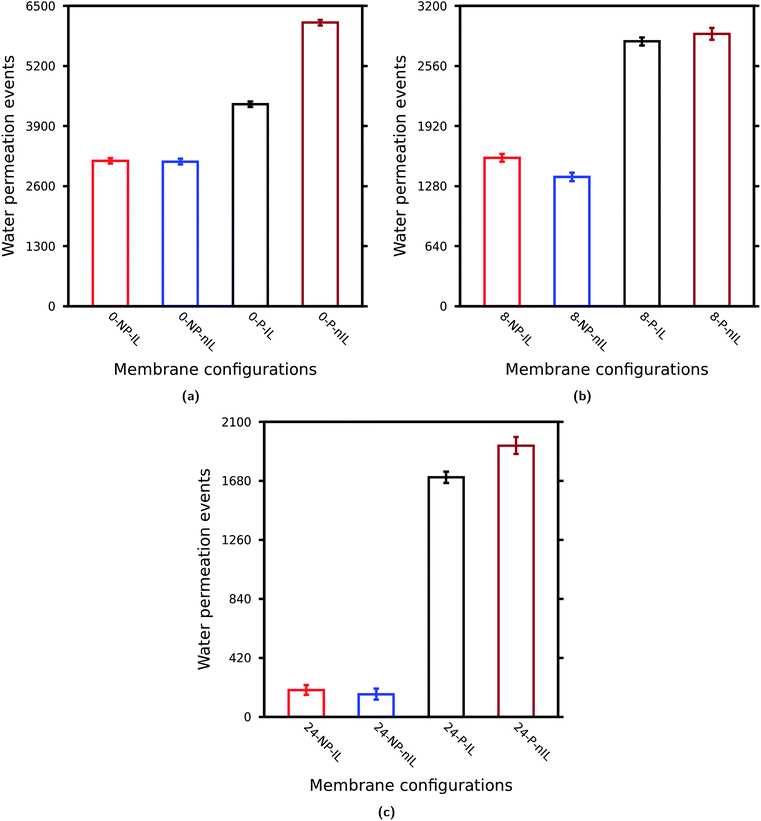 | ||
| Fig. 4 Effect of non-idealities on the water permeability through layered GO membranes: (a) W = 0.0 Å, (b) W = 8.0 Å, and (c) W = 24.0 Å. | ||
The non-ideal lamellar stacking leads to a decrease in water permeability, whereas the presence of pinhole defects increases the water permeability through a layered GO membrane for any value of W as observed in Cases A, B and C. Also the effect of these non-idealities becomes more significant as W (or sizes of GO nanosheets) increases. Noticeably, the pinhole defects increase the water permeability by almost 9.0 times as compared to the ideal one for W = 24.0 Å (Table 3). Again, when both pinhole defects and non-ideal lamellar stacking are introduced into the GO membrane the water permeability increases. This increase is more significant for W = 24.0 Å followed by W = 0.0 Å and W = 8.0 Å. These observations clearly suggest that the effect of non-idealities is more prominent for layered GO membranes composed of nanosheets of large lateral dimensions where these non-idealities increase the water permeability by almost 10 times as compared to the ideal one. On the other hand for layered GO membranes composed of medium and small nanosheets this increase is only about 2 fold (Cases A and B).
Similar to water permeability, the salt rejection of the layered GO membrane is reported in terms of salt (ion) permeation events. With the increase in W the salt rejection ability of the layered GO membrane increases irrespective of the presence of non-idealities as shown in Table S1 of the ESI.† However, unlike water permeability the variation in salt rejection of the membranes, because of the presence of non-idealities, is <2%, at least in the timescale of the present simulation study. More encouragingly, the salt rejection of layered GO membranes composed of large nanosheets (W = 24.0 Å) is always 100% irrespective of the presence of non-idealities although its water permeability increases by almost 10 times because of the presence of non-idealities.
Fig. 5 shows the trajectories of permeating water molecules inside the layered GO membranes where the GO nanosheets are ideally stacked with and without pinhole defects. As W (or the size of the GO nanosheets) increases, in the absence of non-idealities the permeating water molecules have to follow a circuitous, lateral pathway around individual sheets to permeate through the membrane (Fig. 5a, c and e). This reduces the permeability of the layered GO membrane as W increases.36,37,39 However, with the inclusion of pinhole defects on the layered GO membranes, the permeating water molecules find shorter pathways for trans-sheet flow (Fig. 5b, d and f) which in turn increases the water permeability of the membranes. This effect is more significant for the layered GO membrane composed of large nanosheets i.e. with a higher value of W. The trajectories of permeating water molecules inside layered GO membranes with non-ideal lamellar stacking are shown in Fig. S8–S10.† The trajectories of the permeating ions through the layered GO membranes are depicted in Fig. S11–S15.†
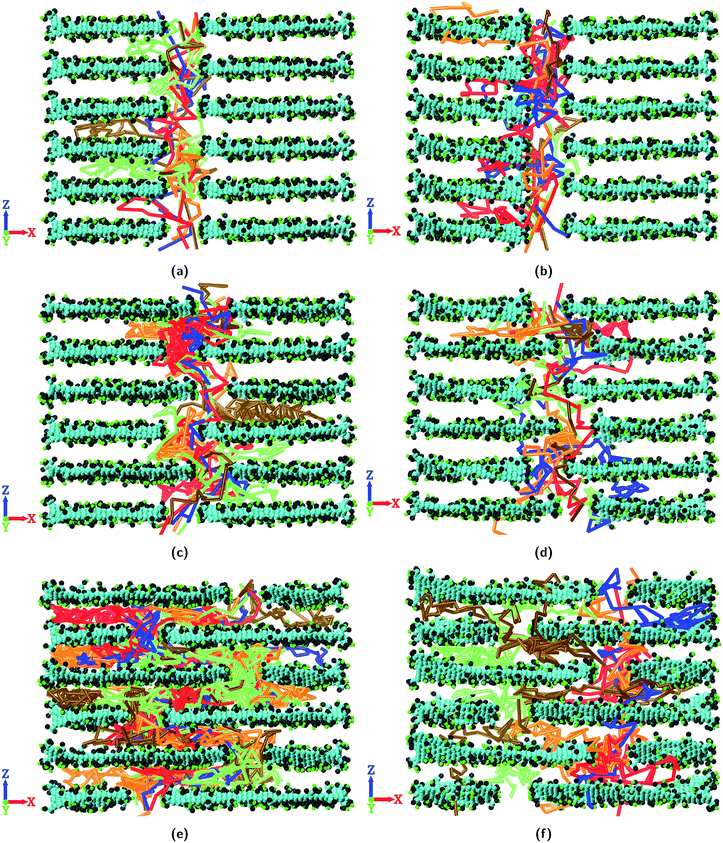 | ||
| Fig. 5 Trajectory of permeating water molecules through layered GO membranes with ideal lamellar stacking: (a) 0-NP-IL, (b) 0-P-IL, (c) 8-NP-IL, (d) 8-P-IL, (e) 24-NP-IL, and (f) 24-P-IL. | ||
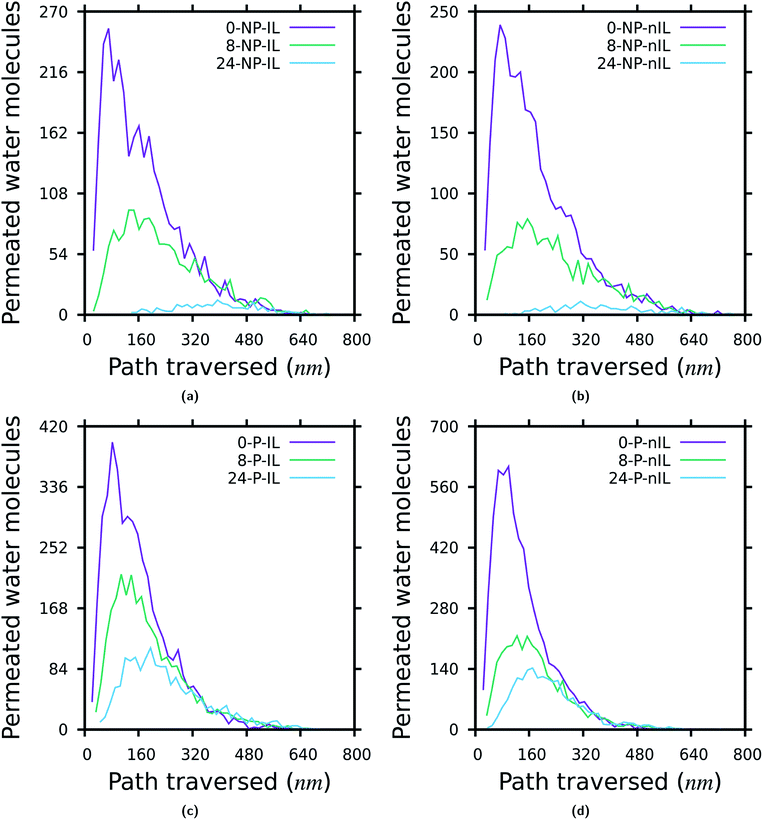
Fig. 6 depicts the distribution of the distance traversed by the permeating water molecules through the layered GO membranes. To calculate the distance traversed by the permeating water molecules through the layered GO membranes, first a list of all the permeating water molecules is extracted from the simulation data. Then the positions of each of these permeating water molecules are recorded every 20 ps. From these data we calculated the distance travelled by each of the permeating water molecules from the moment it enters inside the membrane to the moment it completely permeated through the membrane. The distance travelled by one water molecule in a single step is the difference between its current position and its immediate previous position. With the decrease in W, the majority of the permeating water molecules traverse a shorter distance while permeating through the membrane irrespective of the presence of non-idealities. This observation is in accordance with the observations shown in Fig. 3 and 5. The distribution of the permeation time and permeation velocity of the water molecules also follow the same trend as the permeation distance which are reported in the ESI (Fig. S16 and S17†).
Fig. 7 shows the spatial distribution of water in the layered GO membranes with W = 24.0 Å. With no pinhole defects on the GO nanosheets and with ideal lamellar stacking, the water molecules have to follow a “zig-zag” pathway inside the membrane to permeate through (Fig. 7a). With the increase in the size of the GO nanosheets the length of this “zig-zag” pathway inside the membrane increases, which leads to lower water permeability through the membrane. With the consideration of non-ideal lamellar stacking alone (i.e., no pinhole defects) the water permeability of the layered GO membrane slightly decreases because of the blockage of water permeation pathways inside the membrane37 (Fig. 7b). On the other hand with the consideration of pinhole defects alone (i.e. the GO layers are still ideally aligned), the water molecules find shorter pathways for trans-sheet flow inside the membrane (Fig. 7c). This increases the water permeability of the layered GO membranes. The water permeation through the layered GO membranes increases further with the consideration of pinhole defects along with non-ideal lamellar stacking (Fig. 7d). In this scenario the behaviour of non-ideal stacking of GO nanosheets is different from the scenario where there are no pinhole defects present on the GO nanosheets. The non-ideal stacking of GO nanosheets leads to alternative pathways30,61,62 for water permeation inside the membrane when pinhole defects are present. So, along with the pinhole defects which provide shorter pathways for trans-sheet flow, the voids which are created due to non-ideal stacking of nanosheets also come into play in determining the water permeability through the layered GO membranes. Due to this the highest water permeability is observed when both the non-idealities (i.e. pinhole defects and non-ideal lamellar stacking) coexist in the layered GO membranes. The spatial distribution of water for layered GO membranes with W = 0.0 Å and W = 8.0 Å is reported in the ESI (Fig. S18 and S19†).
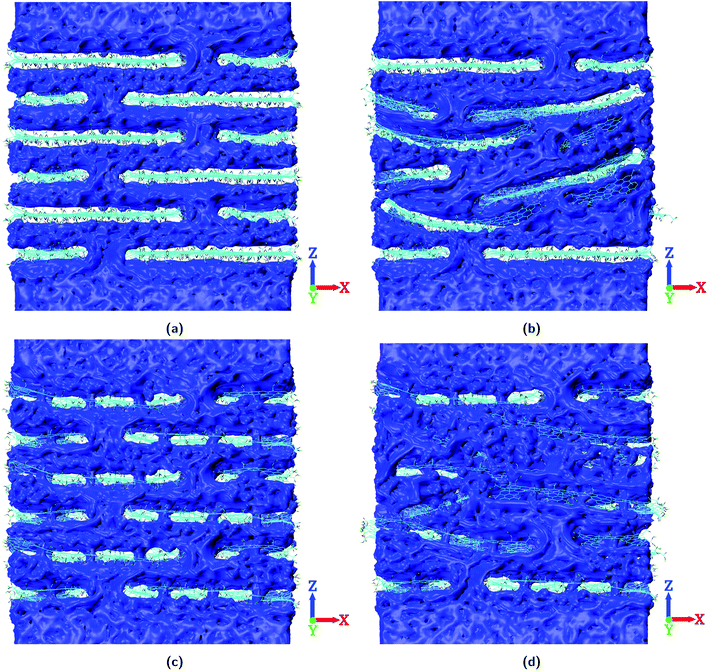 | ||
| Fig. 7 Spatial distribution of water for layered GO membranes with W = 24.0 Å. (a) 24-NP-IL, (b) 24-NP-nIL, (c) 24-P-IL, and (d) 24-P-nIL. | ||
Conclusions
In this present study the effect of non-idealities namely pinhole defects and non-ideal lamellar stacking of GO nanosheets on the performance of layered GO membranes is investigated through atomistic simulations. The layered GO membranes composed of smaller GO nanosheets (or a smaller value of W) show higher water permeability and lower salt rejection as compared to the layered GO membrane composed of larger GO nanosheets (or a larger value of W). However the difference in water permeability between these layered GO membranes reduces to a much lower value (the ratio reduces to around 3 times from around 16 times) with the inclusion of non-idealities in the layered GO membranes. The effect of these non-idealities is more prominent with layered GO membranes of larger sheet sizes. Due to the presence of non-idealities the water permeability increases by around 10 times for the GO membrane with W = 24.0 Å, whereas for GO membranes with W = 0.0 Å and 8.0 Å the water permeability increases by only around 2 times. Although, the presence of non-idealities increases the water permeability the corresponding variation in salt rejection is negligible (<2%). More encouragingly, the salt rejection of the layered GO membrane with W = 24.0 Å remains at 100% irrespective of the presence of non-idealities.The effect of individual non-idealities on the performance of the GO membranes has also been investigated. The consideration of pinhole defects alone (i.e. GO nanosheets are still ideally aligned) in the layered GO membrane increases the water permeability through the membrane. The pinhole defects present on the GO nanosheets provide shorter pathways to the water molecules for trans-sheet flow. This increases the water permeability through the layered GO membranes. When non-ideal lamellar stacking of GO nanosheets is considered alone (i.e. no pinhole defects on the GO nanosheets) in the layered GO membranes, the water permeation through the membranes slightly decreases. The reason behind this is the blockage of permeation pathways inside the layered GO membrane because of the non-ideal stacking of the GO nanosheets. However with the presence of pinhole defects the effect of non-ideal nanosheet stacking becomes favourable to water permeation as this time the non-ideal stacking leads to formation of voids inside the membrane which act as alternate pathways for water permeation through the membrane. Because of this, maximum water permeation is observed through the layered GO membranes when both pinhole defects and non-ideal lamellar stacking coexist in the membrane.
Nevertheless, the size of the GO nanosheets still plays an important role in determining the performance of a layered GO membrane, although the ratio of water permeability between layered GO membranes composed of smaller nanosheets to that of membranes composed of larger nanosheets reduces to about 3 fold from about 16 fold with the inclusion of non-idealities.
This study provides some useful insights into the performance of the layered GO membrane taking into account the non-idealities that may be crucial to a pragmatic layered GO membrane. However, it would be interesting to investigate the effect of these non-idealities in a non-equilibrium osmotic environment (forward osmosis, reverse osmosis, etc.). The performance of the layered GO membrane with varying sizes of pinhole defects also would be interesting to investigate. We hope that the observations reported in the present study would encourage further research in the practical applicability of layered GO membranes in sea water desalination, water purification, fuel cells and other membrane applications.
Conflicts of interest
There are no conflicts to declare.Acknowledgements
The authors would like to acknowledge the Param-Ishan supercomputing facility of IIT Guwahati.Notes and references
- Y. Wei, Y. Zhang, X. Gao, Z. Ma, X. Wang and C. Gao, Carbon, 2018, 139, 964–981 CrossRef CAS.
- M. A. Shannon, P. W. Bohn, M. Elimelech, J. G. Georgiadis, B. J. Mariñas and A. M. Mayes, Nature, 2008, 452, 301–310 CrossRef CAS PubMed.
- R. R. Nair, H. A. Wu, P. N. Jayaram, I. V. Grigorieva and A. K. Geim, Science, 2012, 335, 442–444 CrossRef CAS PubMed.
- D. C. Tanugi and J. C. Grossman, Nano Lett., 2012, 12, 3602–3608 CrossRef PubMed.
- H. W. Kim, H. W. Yoon, S. M. Yoon, B. M. Yoo, B. K. Ahn, Y. H. Cho, H. J. Shin, H. Yang, U. Paik, S. Kwon, J. Y. Choi and H. B. Park, Science, 2013, 342, 91–95 CrossRef CAS PubMed.
- M. Heiranian, A. B. Farimani and N. R. Aluru, Nat. Commun., 2015, 6, 1–6 Search PubMed.
- M. Shahbabaei and D. Kim, J. Phys. Chem. B, 2017, 121, 4137–4144 CrossRef CAS PubMed.
- J. G. Gai, X. L. Gong, W. W. Wang, X. Zhang and W. L. Kang, J. Mater. Chem. A, 2014, 2, 4023–4028 RSC.
- M. Dahanayaka, B. Liu, Z. Hu, Q. X. Pei, Z. Chen, A. W. K. Law and K. Zhou, Phys. Chem. Chem. Phys., 2017, 19, 30551–30561 RSC.
- S. Safaei and R. Tavakoli, Desalination, 2017, 422, 83–90 CrossRef CAS.
- T. Yu, Z. Xu, S. Liu, H. Liu and X. Yang, J. Membr. Sci., 2018, 550, 510–517 CrossRef CAS.
- J. Abraham, K. S. Vasu, C. D. Williams, K. Gopinadhan, Y. Su, C. T. Cherian, J. Dix, E. Prestat, S. J. Haigh, I. V. Grigorieva, P. Carbone, A. K. Geim and R. R. Nair, Nat. Nanotechnol., 2017, 12, 546–550 CrossRef CAS PubMed.
- S. Zheng, Q. Tu, J. J. Urban, S. Li and B. Mi, ACS Nano, 2017, 11, 6440–6450 CrossRef CAS PubMed.
- F. Perreault, H. Jaramillo, M. Xie, M. Ude, L. D. Nghiem and M. Elimelech, Environ. Sci. Technol., 2016, 50, 5840–5848 CrossRef CAS PubMed.
- D. An, L. Yang, T. J. Wang and B. Liu, Ind. Eng. Chem. Res., 2016, 5, 4803–4810 CrossRef.
- A. Buchsteiner, A. Lerf and J. Pieper, J. Phys. Chem. B, 2006, 110, 22328–22338 CrossRef CAS PubMed.
- A. Lerf, A. Buchsteiner, J. Pieper, S. Scöttl, I. Dekany, T. Szabo and H. Boehm, J. Phys. Chem. Solids, 2006, 67, 1106–1110 CrossRef CAS.
- K. Raidongia and J. Huang, J. Am. Chem. Soc., 2012, 134, 16528–16531 CrossRef CAS PubMed.
- Y. Zhu, S. Murali, W. Cai, X. Li, J. W. Suk, J. R. Potts and R. S. Ruoff, Adv. Mater., 2010, 22, 3906–3924 CrossRef CAS PubMed.
- R. K. Joshi, P. Carbone, F. C. Wang, V. G. Kravets, Y. Su, I. V. Grigorieva, H. A. Wu, A. K. Geim and R. R. Nair, Science, 2014, 343, 752–754 CrossRef CAS PubMed.
- H. Li, Z. Song, X. Zhang, Y. Huang, S. Li, Y. Mao, H. J. Ploehn, Y. Bao and M. Yu, Science, 2013, 342, 95–98 CrossRef CAS PubMed.
- H. Huang, Z. Song, N. Wei, L. Shi, Y. Mao, Y. Ying, L. Sun, Z. Xu and X. Peng, Nat. Commun., 2013, 4, 1–9 Search PubMed.
- K. Huang, G. Liu, Y. Lou, Z. Dong, J. Shen and W. Jin, Angew. Chem., Int. Ed., 2014, 53, 6929–6932 CrossRef CAS PubMed.
- Z. Luo, Y. Lu, L. A. Somers and A. T. C. Johnson, J. Am. Chem. Soc., 2009, 131, 898–899 CrossRef CAS PubMed.
- M. Hu and B. Mi, Environ. Sci. Technol., 2013, 47, 3715–3723 CrossRef CAS PubMed.
- L. Chen, G. Shi, J. Shen, B. Peng, B. Zhang, Y. Wang, F. Bian, J. Wang, D. Li, Z. Qian, G. Xu, G. Liu, J. Zeng, L. Zhang, Y. Yang, G. Zhou, M. Wu, W. Jin, J. Li and H. Fang, Nature, 2017, 550, 380–383 CrossRef CAS PubMed.
- Y. H. Xi, J. Q. Hu, Z. Liu, R. Xie, X. J. Ju, W. Wang and L. Y. Chu, ACS Appl. Mater. Interfaces, 2016, 8, 15557–15566 CrossRef CAS PubMed.
- B. Mi, Science, 2014, 343, 740–742 CrossRef CAS PubMed.
- D. A. Dikin, S. Stankovich, E. J. Zimney, R. D. Piner, G. H. B. Dommett, G. Evmenenko, S. B. T. Nguyen and R. S. Ruoff, Nature, 2007, 448, 457–460 CrossRef CAS PubMed.
- V. Saraswat, R. M. Jacobberger, J. S. Ostrander, C. L. Hummell, A. J. Way, J. Wang, M. T. Zanni and M. S. Arnold, ACS Nano, 2018, 12, 7855–7865 CrossRef CAS PubMed.
- W. L. Tong, W. J. Ong, S. P. Chai, M. K. Tan and Y. M. Hung, Sci. Rep., 2015, 5, 1–13 Search PubMed.
- K. Erickson, R. Erni, Z. Lee, N. Alem, W. Gannett and A. Zettl, Adv. Mater., 2010, 22, 4467–4472 CrossRef CAS PubMed.
- S. H. Dave, C. Gong, A. W. Robertson, J. H. Warner and J. C. Grossman, ACS Nano, 2016, 10, 7515–7522 CrossRef CAS PubMed.
- K. P. Loh, Q. Bao, G. Eda and M. Chhowalla, Nat. Chem., 2010, 2, 1015–1024 CrossRef CAS PubMed.
- C. Mattevi, G. Eda, S. Agnoli, S. Miller, K. A. Mkhoyan, O. Celik, D. Mastrogiovanni, G. Granozzi, E. Garfunkel and M. Chhowalla, Adv. Funct. Mater., 2009, 19, 2577–2583 CrossRef CAS.
- A. Gogoi, T. J. Konch, K. Raidongia and K. A. Reddy, J. Membr. Sci., 2018, 563, 785–793 CrossRef CAS.
- A. Gogoi, K. A. Reddy and P. Mondal, ACS Appl. Nano Mater., 2018, 1, 4450–4460 CrossRef CAS.
- N. Wei, X. Peng and Z. Xu, ACS Appl. Mater. Interfaces, 2014, 6, 5877–5883 CrossRef CAS PubMed.
- P. Sun, K. Wang, J. Wei, M. Zhong, D. Wu and H. Zhu, J. Mater. Chem. A, 2014, 2, 7734–7737 RSC.
- A. V. Talyzin, T. Hausmaninger, S. You and T. Szabó, Nanoscale, 2014, 6, 272–281 RSC.
- J. Y. Chong, B. Wang, C. Mattevi and K. Li, J. Membr. Sci., 2018, 549, 385–392 CrossRef CAS.
- Y. H. Cho, H. W. Kim, H. D. Lee, J. E. Shin, B. M. Yoo and H. B. Park, J. Membr. Sci., 2017, 544, 425–435 CrossRef CAS.
- B. Chen, H. Jiang, X. Liu and X. Hu, ACS Appl. Mater. Interfaces, 2017, 9, 22826–22836 CrossRef CAS PubMed.
- H. Dai, Z. Xu and X. Yang, J. Phys. Chem. C, 2016, 120, 22585–22596 CrossRef CAS.
- B. Chen, H. Jiang, X. Liu and X. Hu, Phys. Chem. Chem. Phys., 2018, 20, 9780–9786 RSC.
- J. A. L. Willcox and H. J. Kim, ACS Nano, 2017, 11, 2187–2193 CrossRef CAS PubMed.
- H. Tang, D. Liu, Y. Zhao, X. Yang, J. Lu and F. Cui, J. Phys. Chem. C, 2015, 119, 26712–26718 CrossRef CAS.
- C. J. Shih, S. Lin, R. Sharma, M. S. Strano and D. Blankschtein, Langmuir, 2012, 28, 235–241 CrossRef CAS PubMed.
- W. Humphrey, A. Dalke and K. Schulten, J. Mol. Graphics, 1996, 14, 33–38 CrossRef CAS PubMed.
- W. S. Hung, Q. F. An, M. D. Guzman, H. Y. Lin, S. H. Huang, W. R. Liu, C. C. Hu, K. R. Lee and J. Y. Lai, Carbon, 2014, 68, 670–677 CrossRef CAS.
- L. C. Lin and J. C. Grossman, Nat. Commun., 2015, 6, 1–7 Search PubMed.
- K. Sint, B. Wang and P. Král, J. Am. Chem. Soc., 2008, 130, 16448–16449 CrossRef CAS PubMed.
- J. C. Phillips, R. Braun, W. Wang, J. Gumbart, E. Tajkhorshid, E. Villa, C. Chipot, R. D. Skeel, L. Kalé and K. Schulten, J. Comput. Chem., 2005, 26, 1781–1802 CrossRef CAS PubMed.
- W. L. Jorgensen, D. S. Maxwell and J. T. Rives, J. Am. Chem. Soc., 1996, 118, 11225–11236 CrossRef CAS.
- W. L. Jorgensen, J. Chandrasekhar, J. D. Madura, R. W. Impey and M. L. Klein, J. Chem. Phys., 1983, 79, 926–935 CrossRef CAS.
- S. Miyamoto and P. A. Kollman, J. Comput. Chem., 1992, 13, 952–962 CrossRef CAS.
- U. Essmann, L. Perera, M. L. Berkowitz, T. Darden, H. Lee and L. G. Pedersen, J. Chem. Phys., 1995, 103, 8577–8593 CrossRef CAS.
- B. Liu, A. W. K. Law and K. Zhou, J. Membr. Sci., 2018, 550, 554–562 CrossRef CAS.
- H. Huang, Y. Mao, Y. Ying, Y. Liu, L. Sun and X. Peng, Chem. Commun., 2013, 49, 5963–5965 RSC.
- Z. Wang, Q. Tu, S. Zheng, J. J. Urban, S. Li and B. Mi, Nano Lett., 2017, 17, 7289–7298 CrossRef CAS PubMed.
- Q. Yang, Y. Su, C. Chi, C. T. Cherian, K. Huang, V. G. Kravets, F. C. Wang, J. C. Zhang, A. Pratt, A. N. Grigorenko, F. Guinea, A. K. Geim and R. R. Nair, Nat. Mater., 2017, 16, 1198–1202 CrossRef CAS PubMed.
- Y. Wei, Y. Zhang, X. Gao, Y. Yuan, B. Su and C. Gao, Carbon, 2016, 108, 568–575 CrossRef CAS.
Footnote |
| † Electronic supplementary information (ESI) available: A brief description of the OPLS-AA force field, structure of GO nanosheets, hydrated layered GO membranes with non-ideal lamellar stacking, salt permeation events through layered GO membranes, trajectory of water molecules through layered GO membranes with non-ideal lamellar stacking, trajectory of ions through the layered GO membranes, distribution of permeation time and permeation velocity of the water molecules through the layered GO membranes, spatial distribution of water for the layered GO membranes with W = 0.0 Å and W = 8.0 Å, variation of water flux with membrane thickness, effect of the number of pinhole defects on the performance of the layered GO membrane, and effect of pinhole sizes on the performance of the layered GO membrane. See DOI: 10.1039/c9na00235a |
| This journal is © The Royal Society of Chemistry 2019 |

