DOI:
10.1039/C9NA00191C
(Communication)
Nanoscale Adv., 2019,
1, 2510-2517
In situ alignment of graphene nanoplatelets in poly(vinyl alcohol) nanocomposite fibers with controlled stepwise interfacial exfoliation†
Received
28th March 2019
, Accepted 6th May 2019
First published on 6th May 2019
Abstract
Hierarchically microstructured tri-axial poly(vinyl alcohol)/graphene nanoplatelet (PVA/GNP) composite fibers were fabricated using a dry-jet wet spinning technique. The composites with distinct PVA/GNPs/PVA phases led to highly oriented and evenly distributed graphene nanoplatelets (GNPs) as a result of molecular chain-assisted interfacial exfoliation. With a concentration of 3.3 wt% continuously aligned GNPs, the composite achieved a ∼73.5% increase in Young's modulus (∼38 GPa), as compared to the pure PVA fiber, and an electrical conductivity of ∼0.38 S m−1, one of the best mechanical/electrical properties reported for polymer/GNP nanocomposite fibers. This study has broader impacts on textile engineering, wearable robotics, smart sensors, and optoelectronic devices.
Introduction
Polymer-based nanocarbon-included composites have been extensively researched in the past few decades because of their unique functional properties, durability, and chemical stability.1 Recent studies on 3D printing filaments,2 functional wearable materials and sensors,3–5 and lightweight robotic textiles6 have further pushed the boundaries of such nanocomposites. One-dimensional (1D) carbon nanotubes (CNTs) and two-dimensional (2D) graphene are the most promising nanoparticle reinforcements because of their superior mechanical and functional properties.7–17 Nevertheless, CNT-based polymeric composites often exhibit much better mechanical properties than graphene-based composites. Although CNTs and graphene have a similar intrinsic elastic modulus (∼1000 GPa) and strength (∼100 GPa),18,19 they enhance polymeric matrices differently due to the differences in their morphology and degree of interaction with macromolecules. Most previous studies have focused on uniformly dispersing these nanoparticles in a polymer matrix through solution mixing or in situ polymerization via laborious bath sonication, tip sonication, homogenization, or surface modification.20,21 However, these methods do not incorporate 2D microstructural control and are often more effective for 1D nanoparticles due to their single-axis symmetry. 2D platelets or sheets display a high level of planar compliance and entropic instability even at room temperature, leading to surface crumples or folded topologies.22 Without 2D material microstructural control, the degree of graphene nanoparticle orientation or exfoliation in the aforementioned methods is limited, leading to inefficient polymer/nanoparticle interactions and inferior composite performance.
Instead of dispersing nanoparticles in polymer or monomer mixtures, we obtained a unique microstructure of separated nanofillers and polymer matrix channels that facilitate both the dispersion and alignment of 2D nanoparticles. Poly(vinyl alcohol) (PVA) was chosen as the polymer matrix because of its excellent chemical resistance, biocompatibility, hydrophilicity, and processability.23 Graphene nanoplatelets (GNPs) were selected as the nanofillers because of their 2D features, low cost, and relatively high aspect ratio. Through an in-house designed/manufactured tri-axial spinneret, a steady flow of the GNPs/solvent suspension constrained by two layers of a PVA/solvent solution was injected during a dry-jet wet spinning process to form a sandwich structure (3-phase). To our knowledge, this configuration has never been previously shown to demonstrate the orientation behavior of 2D nanofillers. With pure PVA fiber (1-phase) as the control sample, the 3-phase fiber showed an increase of 73.5% and 17.3% in Young's modulus and ultimate tensile strength, respectively. The 3-phase configuration also enables the insulation of PVA with an electrical conductivity of 0.38 S m−1. To better understand the efficiency and mechanisms of 2D material alignment in 3-phase fibers, we also manufactured core–shell structures consisting of continuous GNPs as the core, PVA as the sheath (2-phase) and dispersed GNPs in the PVA matrix (D-phase).
Materials and methods
Materials
Graphene nanoplatelets (GNPs, grade C-750) were purchased from Sigma Aldrich with a specific surface area of 750 m2 g−1. Poly(vinyl alcohol) (PVA, Kuraray 28-98) was obtained from Kuraray with a molecular weight of ∼145![[thin space (1/6-em)]](https://www.rsc.org/images/entities/char_2009.gif) 000 g mol−1 and 98–99% degree of hydrolysis. Methanol (ACS reagent, 99.8%, 179337), dimethyl sulfoxide (DMSO, ACS reagent 99.9%, 472301), N,N-dimethylformamide (DMF, ACS reagent, 99.8%, 319937), xylene (ACS reagent, 214736), and toluene (anhydrous, 99.8%, 244511) were purchased from Sigma-Aldrich (St. Louis, MO, USA) and used as received.
000 g mol−1 and 98–99% degree of hydrolysis. Methanol (ACS reagent, 99.8%, 179337), dimethyl sulfoxide (DMSO, ACS reagent 99.9%, 472301), N,N-dimethylformamide (DMF, ACS reagent, 99.8%, 319937), xylene (ACS reagent, 214736), and toluene (anhydrous, 99.8%, 244511) were purchased from Sigma-Aldrich (St. Louis, MO, USA) and used as received.
Spinneret engineering
Three spinnerets were designed using SolidWorks (Fig. 1a1–a3) to accommodate 3-, 2-, 1-, and D-phase fiber structures. They were manufactured using a fused deposition modeling (FDM) 3D printer (Dimension Elite, Stratasys) with acrylonitrile butadiene styrene (ABS) resin. Specific designs are shown in Fig. S1.†
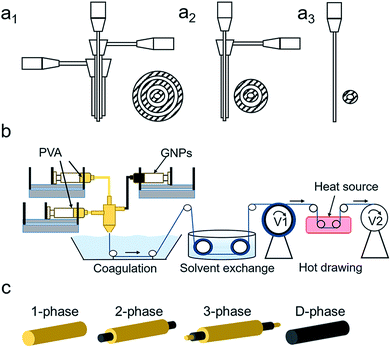 |
| | Fig. 1 (a1–a3) From left to right are the in-house designs of the 3-phase, 2-phase, and 1-phase spinnerets with dimensions listed in Fig. S1.† Designs were printed using a 3D printer. (b) Dry-jet wet spinning apparatus and procedures, including spinning dope injection, solvent exchange during the coagulation process, and post-treatment of hot-drawing. (c) Four types of fiber micro-structures where yellow and black represent the PVA polymer and graphene nanoplatelets, respectively. | |
3-Phase fiber.
20 wt% PVA polymer pellets were added to DMSO at 120 °C under mechanical stirring for 120 minutes until a clear solution was obtained. 20 wt% GNPs was added to DMSO and was stirred and tip sonicated for 10 minutes at room temperature. Fig. 1b shows the schematic of the dry-jet wet spinning process consisting of coagulation, solvent exchange, and heat-drawing. Syringes containing PVA, GNPs, and PVA were connected to the inner, middle, and outer inlets, respectively, with specified rates. The composite gel solution then passed through an air gap and went through a methanol coagulation bath to form a tri-axial fiber. A winder with a take-up speed of 8 m min−1 was used to collect the fiber into a methanol solvent exchange bath. After 24 hours, the DMSO-free fiber was drawn between two winders at different speeds at 100 °C, 150 °C, and 200 °C stepwise to obtain the final fiber composite (Fig. 1c). At each drawing stage, a maximum draw ratio was obtained until any further increase in speed of the second winder would result in breakage.
2-Phase fiber.
As mentioned above, the inner channel of the 2-phase spinneret (Fig. 1a2) was connected to the 20 wt% GNPs/DMSO dispersion and the outer channel was connected to the 20 wt% PVA/DMSO solution. Spinning and drawing techniques were used as previously stated (Fig. 1c).
1-Phase and D-phase fiber.
20 wt% PVA/DMSO was used for the 1-phase fiber (Fig. 1c). For the D-phase fiber, 3.5 wt% GNPs was dispersed and stirred for 2 hours in 20 wt% PVA/DMSO solution, following 2 hours of mild sonication (Fig. 1c). A 1-phase spinneret was used for both fibers (Fig. 1a3). Spinning and drawing techniques were used as previously stated. More experimental parameter details are listed in Table S1.†
Characterization
The fiber morphology was studied using scanning electron microscopy (SEM) on a XL30 ESEM-FEG. The fibers were soaked in liquid nitrogen for 5 minutes prior to cutting the cross-sectional areas. 15 nm of gold nanoparticle layers were deposited on the surface to improve conductivity. Thermogravimetric analysis (TGA, LABSYS EVO) was conducted for 1-, 2-, and 3-phase fibers. The chamber was purged with helium gas at 0.5 °C min−1 for 30 minutes, and then heated at a rate of 10 °C min−1 up to 600 °C. A wide-angle X-ray diffractometer (XRD, Kristallo-Flex 710D X-ray generator, Bruker D5000, Siemens) was used with Cu Kα radiation (40 kV, 40 mA). The scanning range of the Bragg’s angle 2θ for XRD ranged from 5° to 70° at a scanning rate of 2° min−1. Polarized Raman spectroscopy was used with a green laser (532 nm) in the VV configuration, in which a backscattering light intensity analyzer is set parallel to the polarized incident laser. The angle between the laser beam and the axis of the fiber was increased from 0° to 90° in increments of 10°. A tensile test was performed with a Discovery HR-2 (TA instruments) at room temperature for 10 samples of each fiber type. The gauge distance was kept at 10 mm and the head-cross speed was set to 100 μm s−1. Electrical conductivity was measured using a multimeter at room temperature, with the test material length set to 2 cm for each fiber. For 3-phase and 2-phase fibers, the PVA polymer was scratched at the end to expose the GNP channel. Silver paste was added to all fiber ends to increase the contact area with the multimeter probe.
Results and discussion
Fiber morphology
The dimensions and morphologies of GNPs can significantly influence their reinforcement effects in polymer matrices. The GNPs used in our research have ∼13 layers with an aspect ratio of ∼384.6, which was confirmed by previous research.24 The SEM image suggests a particle size smaller than 2 μm (Fig. S2†). The G band and D band in Raman spectra are attributed to the first-order scattering of the E2g vibrational mode in graphite sheets and structural defects, respectively, and the high ratio between the intensities of the D band and G band of the Raman spectra (∼1) suggests that the GNPs contain relatively high defects (Fig. S3†).25 As GNPs tend to aggregate, their dispersion quality was examined in various solvents including water, toluene, DMSO, DMF, and xylene (Fig. S4†). DMSO showed the best dispersion quality due to its similarity in surface energy with graphene, which minimizes the enthalpy of mixing.26 It is important to emphasize that the dispersion method in this study was not intended to improve the dispersion quality of GNPs in the solvent using a simple tip dispersion for 10 min for highly concentrated GNP suspensions without polymer coatings or surface functionalization treatments. Rather, we designed our method to prove the facile exfoliation and orientation of graphene-based materials despite an initially unsatisfactory dispersion quality. Draw ratios and diameters of the fibers at different drawing stages are listed in the ESI Table S1† and the drawn fibers are shown in Fig. S5.† The cross-sectional morphologies of the as-spun fibers before the post-heat treatment were studied using SEM. The as-spun 1-phase fiber shows a clean cross-section (Fig. 2a) while the 2-phase and 3-phase fibers show different phases between each layer with no infiltration of the nanoparticles into the polymer chains (Fig. 2b and c). Nevertheless, GNP channels in both fibers exhibit voids, as the particles are not densely packed. These voids were formed during the coagulation procedure when the DMSO used to disperse GNPs was exchanged with methanol and spaces occupied by methanol remained unfilled after its evaporation. The D-phase fiber with aggregated GNP particles shows inferior GNP dispersion quality (Fig. 2d). This could be the result of their larger number of layers and inconsistent morphologies.
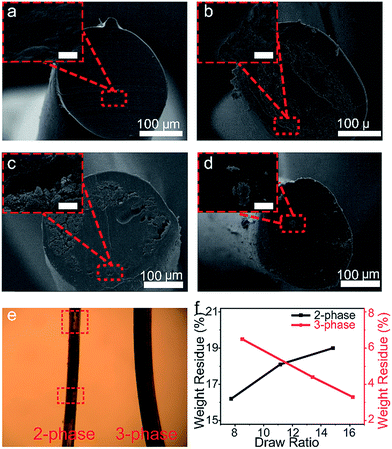 |
| | Fig. 2 Morphological and structural characterization of the un-drawn (a) 1-phase fiber, (b) 2-phase fiber with a zoomed-in image of the polymer–GNP interphase, (c) 3-phase fiber with a zoomed-in image of the polymer–GNP interphase, and (d) D-phase fibers with a zoomed-in image of the dispersed GNPs. The inset images have a scale bar of 5 μm. (e) Transmitted light microscopy demonstrates the continuity of GNP fillers. On the left is the 2-phase fiber and on the right is the 3-phase fiber. (f) TGA of the GNP weight content for the 3-phase fiber and 2-phase fiber as a function of increasing draw ratios. | |
During the heat-drawing process for the 2-phase fiber, the defects of voids caused crack initiations and propagations, with hollow cores and uneven graphene segment distributions along the fiber axis (different SEM cross-sections are shown in Fig. S5†). In contrast, 3-phase fibers after heat-drawing displayed a high degree of graphene continuity and a barely visible GNP channel, indicating that the GNP channel was likely narrowed by exfoliation of the bulk GNP channel (different SEM cross-sections are shown in Fig. S6†). Due to PVA's high transparency, a transmitted light microscope image further shows that the 2-phase fiber is less continuous than 3-phase fibers with visible hollow cores along the fiber (Fig. 2e).
The relationship between GNP weight ratios and draw ratios
TGA of the weight percentage of GNPs at various draw ratios also confirmed the step-wise graphene exfoliation (Fig. 2f and S7†). For 2-phase fibers, the GNP weight percentage increased from 16.2% to 19% with increasing draw ratios, indicating a lower tendency of the GNP channel to exfoliate and elongate compared to the PVA polymer. As a result, the polymer shells shrank along the radial direction while the GNP cores remained more unchanged. In contrast, for 3-phase fibers, the GNPs' weight percentage decreased from 6.5% to 3.3% with increasing draw ratios. In other words, within the fiber cross-sectional area, the channel thickness of graphene compared to that of polymers increased for 2-phase fibers and decreased for 3-phase fibers. The additional polymer core layer in the 3-phase fibers caused a significant difference in the weight percentage compared to the 2-phase fibers due to the facilitating effects from the inner core polymer layer which constrain the intermediate layer of GNPs. Upon drawing at elevated temperatures (i.e., above the glass transition point, Tg), the contact area between the 3-phase fiber and the heat-zone surface may stretch the polymer chains more on the surfaces than the core regions, leading to a shear field applied on the GNP layer. Therefore, the stacked layers in GNPs will first align along the shear-stress direction, following layer slippage with continued shear stress accumulation after complete orientation along the fiber axis. In sum, the decrease in GNPs' weight percentage as a function of drawing temperature in 3-phase fibers proved the step-wise exfoliation of graphene layers. To examine the preferential alignment of graphene, the fiber properties and structures were investigated.
Mechanical performance
The stress–strain curves of the 1-phase, 2-phase, 3-phase, and D-phase fibers after heat-drawing are shown in Fig. 3a. The 1- and 3-phase fibers show lower strain compared to 2- and D-phase fibers. This might be the result of different crystallinity degrees which will be discussed later on. Fig. 3b compares Young's modulus and the tensile strength of the four types of fibers. For 3-phase fibers, the average Young's modulus and tensile strength are 38.8 GPa and 962.9 MPa, respectively, which were 73.5% and 17.3% higher than the values for the 1-phase fiber (22.4 GPa modulus and 821.0 MPa strength). On the other hand, 2-phase fibers show an inferior modulus and strength of 17.5 GPa and 518.1 MPa. Higher standard deviations in their strength generally indicate a correlation between the mechanical performance and the probability of defects presented within the gauge length. As expected, SEM images suggest that fractures mostly occurred around the voids of the 2-phase fibers, as previously discussed, whereas 1-phase and 3-phase fibers show solid fracture cross-sections (Fig. S9†). Young's modulus and strength for the D-phase fiber are 16.7 GPa and 603.2 MPa, respectively. SEM images of the D-phase fiber show large aggregations of GNPs on the surface of the fiber (Fig. S10†). During heat drawing, these defects not only promote fractures but also constrain and reduce the mobility of the polymer chains, resulting in a much lower draw ratio and limited crystallinity. Consequently, the amount of well-dispersed graphene-based materials in mechanically enhanced composite fibers rarely exceeds ∼2 wt% in literature reports.9,27,28
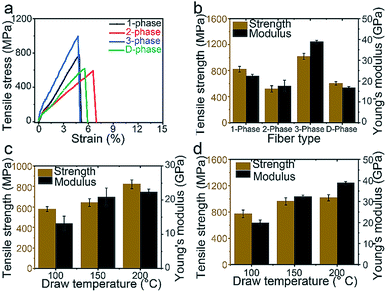 |
| | Fig. 3 Mechanical performance of four types of fibers under uniaxial strain. (a) Stress and strain curve. (b) Tensile strength and Young's modulus of four types of fibers after heat-drawing at 200 °C. (c) Strength and modulus of the 1-phase fiber versus the drawing temperature. (d) Strength and modulus of the 3-phase fiber versus the drawing temperature. | |
X-ray diffraction analysis of polymeric chains
A key factor in the mechanical performance of polymeric fibers is the degree of polymer orientation, which induces higher crystallization and lowers chain entanglement. Fig. 3c and d show the mechanical properties of 1-phase and 3-phase fibers at each drawing temperature, respectively. For both fibers, the tensile strength and modulus increased as the draw ratio increased, indicating an increase in the degree of crystallization. Using Scherrer's equation, crystallite sizes for 1-phase, 2-phase, and 3-phase fibers were determined based on the X-ray diffraction peaks of their (1 0 1) plane, which corresponds to the plane along the fiber axial direction (Fig. S11†). The peaks for 1-phase and 3-phase fibers coincided at ∼7 nm, indicating that the PVA matrix contributed equally to the tensile strength in both samples. Thus, the graphene nanoplatelets must have contributed to the fiber reinforcement. Crystallinity degrees of the PVA matrix were measured to be 68% and 66% for 1-phase and 3-phase fibers, respectively, after drawing at 200 °C (Fig. S11†), indicating that the exfoliation of the bulk GNP channel does not negatively affect the crystallinity of the PVA channels. Furthermore, the draw ratio of the 3-phase fiber (∼16) is higher than that of the 1-phase fiber (∼13), indicating that the middle GNP layer also acted as a lubricant, facilitating the 3-phase polymer chains to be drawn to a higher degree.29 On the contrary, the 2-phase fiber showed a smaller crystallite size, 6.2 nm, and a lower crystallinity degree, 62% (Fig. S11†). This is likely due to the aggregated GNP defects as they promoted fiber fractures during the drawing process, inhibiting the polymer chains to be drawn to their maximum.
GNPs' orientation in 3-phase fibers
The internal structure of the 3-phase fiber was examined by fracturing it in liquid nitrogen to provide a visual confirmation of GNPs' orientation. SEM images show the nanoplatelet morphology before and after heat drawing in Fig. 4a1, a2 and b1, b2. Before drawing, the nanoparticles were loosely distributed with no certain orientation. After drawing, the nanoparticles were more closely packed and aligned along the fiber axis, as indicated by the red arrow in Fig. 4b1.
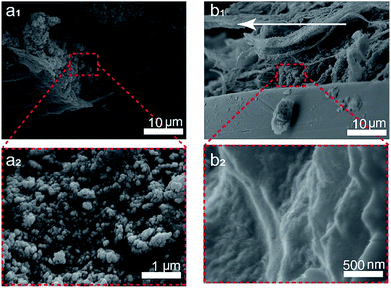 |
| | Fig. 4 SEM images of the fractured 3-phase fiber (a1) before drawing and (b1) after drawing. (a2) and (b2) are the enlarged images of the corresponding area. The arrow indicates the fiber axis. | |
Raman spectroscopy was further used to quantify the spatial orientation of GNPs. Previous studies suggest that the 2D band intensity (I2D) of graphene-based materials shows strong angular dependency on the incident light angle.30–33 A 3-phase fiber sample was set up with a polarized laser focused in the middle and side sections of the GNP channel as shown in Fig. 5a1 and a2. Raman spectra were obtained by changing the angle ϕ between the fiber axis and the polarized laser from 0° to 90°, as shown in Fig. S12.† The signature D, G, and 2D bands matched those of the raw GNPs at ∼1350 cm−1, ∼1530 cm−1, and ∼2750 cm−1. Since the GNPs are aligned along the fiber axis, I2D does not vary with the incident angle when the laser is focused on the middle section of the channel (Fig. 5b). On the other hand, when the laser is focused on the side section of the fiber, I2D indicated a decrease as ϕ increased from 0° to 90°. The normalized intensity was fitted to an orientation distribution function (ODF),31 as shown in Fig. 5c and eqn (1):
| |  | (1) |
where
ϕ is the angle between the fiber axis and the incident laser. 〈
P2(cos
![[thin space (1/6-em)]](https://www.rsc.org/images/entities/char_2009.gif) θ
θ)〉 and 〈
P4(cos
![[thin space (1/6-em)]](https://www.rsc.org/images/entities/char_2009.gif) θ
θ)〉 are the second- and fourth-order Legendre polynomials with fitted values of 0.55 and 0.67. Usually, 〈
P2(cos
![[thin space (1/6-em)]](https://www.rsc.org/images/entities/char_2009.gif) θ
θ)〉 is the primary orientation parameter, while 〈
P4(cos
![[thin space (1/6-em)]](https://www.rsc.org/images/entities/char_2009.gif) θ
θ)〉 reconstructs the complete ODF.
31 Because the GNPs have a plate/spherical shape, the ODF expression assumes that the nanoparticles are uniaxially symmetric, explaining the mismatches between the data and the fitted curve.
32 The Krenchel factor
η0 measures the orientation of the nanoparticles, with
η0 = 1 being a perfect alignment and 1/5 indicating a random 3D orientation. By integrating the ODF over the whole space,
η0 is shown as:
| |  | (2) |
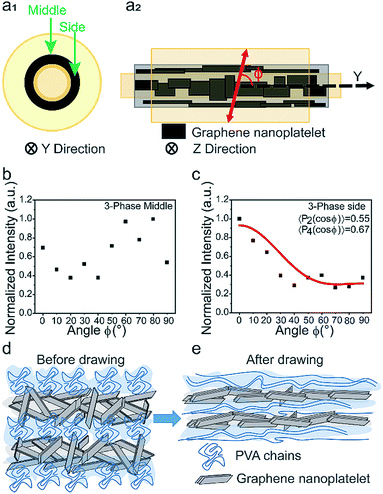 |
| | Fig. 5 Raman spectroscopy data and illustration of the alignment process. (a1) Cross-sectional view (along the fiber axis, y-axis) of the 3-phase fiber showing middle and side sections for Raman spectroscopy tests. (a2) Top view (perpendicular to the y-axis). (b) The normalized 2D band for the middle section shows no obvious angular dependency. (c) The normalized 2D band for the side section shows strong angular dependency on 〈P2(cos![[thin space (1/6-em)]](https://www.rsc.org/images/entities/char_2009.gif) θ)〉 = 0.55 and 〈P4(cos θ)〉 = 0.55 and 〈P4(cos![[thin space (1/6-em)]](https://www.rsc.org/images/entities/char_2009.gif) θ)〉 = 0.67. (d and e) Schematics showing the mechanism of alignment and exfoliation of the GNP channel. θ)〉 = 0.67. (d and e) Schematics showing the mechanism of alignment and exfoliation of the GNP channel. | |
By substituting the second- and fourth-Legendre polynomial, η0 is determined to be 0.8.
To explain the high orientation factor of the 3-phase fiber, we propose the microstructure model shown in Fig. 5d. Before drawing, PVA chains are in an amorphous/barely crystallized state, surrounding the misaligned graphene nanoplatelets. The thickness of the GNP channel is relatively large due to the 3-D printed spinneret outlet dimension. To facilitate graphene orientation, 3-phase fibers were drawn quickly at three different temperatures (100, 150, and 200 °C). During this process, the layered fiber structure would enter a temperature gradient with higher temperature acting on the outer polymer chains. As a result, the outer polymer layer would be stretched to a higher degree than that in the inner channel. Since graphene nanoplatelets do not interpenetrate the surrounding polymer chains, the two polymer layers would slide and generate a shear stress acting on the GNPs, causing step-wise exfoliation of the stacked nanoparticles and orient them in the axial direction. On the other hand, the shear stress generated in the 2-phase fibers is insufficient to constrain the GNP channel, resulting in their aggregation during the drawing process. Fig. 5e shows the resulting GNP channel in the 3-phase fiber where the GNP channel is exfoliated and the nanoparticles are better oriented. Moreover, the exfoliation efficiency and alignment degree of the 3-phase fiber is heavily dependent on the starting channel thickness and can be controlled by the spinneret outlet dimension and air gap distance. If the intermediate layer thickness is too large, the exfoliation efficiency is low, resulting in similar voids and aggregates as those in the 2-phase fiber (Fig. S13†).
Mechanical analysis
The effective Young's modulus and tensile strength of the GNPs were also investigated using the modified rule-of-mixture method, as:| | | Ec = η0VfEf + (1 − Vf)Em | (3) |
| | | σc = η0Vfσf + (1 − Vf)σm | (4) |
where Ec, Em, and Ef represent Young's modulus and σc, σm, and σf represent the tensile strength of the composite fiber, polymer matrix, and GNPs, respectively. Vf is the volume fraction of the GNPs in the composite fiber. By substituting η0 = 0.8, Ef was determined to be ∼1000 GPa, which corresponds to the theoretical modulus for single-layered graphene18 and is on the same scale as multiple layer graphene materials (∼400 GPa).34 The fiber tensile strength σf was determined to be ∼11 GPa, equal to 1/9 of the theoretical tensile strength of single-layered graphene. The lower tensile strength was likely the result of the high number of defects shown earlier in Raman spectroscopy (Fig. S3†), as strength is usually considered a defect-limited property. In addition, the ABS 3-D printed spinneret inevitably generated air bubbles during the spinning process. After the solvent exchange procedure, evaporated methanol created voids that were not fully filled during post drawing, which could also weaken the fiber strength. Moreover, the GNPs used were not surface modified to accommodate PVA's hydroxyl group, resulting in poor load transfer between the GNPs and the polymer matrix.
Electrical conductivity of the 3-phase fiber
For the solution mixing method, conductive nanoparticles usually lose their 3-dimensional bridged structure upon high ratio drawing.35 In contrast, the proposed highly aligned continuous GNP channel promotes superior electrical conductivity. Resistance was measured for all fiber types, and conductivity was calculated following eqn (5):| |  | (5) |
where σ, R, r, and L are the electrical conductivity, resistance, fiber radius, and fiber length, respectively. Fig. 6a exhibits both Young's modulus and electrical conductivity as a function of the draw ratio at room temperature for the 3-phase fiber. Both conductivity and modulus increase with the draw ratio. The conductivity ultimately reaches 0.38 S m−1 while maintaining a modulus of 38.8 GPa. This indicates that the alignment of GNPs also enhances the interactions between each platelet, creating more efficient pathways for electrons. Moreover, the outer PVA layer functions as an insulating layer, giving the fiber more versatile functions. On the other hand, 1-phase, 2-phase, and D-phase fibers showed electrical insulation behaviors due to the insulating nature of PVA and the disrupted nanofiller network generated during the drawing process.
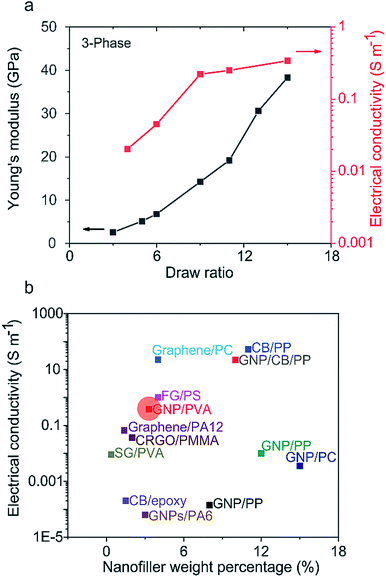 |
| | Fig. 6 (a) Electrical conductivity and Young's modulus versus the draw ratio for the 3-phase fiber. (b) Comparison of electrical conductivity of this work (marked in the red circle) with selected previous studies: GNP/PP,37,38 GNP/CB/PP,38 CB/PP,38 FG/PS,39 GNP/PC,40 CB/epoxy,41 graphene/PA12,42 CRGO/PMMA,43 SG/PVA,44 graphene/PC,45 and GNPs/PA6.46 PP: polypropylene, CB: carbon black, FG: foliated graphite, PS: polystyrene, PC: polycarbonate, PA12: polyamide 12, CRGO: chemically reduced graphene oxide, PMMA: poly(methyl methacrylate), SG: sulfonated graphene, and PA6: polyamide 6. | |
Fig. 6b compares our work with selected previous studies on conductive polymer composites with various nanoparticle types and weight percentages that are all closely related to the percolation threshold where nanoparticles form an inter-bridged conductive network inside the polymer matrix. However, these nanoparticles are usually poorly aligned, causing electrons to pass through a collection of in-plane and transverse pathways, resulting in limited conductivity.36 On the other hand, the 3-phase fiber's microstructure improved the nanocarbon/nanocarbon contact area and facilitated an electron path parallel to the aligned in-plane direction.
Conclusion
We have developed a tri-axial micro-structured 3-phase fiber that promotes the alignment of a continuous GNP channel, resulting in 73.5% (38 GPa) and 17.3% (962.9 MPa) improvement in Young's modulus and tensile strength, respectively. This 3-phase fiber possesses an electrical conductivity of 0.38 S m−1, which is several orders of magnitude larger than that of previously reported GNP-based fibers. We believe that such a microstructure can be further applied to align 2D materials beyond graphene, including boron nitride (BN), molybdenum disulfide (MoS2), and MXenes, giving rise to functional properties such as electrical or thermal conductivities. In addition, the in-house engineered spinneret allows the tri-axial phase fiber to be spun at a pilot scale, which is essential for industrial level needs.
Conflicts of interest
The authors declare no competing financial interest.
Acknowledgements
This work is funded by the start-up fund from Arizona State University (ASU), the Global Sports Institute (GSI), and the U.S. National Science Foundation (NSF).
Notes and references
- S. Stankovich, D. A. Dikin, G. H. B. Dommett, K. M. Kohlhaas, E. J. Zimney, E. A. Stach, R. D. Piner, S. B. T. Nguyen and R. S. Ruoff, Nature, 2006, 442, 282–286 CrossRef CAS PubMed.
- P. C. Sherrell and C. Mattevi, Mater. Today, 2016, 19, 428–436 CrossRef CAS.
- S. R. Shin, R. Farzad, A. Tamayol, V. Manoharan, P. Mostafalu, Y. S. Zhang, M. Akbari, S. M. Jung, D. Kim, M. Comotto, N. Annabi, F. E. Al-Hazmi, M. R. Dokmeci and A. Khademhosseini, Adv. Mater., 2016, 28, 3280–3289 CrossRef CAS PubMed.
- S. Sridar, Z. Qiao, N. Muthukrishnan, W. Zhang and P. Polygerinos, Front. Robot. AI, 2018, 5, 1–9 CrossRef.
- J. J. Park, W. J. Hyun, S. C. Mun, Y. T. Park and O. O. Park, ACS Appl. Mater. Interfaces, 2015, 7, 6317–6324 CrossRef CAS PubMed.
- P. Polygerinos, K. C. Galloway, E. Savage, M. Herman, K. O'Donnell and C. J. Walsh, Proc. - IEEE Int. Conf. Robot. Autom., 2015, 2913–2919 Search PubMed.
- L. Jin, C. Bower and O. Zhou, Appl. Phys. Lett., 1998, 73, 1197–1199 CrossRef CAS.
- S. Mo, L. Peng, C. Yuan, C. Zhao, W. Tang, C. Ma, J. Shen, W. Yang, Y. Yu, Y. Min and A. J. Epstein, RSC Adv., 2015, 5, 97738–97745 RSC.
- X. Zhao, Q. Zhang, D. Chen and P. Lu, Macromolecules, 2010, 43, 2357–2363 CrossRef CAS.
- J. Li, L. Shao, X. Zhou and Y. Wang, RSC Adv., 2014, 4, 43612–43618 RSC.
- Y. Ma, D. Bai, X. Hu, N. Ren, W. Gao, S. Chen, H. Chen, Y. Lu, J. Li and Y. Bai, ACS Appl. Mater. Interfaces, 2018, 10, 3002–3010 CrossRef CAS PubMed.
- W. Qin, F. Vautard, L. T. Drzal and J. Yu, Composites, Part B, 2015, 69, 335–341 CrossRef CAS.
- U. Khan, K. Young, A. O'Neill and J. N. Coleman, J. Mater. Chem., 2012, 22, 12907–12914 RSC.
- C. F. Cao, G. D. Zhang, L. Zhao, L. X. Gong, J. F. Gao, J. X. Jiang, L. C. Tang and Y. W. Mai, Compos. Sci. Technol., 2019, 171, 162–170 CrossRef CAS.
- N. J. Huang, C. F. Cao, Y. Li, L. Zhao, G. D. Zhang, J. F. Gao, L. Z. Guan, J. X. Jiang and L. C. Tang, Composites, Part B, 2019, 168, 413–420 CrossRef CAS.
- H. Xu, Y. Li, N. J. Huang, Z. R. Yu, P. H. Wang, Z. H. Zhang, Q. Q. Xia, L. X. Gong, S. N. Li, L. Zhao, G. D. Zhang and L. C. Tang, J. Hazard. Mater., 2019, 363, 286–294 CrossRef CAS PubMed.
- L. Z. Guan, L. Zhao, Y. J. Wan and L. C. Tang, Nanoscale, 2018, 10, 14788–14811 RSC.
- C. Lee, X. Wei, J. W. Kysar and J. Hone, Science, 2008, 321, 385–388 CrossRef CAS PubMed.
- J. P. Lu, J. Phys. Chem. Solids, 1997, 58, 1649–1652 CrossRef CAS.
- L. C. Tang, Y. J. Wan, D. Yan, Y. B. Pei, L. Zhao, Y. B. Li, L. Bin Wu, J. X. Jiang and G. Q. Lai, Carbon, 2013, 60, 16–27 CrossRef CAS.
- J. Liang, Y. Huang, L. Zhang, Y. Wang, Y. Ma, T. Cuo and Y. Chen, Adv. Funct. Mater., 2009, 19, 2297–2302 CrossRef CAS.
- T. Ramanathan, A. A. Abdala, S. Stankovich, D. A. Dikin, M. Herrera-Alonso, R. D. Piner, D. H. Adamson, H. C. Schniepp, X. Chen, R. S. Ruoff, S. T. Nguyen, I. A. Aksay, R. K. Prud'Homme and L. C. Brinson, Nat. Nanotechnol., 2008, 3, 327–331 CrossRef CAS PubMed.
- C. Shao, H. Y. Kim, J. Gong, B. Ding, D. R. Lee and S. J. Park, Mater. Lett., 2003, 57, 1579–1584 CrossRef CAS.
- J. G. Um, Y. S. Jun, H. Alhumade, H. Krithivasan, G. Lui and A. Yu, RSC Adv., 2018, 8, 17091–17100 RSC.
- A. C. Ferrari, Solid State Commun., 2007, 143, 47–57 CrossRef CAS.
- Y. Hernandez, V. Nicolosi, M. Lotya, F. M. Blighe, Z. Sun, S. De, I. T. McGovern, B. Holland, M. Byrne, Y. K. Gun'ko, J. J. Boland, P. Niraj, G. Duesberg, S. Krishnamurthy, R. Goodhue, J. Hutchison, V. Scardaci, A. C. Ferrari and J. N. Coleman, Nat. Nanotechnol., 2008, 3, 563–568 CrossRef CAS PubMed.
- S. R. Ahmad, R. J. Young and I. A. Kinloch, Int. J. Chem. Eng. Appl., 2015, 6, 1–5 CAS.
- A. Bisht, K. Dasgupta and D. Lahiri, J. Appl. Polym. Sci., 2018, 135, 1–11 CrossRef.
- K. Song, Y. Zhang, J. Meng and M. L. Minus, J. Appl. Polym. Sci., 2013, 127, 2977–2982 CrossRef CAS.
- Q. Liang, X. Yao, W. Wang, Y. Liu and C. P. Wong, ACS Nano, 2011, 5, 2392–2401 CrossRef CAS PubMed.
- Z. Li, R. J. Young, I. A. Kinloch, N. R. Wilson, A. J. Marsden and A. P. A. Raju, Carbon, 2015, 88, 215–224 CrossRef CAS.
- Z. Li, R. J. Young, N. R. Wilson, I. A. Kinloch, C. Vallés and Z. Li, Compos. Sci. Technol., 2016, 123, 125–133 CrossRef CAS.
- H. G. Chae, M. L. Minus and S. Kumar, Polymer, 2006, 47, 3494–3504 CrossRef CAS.
- R. J. Young, L. Gong, I. A. Kinloch, I. Riaz, R. Jalil and K. S. Novoselov, ACS Nano, 2011, 5, 3079–3084 CrossRef CAS PubMed.
- J. W. Kim and J. S. Lee, Fibers Polym., 2017, 18, 81–87 CrossRef CAS.
- S. Wu, R. B. Ladani, J. Zhang, E. Bafekrpour, K. Ghorbani, A. P. Mouritz, A. J. Kinloch and C. H. Wang, Carbon, 2015, 94, 607–618 CrossRef CAS.
- P. Steurer, R. Wissert, R. Thomann and R. Mülhaupt, Macromol. Rapid Commun., 2009, 30, 316–327 CrossRef CAS PubMed.
- E. Nilsson, H. Oxfall, W. Wandelt, R. Rychwalski and B. Hagström, J. Appl. Polym. Sci., 2013, 130, 2579–2587 CrossRef CAS.
- S. NK and M. RM, J. Appl. Polym. Sci., 2008, 109, 3991–3999 CrossRef.
- J. A. King, M. D. Via, F. A. Morrison, K. R. Wiese, E. A. Beach, M. J. Cieslinski and G. R. Bogucki, J. Compos. Mater., 2012, 46, 1029–1039 CrossRef CAS.
- F. H. Gojny, M. H. G. Wichmann, B. Fiedler, I. A. Kinloch, W. Bauhofer, A. H. Windle and K. Schulte, Polymer, 2006, 47, 2036–2045 CrossRef CAS.
- D. Yan, H. Bin Zhang, Y. Jia, J. Hu, X. Y. Qi, Z. Zhang and Z. Z. Yu, ACS Appl. Mater. Interfaces, 2012, 4, 4740–4745 CrossRef CAS PubMed.
- X. Zeng, J. Yang and W. Yuan, Eur. Polym. J., 2012, 48, 1674–1682 CrossRef CAS.
- R. K. Layek, S. Samanta and A. K. Nacndi, Carbon, 2012, 50, 815–827 CrossRef CAS.
- M. Yoonessi and J. R. Gaier, ACS Nano, 2010, 4, 7211–7220 CrossRef CAS.
- B. A. Weise, K. G. Wirth, L. Völkel, M. Morgenstern and G. Seide, Carbon, 2019, 144, 351–361 CrossRef CAS.
Footnote |
| † Electronic supplementary information (ESI) available. See DOI: 10.1039/c9na00191c |
|
| This journal is © The Royal Society of Chemistry 2019 |
Click here to see how this site uses Cookies. View our privacy policy here.  Open Access Article
 a,
Sayli
Jambhulkar
 a,
Rahul
Verma
 b,
Rahul
Franklin
 c,
Dharneedar
Ravichandran
 b and
Kenan
Song
 *d
*d
![[thin space (1/6-em)]](https://www.rsc.org/images/entities/char_2009.gif) 000 g mol−1 and 98–99% degree of hydrolysis. Methanol (ACS reagent, 99.8%, 179337), dimethyl sulfoxide (DMSO, ACS reagent 99.9%, 472301), N,N-dimethylformamide (DMF, ACS reagent, 99.8%, 319937), xylene (ACS reagent, 214736), and toluene (anhydrous, 99.8%, 244511) were purchased from Sigma-Aldrich (St. Louis, MO, USA) and used as received.
000 g mol−1 and 98–99% degree of hydrolysis. Methanol (ACS reagent, 99.8%, 179337), dimethyl sulfoxide (DMSO, ACS reagent 99.9%, 472301), N,N-dimethylformamide (DMF, ACS reagent, 99.8%, 319937), xylene (ACS reagent, 214736), and toluene (anhydrous, 99.8%, 244511) were purchased from Sigma-Aldrich (St. Louis, MO, USA) and used as received.


![[thin space (1/6-em)]](https://www.rsc.org/images/entities/char_2009.gif) θ)〉 and 〈P4(cos
θ)〉 and 〈P4(cos![[thin space (1/6-em)]](https://www.rsc.org/images/entities/char_2009.gif) θ)〉 are the second- and fourth-order Legendre polynomials with fitted values of 0.55 and 0.67. Usually, 〈P2(cos
θ)〉 are the second- and fourth-order Legendre polynomials with fitted values of 0.55 and 0.67. Usually, 〈P2(cos![[thin space (1/6-em)]](https://www.rsc.org/images/entities/char_2009.gif) θ)〉 is the primary orientation parameter, while 〈P4(cos
θ)〉 is the primary orientation parameter, while 〈P4(cos![[thin space (1/6-em)]](https://www.rsc.org/images/entities/char_2009.gif) θ)〉 reconstructs the complete ODF.31 Because the GNPs have a plate/spherical shape, the ODF expression assumes that the nanoparticles are uniaxially symmetric, explaining the mismatches between the data and the fitted curve.32 The Krenchel factor η0 measures the orientation of the nanoparticles, with η0 = 1 being a perfect alignment and 1/5 indicating a random 3D orientation. By integrating the ODF over the whole space, η0 is shown as:
θ)〉 reconstructs the complete ODF.31 Because the GNPs have a plate/spherical shape, the ODF expression assumes that the nanoparticles are uniaxially symmetric, explaining the mismatches between the data and the fitted curve.32 The Krenchel factor η0 measures the orientation of the nanoparticles, with η0 = 1 being a perfect alignment and 1/5 indicating a random 3D orientation. By integrating the ODF over the whole space, η0 is shown as:


