DOI:
10.1039/C9NA00164F
(Paper)
Nanoscale Adv., 2019,
1, 2924-2936
Hydrothermal synthesis of carbon nanodots from bovine gelatin and PHM3 microalgae strain for anticancer and bioimaging applications†
Received
15th March 2019
, Accepted 17th May 2019
First published on 14th June 2019
Abstract
Semi-conductor quantum dots (QDs) are favorite candidates for many applications especially for potential use as optical bioimaging agents. But the major issue of QDs is toxicity. In the present study, carbon nanodots were synthesized using a green hydrothermal approach from gelatin protein using a previously established protocol. However, the PL properties and applications of the as-synthesized CG (bovine gelatin) nanodots were remarkably different from those of previously reported gelatin carbon dots. CG (bovine gelatin) nanodots had sizes greater than the Bohr exciton radius but still had QD like fluorescence characteristics. Furthermore, the results from fluorescence spectroscopy demonstrated a tunable PL emission profile at various excitation wavelengths. Second, carbon nanodots were also synthesized from algal biomass of Pectinodesmus sp. via a green hydrothermal approach, denoted as CA (PHM3 algae) nanodots. A study of the PL properties and surface chemical composition of CG (bovine gelatin) and CA (PHM3 algae) nanodots suggested that the surface chemical composition significantly alters the surface states which directly influence their PL properties. CG (bovine gelatin) nanodots were used for imaging of plant and bacterial cells with good imaging sensitivity comparable to toxic semiconductor quantum dots. Moreover, the results from in vitro studies suggested good anticancer properties of CA (PHM3 algae) and CG (bovine gelatin) nanodots with minimum GI50 values of 0.316 ± 0.447 ng ml−1 (n = 2) and 8.156 ± 6.596 ng ml−1 (n = 2) for HCC 1954 (breast cancer) and 0.542 ± 0.715 ng ml−1 (n = 2) and 23.860 ± 14.524 ng ml−1 (n = 2) for HCT 116 (colorectal cancer) cell lines, respectively.
1 Introduction
Fluorescent nanoparticles with a small size especially gold and silver nanoclusters2,3 have been used extensively in bioimaging applications but they have very poor photostability. Similarly, various organic dyes such as cyanine, fluorescein, rhodamine and green fluorescent proteins have also been used in cell imaging applications;4,5 however, organic dyes significantly suffer from photochemical degradation and photobleaching, which limit long-term cellular tracking6 and green fluorescent proteins are notorious for showing false-positive expression due to background auto-fluorescence.7 Semiconductor quantum dots, for example cadmium selenide (CdSe), are superior to fluorescent proteins and other organic dyes in terms of their optical performance, imaging sensitivity and resistance to metabolic degradation8 but they have their own slew of problems which must be addressed. In addition to their notorious cell cytotoxicity issue9 these quantum dots have surface defects which can affect the recombination of electrons and holes by acting as surface traps, thus causing fluorescence blinking.10 Semiconductor quantum dots have a quite extended lifetime which interferes in biodegradation.11 Moreover, the synthesis of blue emitting semiconductor quantum dots is a tough process because they require smaller sizes than other colour emitting dots.11
Carbon is generally considered as a nontoxic element, barely in the same group as heavy metal containing semiconductor quantum dots and is a promising alternative because of its chemical stability, good dispersibility in water and low photobleaching. Carbon dots have shown potential for bioimaging, drug delivery, photocatalysis, energy conversion, fluorescent inks and sensing applications.12–14 From a bioimaging application prospective, bacterial identification, classification, characterization and microscopic visualization are essential benchmarks for different applications in microbiology and medicine. Current methods in microbiology address bacteria on the population level and detection is performed by visualization of bacterial colonies or by indirect detection of bacterial secreted metabolites.15 Accurate bacterial detection requires identification of individual bacterial cells, and for this purpose different staining techniques, either fluorescent dyes or in some cases QDs, have been used; however, fluorescent dyes are expensive, prone to photobleaching, toxic and difficult to dissolve in water. Therefore, a simple and inexpensive imaging agent to visualize the morphological details of bacterial cells is highly needed.
The agronomic application of nanotechnology requires an improved understanding of the interaction between nanoparticles and plant response. Metallic oxides, such as nano-TiO2 can increase plant growth16 but there is no fluorescent probe for tracking the transport system to explain the mechanisms that affect plant growth. CdSe/ZnS quantum dots can be used as optical imaging agents in vivo. However, they are toxic to the organisms and negatively impact the environment. Therefore a nontoxic fluorescent imaging agent which can be used to track the progress of nutrient/nanoparticle uptake, their transportation and mark the nutrient content in the nutrient solution via a visual measurement technique is required. In addition, the imaging agent could help to quantify the plant structure, physiological status and performance in different environment, the knowledge of which can meet the requirement of high throughput genotyping. Carbon dots can thus be proposed as an advanced platform for bioimaging applications because of their fluorescence features. Since their discovery, several top–down methods have been proposed to synthesize fluorescent carbon dots. In these approaches carbon dots are synthesized through electro-oxidation, laser ablation using graphite, and acid-assisted chemical oxidation.17,12 However, these approaches require very harsh multistep chemical reactions, toxic reagents and special equipment. Numerous bottom–up methods have been reported to synthesize carbon dots which are relatively simple, cost effective, and environment friendly. Several such approaches use glucose, glycol, sucrose, glycerol, citric acid etc. for the synthesis of carbon dots through hydrothermal treatment18 microwave assisted approaches19 and thermal decomposition.20 Recently, major attention has been diverted to the use of natural resources for the synthesis of carbon nanodots through a hydrothermal carbonization route because this route requires a minimal experimental setup; moreover, synthesized carbon dots often have excellent PL properties with high quantum yield. For example, carbonization of orange peels,21 soy milk,22 milk,23 pomegranate,24 and gram25 is carried out. Despite enormous research, the fluorescent emission of carbon dots is still not clear and there is a constant debate on the source of fluorescence in carbon dots. In fact, carbon dots produced through diverse synthetic routes and precursors often show different optical behaviour as the wavelength of the maximum intensity varies depending on the carbon source, synthesis route and surface passivating agents;26 thus the different nature of carbon dots can be studied to understand the complex photoluminescent emission.
In the present study, carbon nanodots are prepared from gelatin (type B extracted from bovine) and freshwater microalgae (Pectinodesmus sp.). Gelatin is basically an inexpensive polymer derived from skin, bones and connective tissue of animals such as cattle, pigs, chicken and fish27 with good medicinal and antioxidant properties28 and microalgae synthesize a range of nutraceuticals such as lipids, minerals, vitamins, proteins and polysaccharides and these algal bioactive compounds have remarkable activities with the potential to cure cancer inflammation, oxidative stress and other degenerative diseases.29 Considering the aforementioned fascinating medicinal properties, CG (bovine gelatin) nanodots and CA (PHM3 algae) nanodots were synthesized through a hydrothermal carbonization method and were further characterized and tested for their anticancer and bioimaging properties.
2 Experimental section
2.1 Synthesis of fluorescent CG (bovine gelatin) nanodots
For the synthesis of carbon nanodots, 1 g of analytical grade bovine gelatin protein (CAS 9000-70-8 Santa Cruz biotechnology) was dissolved in 50 ml of deionized water at 50–60 °C under constant stirring for 10–15 minutes. The light yellowish mixture was poured into a Teflon autoclave and heated at three different temperatures i.e. 120 °C, 160 °C, and 200 °C for 3 hours. After the reaction, the autoclave was cooled to room temperature. The resultant yellow-brown solution was centrifuged at 16![[thin space (1/6-em)]](https://www.rsc.org/images/entities/char_2009.gif) 000 rpm for 30 min followed by filtration using a 0.45 μm syringe to remove large size particles and the resulting dark yellow solution of CG (bovine gelatin) nanodots was used for further characterization.
000 rpm for 30 min followed by filtration using a 0.45 μm syringe to remove large size particles and the resulting dark yellow solution of CG (bovine gelatin) nanodots was used for further characterization.
2.2 Synthesis of fluorescent CA (PHM3 algae) nanodots
The algal strain Pectinodesmus sp. Strain PHM3 (LC159307)30 was sub-cultured in liquid BBM (Bold’s basal media). Flasks containing the microalgal inoculum were illuminated with a white fluorescent lamp at 100 μmol photons per m2 per s with a 25 hour light cycle. Continuous aeration was ensured using aquarium air pumps and the culture temperature was maintained at 26–28 °C. After 14 days of growth, the microalgae were harvested and dried for further experiments.
A dry smashed powder of microalgae (1 g) was dissolved in 50 ml of deionized water at 50–60 °C under constant stirring for 10–15 minutes. The light green mixture was poured into the Teflon autoclave and heated at 200 °C for 3 hours. After the reaction, the autoclave was cooled to room temperature. The resultant dark green solution was centrifuged at 16000 rpm for 30 min followed by filtration using a 0.45 μm syringe to remove large size particles and the resulting dark green solution of CA (PHM3 algae) nanodots was used for further characterization.
2.3 Characterization
2.3.1 Optical characterization.
Synthesis of carbon nanodots was initially confirmed by UV-vis spectrophotometry (UVD-2950, LA, USA) between 200–800 nm. De-ionized water was run as a reference before recording the absorption spectra. The concentration of carbon nanodots was measured using the Beer–Lambert law; the molar extinction coefficient of carbon nanoparticles was 1.0 × 10⁵ M−1 cm−1. The fluorescence spectra were recorded with a Configuration-Fluoromax-4C-1426D-4115-FM spectrophotometer. The photostability was investigated under continuous illumination of a 365 nm UV lamp (UVP). An OPTIKA B-350 fluorescent microscope equipped with a DCM 130, a blue excitation filter (λ = 450–480 nm) and a green excitation filter (λ = 510–550 nm) was used for imaging experiments.
2.3.2 Morphology.
The morphology of the carbon nanodots was characterized using SEM (Joel JSM-6490LA, Tokyo, Japan); the scanning was done at 20 eV at a magnification of 50000×. For SEM analysis, a drop of CG (bovine gelatin) and CA (PHM3) nanodots was added to 10 ml of deionized water and dried under a lamp. The procedure was followed by gold coating of the sample for surface conduciveness using a sputter coater. The specimen after coating was placed on stubs using conductive tape for analysis. EDS of samples was performed at 20 eV and probe current 1 mA, to detect carbon nanodots. XRD analysis was performed on a STOE theta/theta diffractometer (XRD) using Cu Kα radiation (λ = 1.5406 Å). Zeta potential measurements of the carbon nanodots were performed using a Zetasizer Ver. 7.10 at 25 °C at pH 7 in an aqueous medium.
2.3.3 Chemical composition.
FTIR analysis was performed using a PerkinElmer Spectrum-100 spectrometer with a scanning wavelength range of 450–4000 cm−1. CG (bovine gelatin) nanodots, CA (PHM3 algae) nanodots, bovine gelatin and PHM3 algal extract were analysed for the presence of functional groups on the surface.
2.4 Anti-cancer activity
Cancer cell lines HCC 1954 (human breast cancer cells) and HCT 116 (human colorectal cancer cells) were sourced from ATCC. For anticancer activity, sulforhodamine B (SRB) proliferation assay was used. Cells from each cell line (HCC 1954 human breast cancer cells and HCT 116 human colorectal cancer cells) were seeded at optimized seeding density in 96-well plates and incubated overnight at 37 °C in a humidified incubator with 5% CO2. Nine three-fold dilutions (starting from 5000 ng ml−1) of CG (bovine gelatin) and CA (PHM3 algae) nanodots were added to the cells. Cells treated with CG (bovine gelatin) and CA (PHM3 algae) nanodots in 96-well plates were further incubated at 37 °C in the humidified incubator with 5% CO2 for 72 hours, before proceeding with the sulforhodamine B (SRB) assay. Following incubation with the CA (PHM3 algae) and CG (bovine gelatin) nanodots for 72 hours, the cells were fixed with ice-cold trichloroacetic acid TCA (3% final concentration) at 4 °C for at least 2 hours. The plates were then washed 4 times with water and dried in a 37 °C oven for 20 minutes. Fixed cells were then stained by adding 100 μl of 0.05% SRB solution per well followed by incubation for at least 30 minutes at room temperature. The SRB solution was removed from the plates by washing four times with 1% acetic acid (in water) and plates were dried in a 37 °C oven for 20 minutes. To each of these dried plates, 100 μl of 10 mM Tris (pH 10.5) was added per well using a multidrop dispenser and placed on a plate-shaker for 5 min to solubilize SRB. A plate reader was then used to measure the optical density in triplicate at a wavelength of 490 nm. GI50 values were then determined from the plot of the dose response curve between log of CA (PHM3 algae) and CG (bovine gelatin) nanodot concentration and percentage cell growth inhibition using GraphPad PRISM software.
2.5
E. coli imaging experiment
E. coli was cultured in a clean sterile environment. The consumables used for culturing of E. coli were sterilized in an autoclave for 2 hours at 15 psi pressure. E. coli was cultured in sterile LB media containing 1 g of yeast extract, 2 g of tryptone and 1.0 g of NaCl in 100 ml distilled water. With the help of a streaking loop, a colony was picked from the E. coli LB agar plate and incubated in LB media. Bacterial cultures were grown overnight at 37 °C in a shaking incubator. Following overnight shaking, approximately 1.5 ml of culture media was centrifuged at 10000 rpm for 10 min to discard the supernatant, and the bacterial pellet was washed and resuspended in 1 ml of 0.01 M PBS buffer.
CG (bovine gelatin) nanodot (200 μl) solutions at a concentration of 2 mg ml−1 and 4 mg ml−1 were prepared for the reaction with 400 μl of E. coli (10−7 cfu ml−1) for 3 hours at 37 °C with gentle shaking. For the control experiment, bacterial cells were incubated in PBS buffer. After 3 hours these solution mixtures were centrifuged at 10000 rpm for 10 min to remove unbound CG (bovine gelatin) nanodots, the supernatant was discarded, and the pellet obtained was washed thrice with 0.01 M PBS and resuspended in 0.01 M PBS solution. For imaging experiment 20 μl of bacterial cell suspension was immobilized on a microscopic slide by using 1 × 1 cm agarose pads.31
2.6 Imaging of Allium cepa (onion) epidermal cells
The epidermal layer of cells was peeled off from an onion with the help of a knife. The cells were washed with PBS buffer and the epidermal layer of cells was incubated in 2 mg ml−1 of CG (bovine gelatin) nanodot solution for 16 hours at room temperature. After 16 hours, the epidermal cells were washed twice with PBS buffer to remove unbound CG (bovine gelatin) nanodots. Control epidermal cells were incubated in PBS buffer without CG (bovine gelatin) nanodots. For the imaging experiment the epidermal layer of cells was transferred to the microscopic slide.
3 Results and discussion
3.1 Optical characteristics of CG (bovine gelatin) and CA (PHM3 algae) nanodots
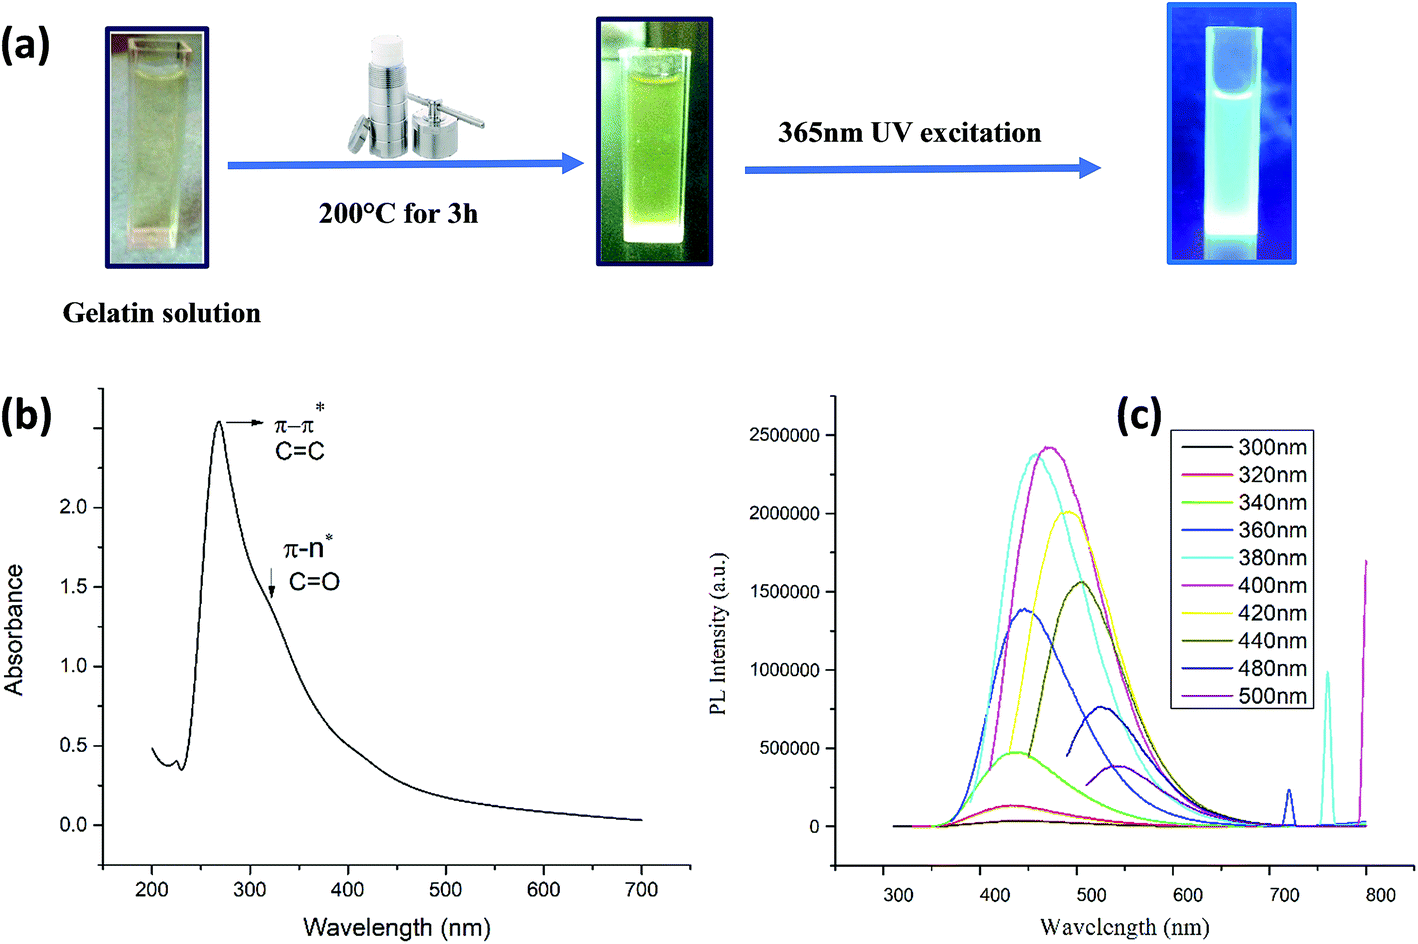
As shown in Fig. 1a and Fig. 2a, hydrothermal treatment of gelatin and microalgae at 200 °C for 3 hours yielded a dark yellow and dark green color, respectively, indicating the generation of carbon nanodots.32
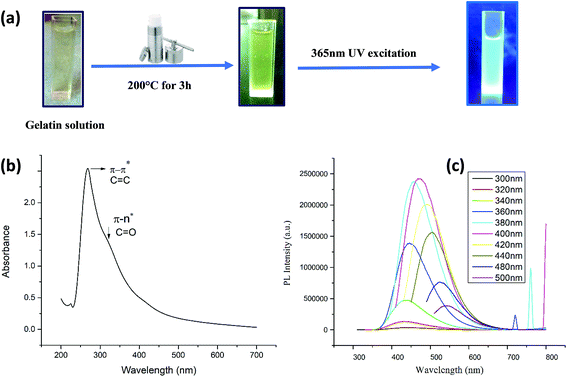 |
| | Fig. 1 (a) Illustration of the preparation process of the CG (bovine gelatin) nanodots by hydrothermal carbonization. (b) UV-visible absorption spectrum and (c) fluorescence spectra of the as-prepared CG (bovine gelatin) nanodot mixtures excited with different wavelengths of light. | |
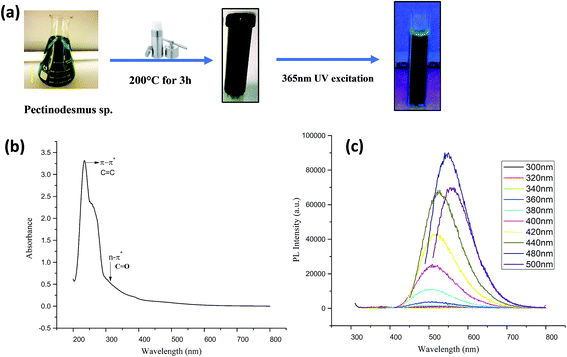 |
| | Fig. 2 (a) Illustration of the preparation process of CA (PHM3 algae) nanodots through hydrothermal carbonization. (b) UV-visible absorption spectrum and (c) fluorescence spectrum of the as-prepared CA (PHM3 algae) nanodots at different excitation wavelengths. | |
The synthesis of carbon nanodots was initially confirmed from the UV-visible absorption spectrum. The UV-vis absorption spectrum of CG (bovine gelatin) nanodots shown in Fig. 1b displays an absorption peak at λmax = 268 nm which is due to π–π* transitions of C![[double bond, length as m-dash]](https://www.rsc.org/images/entities/char_e001.gif) C (aromatic carbon) bonds and a broad shoulder starting from 300 nm which is due to n–π* of CO (carbonyl) bonds and other oxygen-containing functional groups. In case of CA (PHM3 algae) nanodots (Fig. 2b), an absorption peak at 236 nm and another small peak at 254 nm both are in the range of π–π* transitions of CC bonds and a shoulder bend at 300 nm corresponding to n–π* of CO bonds and other oxygenated functional groups.33–35 Note that the absorption band corresponding to n–π* is broader for CG (bovine gelatin) nanodots than that of CA (PHM3 algae) nanodots. The difference can be due to variations in the surface chemistry of two types of nanoparticles. The PL spectra of CG (bovine gelatin) nanodots under different excitation wavelengths shown in Fig. 1c display that the PL intensity increases with an increase in the excitation wavelength, and the PL intensity increases from 360 nm (excitation wavelength) to 400 nm (excitation wavelength) at which the strongest intensity is observed corresponding to the emission maxima at 472 nm. The fluorescence intensity depends on the number of particles being excited at a specific wavelength since maximum CG (bovine gelatin) nanodots were excited at 400 nm (excitation wavelength), resulting in an enhanced PL intensity. The emission peaks are shifted to high wavelengths with decreasing intensities with further increase in the excitation wavelength. Under the irradiation of a 365 nm UV lamp, the aqueous solution of CG (bovine gelatin) nanodots turns blue (Fig. 1a). In the case of CA (PHM3 algae) nanodots, the spectral lines are strongly red shifted (Fig. 2c). The spectral lines of CA (PHM3 algae) nanodots do not show a significant change in the emission wavelength when the excitation wavelength was increased from 300 nm to 440 nm; however, further increase in the excitation wavelength causes a sharp red shift with the maximum intensity at 480 nm excitation wavelength corresponding to an emission wavelength of 548 nm; the emission intensity decreases with red shift when the excitation wavelength is increased to 500 nm. This excitation-dependent emission observed in CA (PHM3 algae) and CG (bovine gelatin) nanodots is comparable to that in the other documented carbon dots.21,24,36
C (aromatic carbon) bonds and a broad shoulder starting from 300 nm which is due to n–π* of CO (carbonyl) bonds and other oxygen-containing functional groups. In case of CA (PHM3 algae) nanodots (Fig. 2b), an absorption peak at 236 nm and another small peak at 254 nm both are in the range of π–π* transitions of CC bonds and a shoulder bend at 300 nm corresponding to n–π* of CO bonds and other oxygenated functional groups.33–35 Note that the absorption band corresponding to n–π* is broader for CG (bovine gelatin) nanodots than that of CA (PHM3 algae) nanodots. The difference can be due to variations in the surface chemistry of two types of nanoparticles. The PL spectra of CG (bovine gelatin) nanodots under different excitation wavelengths shown in Fig. 1c display that the PL intensity increases with an increase in the excitation wavelength, and the PL intensity increases from 360 nm (excitation wavelength) to 400 nm (excitation wavelength) at which the strongest intensity is observed corresponding to the emission maxima at 472 nm. The fluorescence intensity depends on the number of particles being excited at a specific wavelength since maximum CG (bovine gelatin) nanodots were excited at 400 nm (excitation wavelength), resulting in an enhanced PL intensity. The emission peaks are shifted to high wavelengths with decreasing intensities with further increase in the excitation wavelength. Under the irradiation of a 365 nm UV lamp, the aqueous solution of CG (bovine gelatin) nanodots turns blue (Fig. 1a). In the case of CA (PHM3 algae) nanodots, the spectral lines are strongly red shifted (Fig. 2c). The spectral lines of CA (PHM3 algae) nanodots do not show a significant change in the emission wavelength when the excitation wavelength was increased from 300 nm to 440 nm; however, further increase in the excitation wavelength causes a sharp red shift with the maximum intensity at 480 nm excitation wavelength corresponding to an emission wavelength of 548 nm; the emission intensity decreases with red shift when the excitation wavelength is increased to 500 nm. This excitation-dependent emission observed in CA (PHM3 algae) and CG (bovine gelatin) nanodots is comparable to that in the other documented carbon dots.21,24,36
The reason for this excitation-dependent emission behavior can be the existence of different particle sizes or the distribution of various surface energy states on the surface of CG (bovine gelatin) and CA (PHM3 algae) nanodots. Under the irradiation of a 365 nm UV lamp, the aqueous solution of CA (PHM3 algae) nanodots turns green (Fig. 2a). Furthermore, the intensity of PL spectra of CA (PHM3 algae) nanodots is low as compared to CG (bovine gelatin) nanodots; the decreased intensity may be attributed to the number of particles being excited at a specific wavelength. In CA (PHM3 algae) nanodots, a smaller number of particles were excited at the excitation wavelength as compared to CG (bovine gelatin) nanodots or alternatively the distribution of surface states allowing a radiative recombination can be less in CA (PHM3 algae).
3.2 Morphology and structural properties of CG (bovine gelatin) and CA (PHM3 algae) nanodots
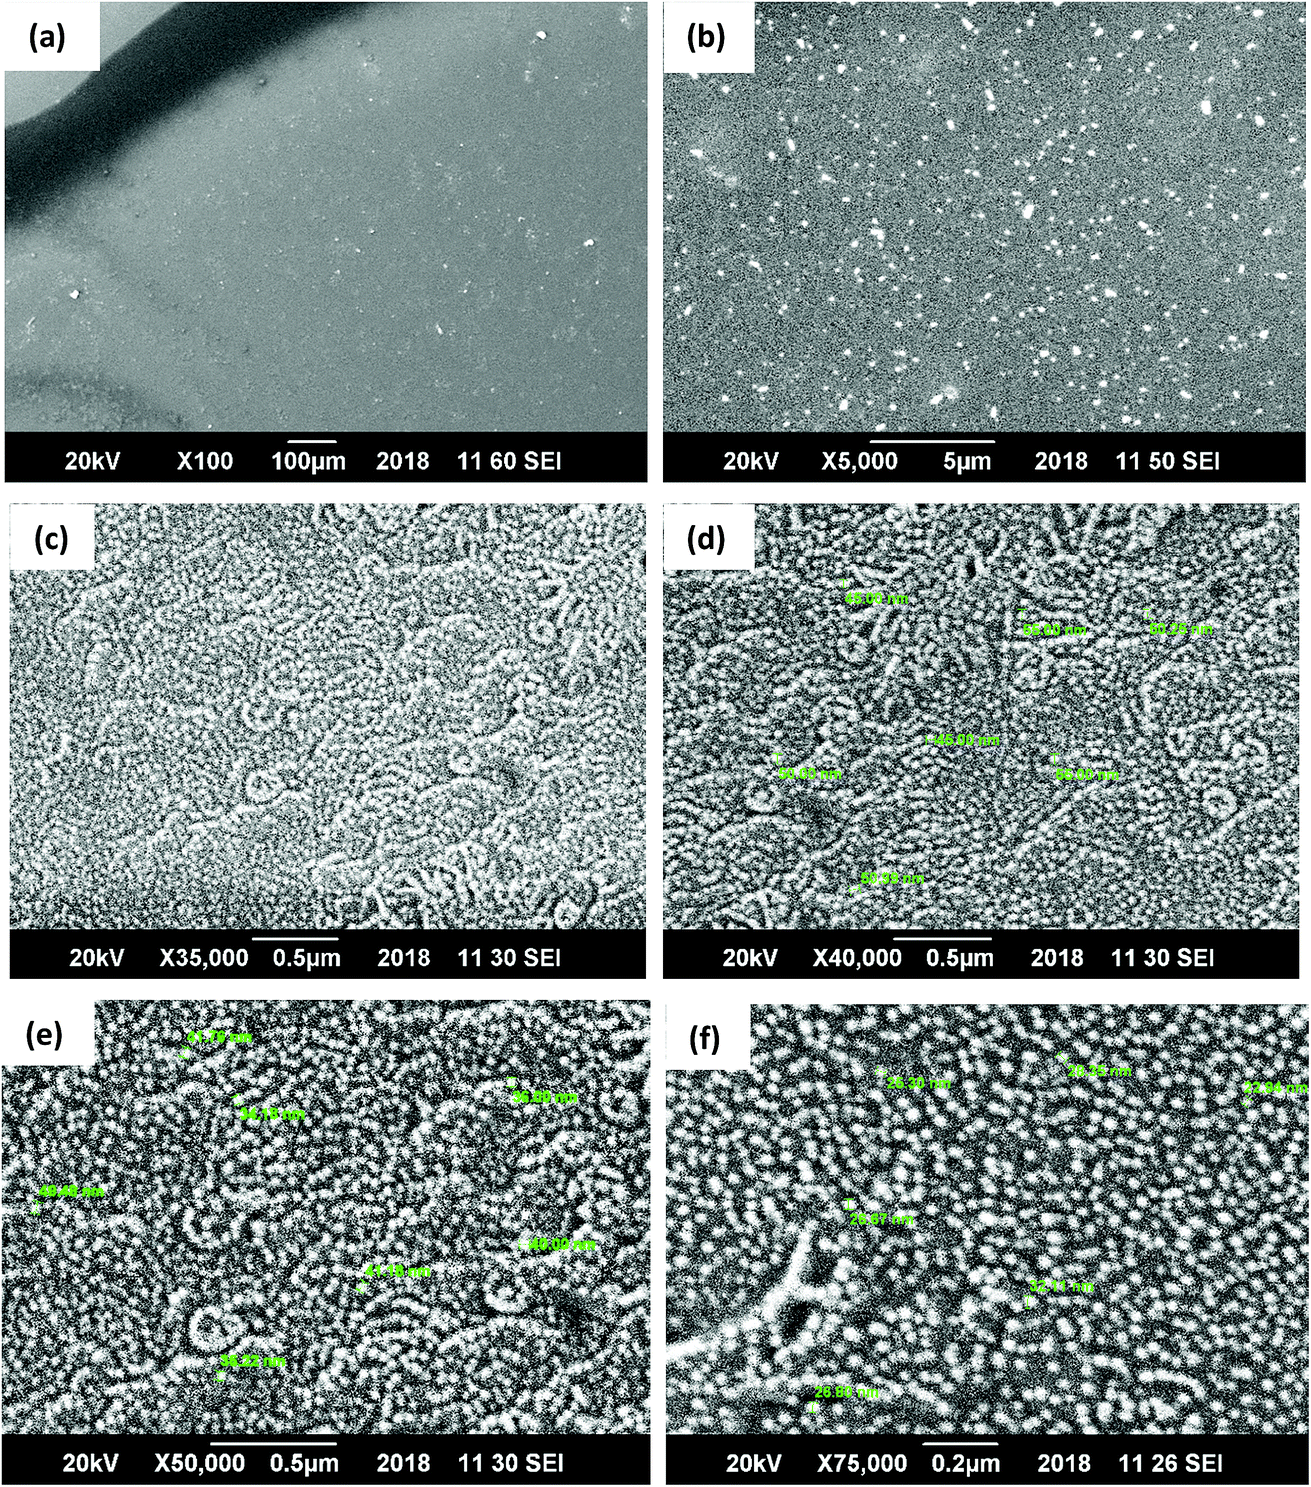
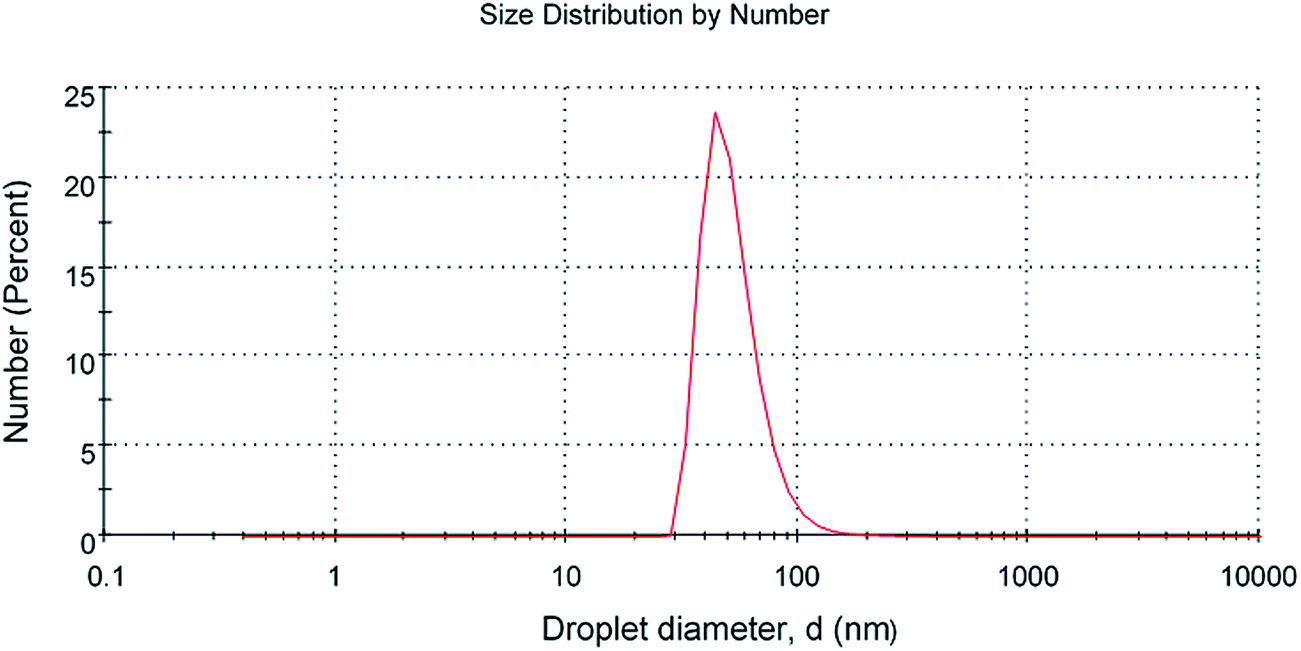
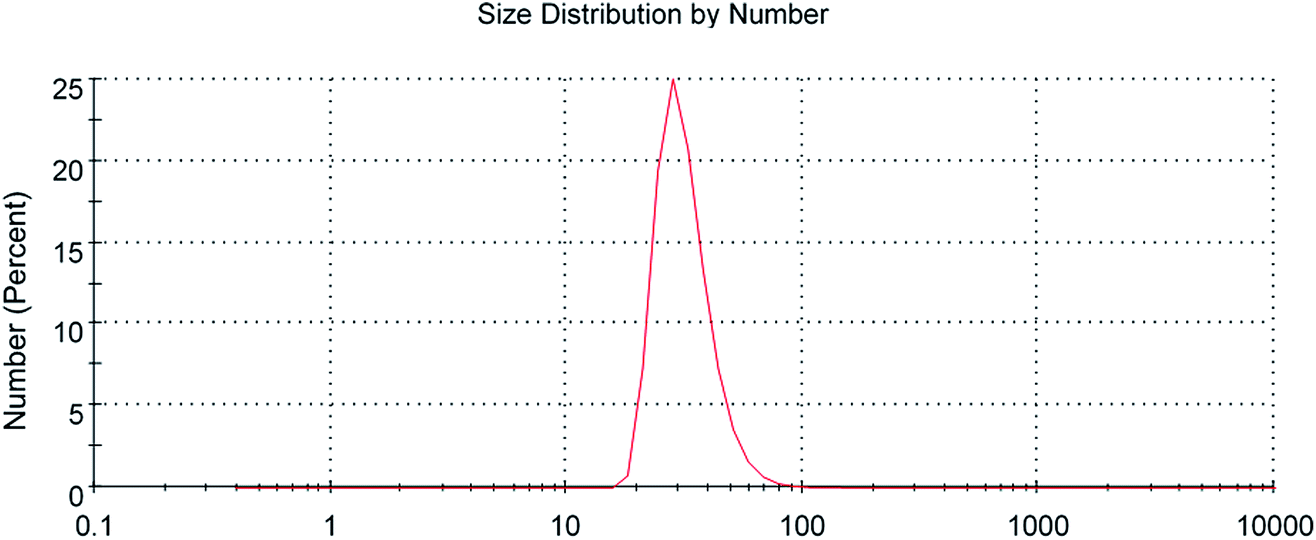
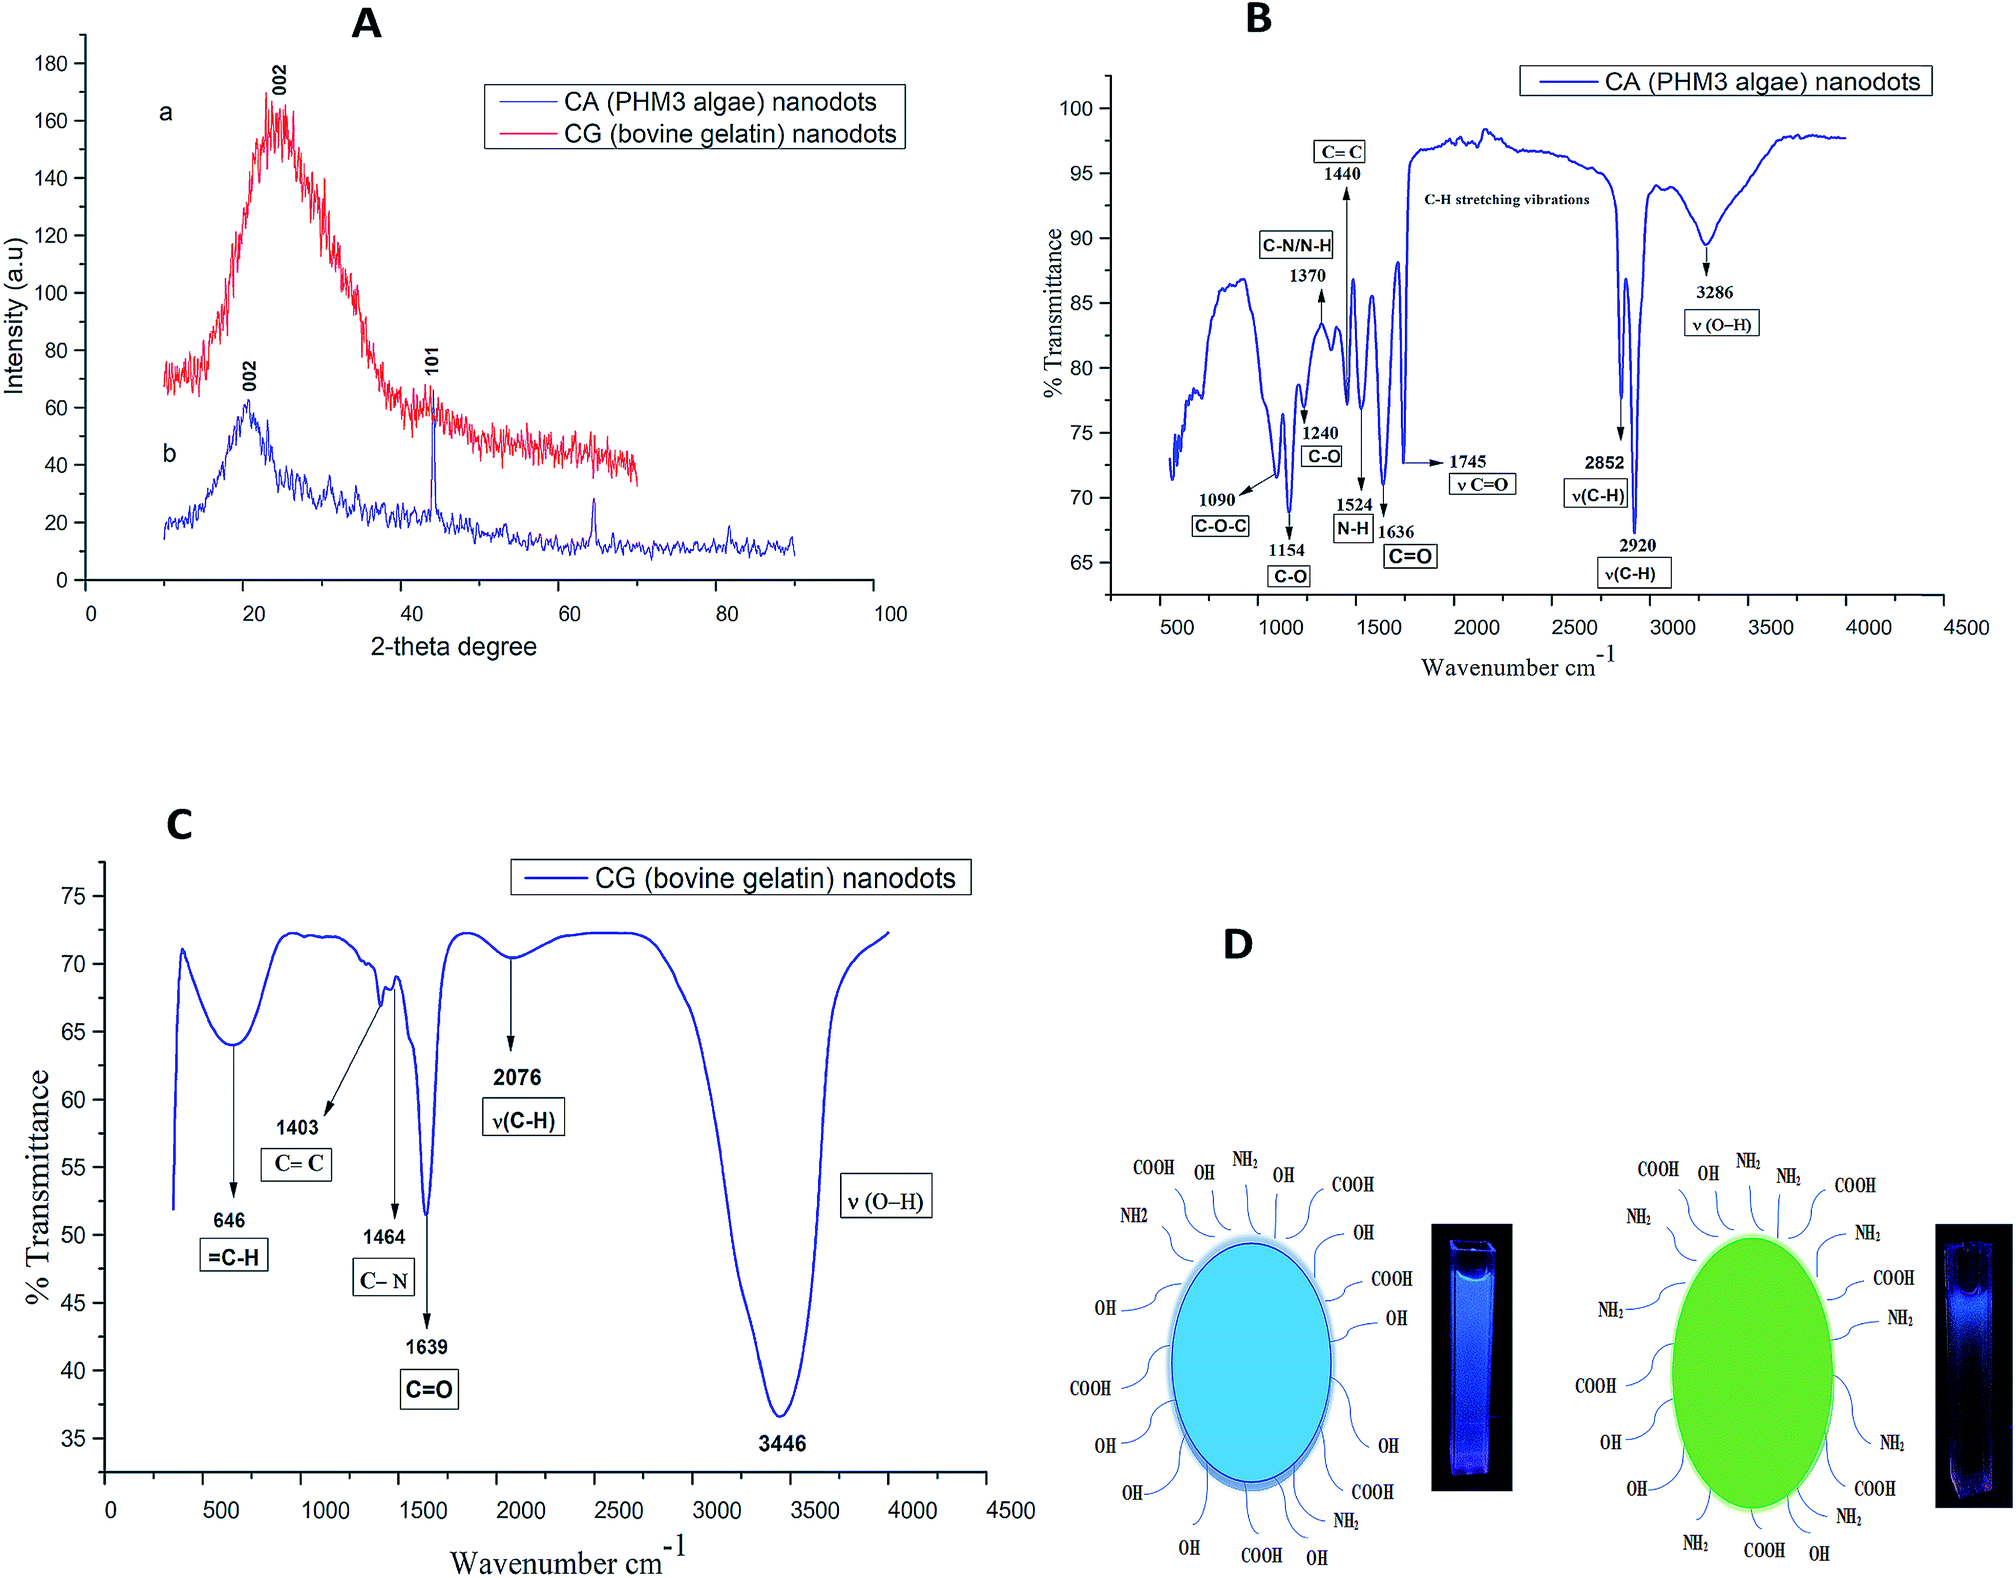
The scanning electron microscopy image of CG (bovine gelatin) and CA (PHM3 algae) nanodots at different magnifications respectively is shown in Fig. 3a–f and 5a–f. SEM analysis of CA (PHM3 algae) nanodots showed some agglomeration with the spherical morphology of particles. Similarly, SEM analysis of CG (bovine gelatin) nanodots showed a spherical morphology; however, particles are well separated from each other. In SEM analysis all the particles are in the nano-range with an average diameter of 67 nm for CA (PHM3 algae) nanodots and 59 nm in the case of CG (bovine gelatin) nanodots as shown in Fig. 4 and 6 (Tables 1 and 2) respectively. The size of the synthesized carbon nanodots (CG (bovine gelatin) and CA (PHM3 algae)) is in accordance with previously reported sizes;37 however, the size range of both carbon nanodots is greater than the Bohr exciton radius which suggests that the quantum confinement effect cannot be observed in CG (bovine gelatin) and CA (PHM3 algae) nanodots as the quantum confinement mechanism requires the size of nanodots to be smaller than the Bohr exciton radius.38 So it is reasonable to conclude that the photoluminescence of CG (bovine gelatin) and CA (PHM3 algae) nanodots can be related to surface defect states owing to the occurrence of different functional groups. The X-ray diffraction pattern (XRD) of CG (bovine gelatin) and CA (PHM3 algae) nanodots reveals that CG (bovine gelatin) nanodots (Fig. 7A(a)) show a very broad peak at 2θ = 24.0° which is allocated to the 002 diffraction patterns of graphitic carbon. Interlayer spacing determined from the 002 peak corresponds to d002 = 0.34 nm which is comparable to those of previously documented carbon nanodots.39,40 Similarly, the XRD pattern of CA (PHM3 algae) nanodots in Fig. 7A(b) depicts a broad peak positioned at 2θ = 22° assigned to the 002 diffraction patterns of graphitic carbon having an interlaying spacing distance of d002 = 0.36 nm, which is slightly higher than that of graphite (0.34 nm); the higher interlayer spacing indicates poor crystallization. Another sharp peak centered at 44° corresponds to the 101 planes originating due to the in-plane diffraction of graphene-like structures of CA (PHM3 algae) nanodots41 and a feeble peak observed at 64° can be due to the diffraction from sp3 like carbon. The X-ray diffraction (XRD) pattern reveals the presence of an amorphous carbon frame in CG (bovine gelatin) and CA (PHM3 algae). The amorphous structure can be due to the existence of abundant functional groups.
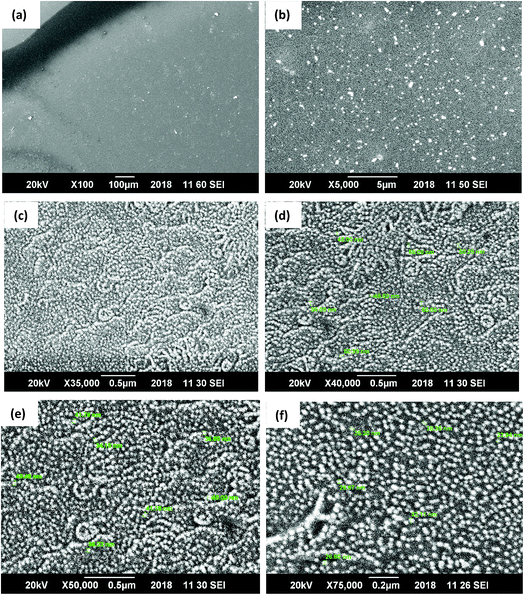 |
| | Fig. 3 (a–f) SEM images of CA (PHM3 algae) nanodots. | |
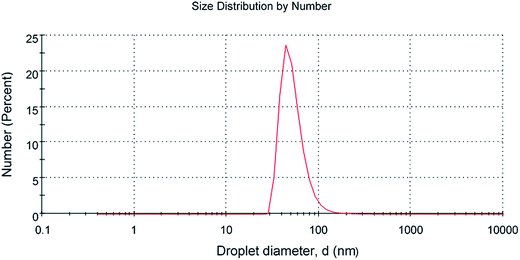 |
| | Fig. 4 Particle size distribution of CA (PHM3 algae) nanodots. | |
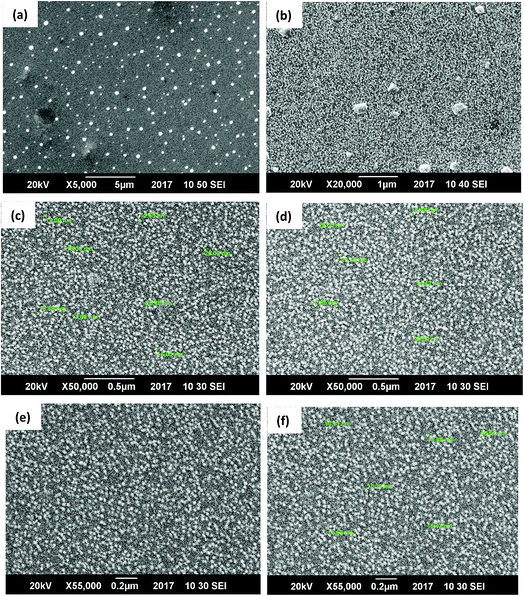 |
| | Fig. 5 (a–f) SEM image of CG (bovine gelatin) nanodots. | |
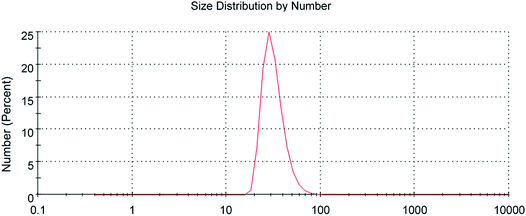 |
| | Fig. 6 Particle size distribution of CG (bovine gelatin) nanodots. | |
Table 1 Particle size analysis data of CA (PHM3 algae) nanodots
|
|
|
Size (d.nm) |
% intensity |
St. dev. (d.n.) |
|
|
Z-Average (d.nm): 67 nm |
Peak 1 |
100.1 |
93.0 |
45.56 |
|
| Peak 2 |
13.13 |
6.4 |
3.940 |
|
| Peak 3 |
4.452 |
0.6 |
0.7293 |
|
Table 2 Particle size analysis data of CG (bovine gelatin) nanodots
|
|
|
Size (d.nm) |
% intensity |
St. dev. (d.n.) |
|
Z-Average (d.nm): 59.45 nm |
Peak 1 |
64.36 |
84.8 |
28.68 |
| Peak 2 |
1205 |
13.6 |
789.7 |
| Peak 3 |
4513 |
1.6 |
735.1 |
 |
| | Fig. 7 (A) XRD analysis of CA (PHM3 algae) and CG (bovine gelatin) carbon nanodots, (B) FTIR spectra of CA (PHM3 algae) nanodots, (C) FTIR spectra of CG (bovine gelatin) nanodots, and (D) surface chemistry of CG (bovine gelatin) (left) and CA (PHM3 algae) (right) nanodots based on FTIR analysis. | |
3.3 Chemical composition of CG (bovine gelatin) and CA (PHM3 algae) nanodots
Surface chemistry and surface functional groups of CA (PHM3 algae) nanodots and CG (bovine gelatin) nanodots were analysed through FTIR analysis. In the case of CA (PHM3 algae) nanodots (Fig. 7B) the intensity of the peak at 3286 cm−1 is relatively low indicating that most of the O–H and N–H groups are consumed in the hydrothermal process; similar is the case with peaks at 2920 cm−1 and 2852 cm−1, the lower intensity of these peaks may be due to the decomposition of C–H bonds and the lower intensity of the peak corresponding to carbonyl groups ν(CO) confirms the decomposition of –COOH bonds during the hydrothermal process. The peak at 1636 cm−1 is associated with the stretching frequency of CO of aromatic carbonyl groups, the peak at 1440 cm−1 is associated with aromatic CC bonds,42 the peak at 1524 cm−1 is associated with the vibration and deformation band of N–H indicating the existence of amino-containing functional groups1 and the peak at 1370 cm−1 is associated with C–N and N–H groups which confirms the formation of amide bonds resulting from the dehydration reaction between carboxyl and amino groups.43 In CA (PHM3 algae) nanodots the bands corresponding to C–O are present and they are usually found in oxidized carbon,44 hence indicating good oxidation of CA (PHM3 algae) nanodots.
In the case of CG (bovine gelatin) nanodots, Fig. 7C, the absorption peak at 3446 cm−1 corresponds to ν(O–H) and ν(N–H) stretching vibrations; these functional groups improve the stability of carbon nanodots in aqueous media. An absorption stretch at a slightly low frequency is observed at 2076 cm−1 and is associated with C–H bonds. The peak at 1639 cm−1 is associated with aromatic carbonyl groups.42 Similarly, two prominent peaks observed in CG (bovine gelatin) nanodots at 1464 cm−1 and 1403 cm−1 are associated with amide III C–N bonds and CC bonds respectively. Overall FTIR results indicate that the CG (bovine gelatin) and CA (PHM3 algae) nanodots have amino, hydroxyl and carboxylic groups on the surface and these functional groups can be the main source of surface states of these carbon nanodots. Compared to CG (bovine gelatin) nanodots, an absorption peak at 3282 cm−1 with weakened intensity and an additional absorption peak at 1746 cm−1 corresponding to CO groups are present in CA (PHM3 algae) nanodots. These results indicate the enhanced surface oxidation of CA (PHM3 algae) nanodots since during the hydrothermal process lots of peroxyl radicals (HCOO˙) are formed which are very good oxidizing agents.45 Algal biomass contains a complex mixture of proteins, carbohydrates and lipids leading to the formation of a large amount of peroxyl radicals during the hydrothermal process hence causing an increase in surface oxidation. Moreover, the peaks in CA (PHM3 algae) nanodots for the absorption intensity of N–H and the C–N groups are stronger indicating that more amino groups are present in CA (PHM3 algae) nanodots as compared to CG (bovine gelatin) nanodots. Amino groups create a strong energy level due to their enhanced electron donating properties, but the lone pair of electrons in the nitrogen of amino functional groups reduces the energy gap between the HOMO and LUMO for surface domains of carbon nanodots;46 thus surface functionalization with these groups can cause a red shift in the PL spectrum of CA (PHM3 algae) nanodots. Hydroxyl groups are not reported to cause a decrease in the HOMO–LUMO gap; the possible reason might lie in the more electronegative character of oxygen atoms than nitrogen atoms and as a result, the electronic cloud activity of OH groups does not cause reduction in the HOMO–LUMO gap. Carboxylic groups have the least electron donating ability and consequently these groups create a small energy level.
Overall, FTIR results suggest an increased surface oxidation in CA (PHM3 algae) nanodots and an increased quantity of amino groups in CA (PHM3 algae) nanodots as compared to CG (bovine gelatin) nanodots; both factors can cause a decrease in the HOMO–LUMO gap47 which is consistent with the observed red shift in the PL spectra of CA (PHM3 algae) nanodots. Based on the FTIR results, Fig. 7D shows the surface composition of CG (bovine gelatin) (left) and CA (PHM3 algae) nanodots (right) along with the digital image under UV excitation showing how surface chemistry can have a remarkable impact on the PL properties.
3.4 Cell cytotoxicity
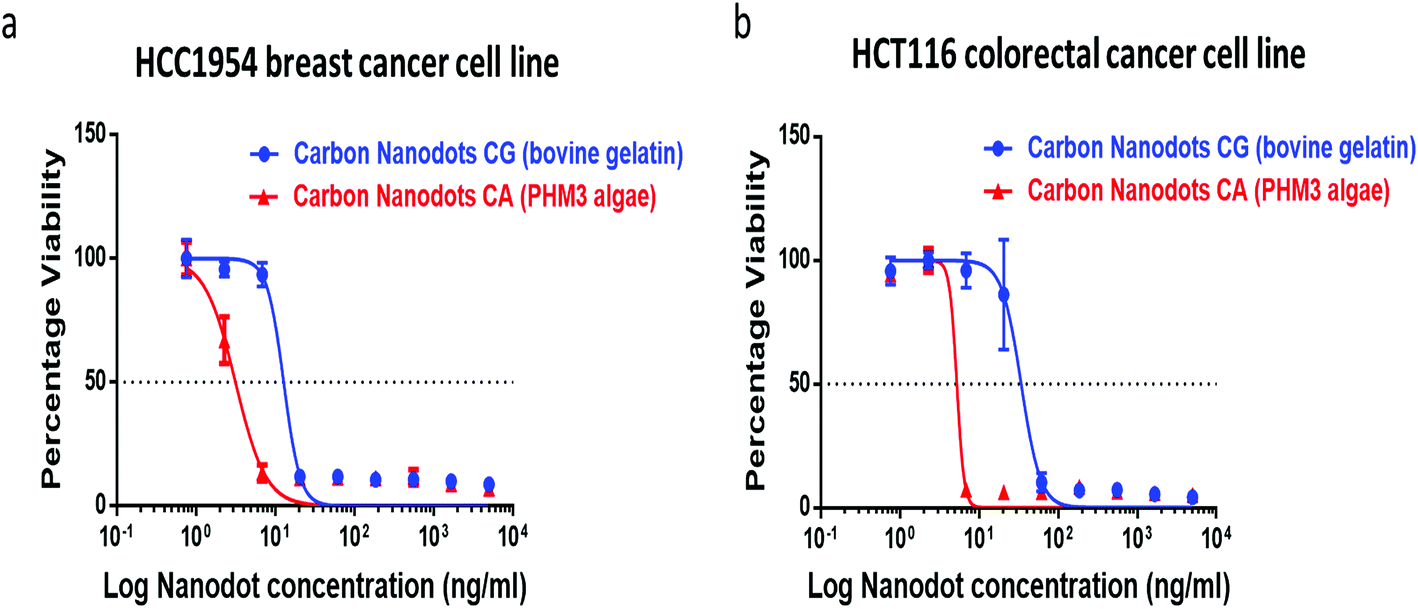
The synthesized carbon nanodots, CG (bovine gelatin) and CA (PHM3 algae) nanodots, were tested for their antiproliferative activities against HCC1954 (breast cancer) and HCT116 (colorectal cancer) cell lines in a 3 day SRB proliferation assay. Fig. 8a and b show the dose-dependent effect of CG (bovine gelatin) and CA (PHM3 algae) nanodots on the viability of breast cancer (HCC1954) and colorectal cancer (HCT116) cell lines. The GI50 values of CG (bovine gelatin) nanodots in HCT116 and HCC1954 cell lines were 23.860 ± 14.524 (n = 2) ng ml−1 and 8.156 ± 6.596 (n = 2) ng ml−1, respectively (Table 3). The GI50 values of CA (PHM3 algae) nanodots were considerably lower at 0.542 ± 0.715 (n = 2) ng ml−1 and 0.316 ± 0.447 (n = 2) ng ml−1 for HCT116 and HCC1954 cell lines, respectively (Table 3). The CA (PHM3 algae) nanodots, therefore, exhibit 44- and 26-fold potency compared to CG (bovine gelatin) nanoparticles in HCT116 and HCC1954 cell lines; however, when compared to the anticancer activity of some reported carbon dots, both CG (bovine gelatin) and CA (PHM3 algae) nanodots have excellent growth inhibition efficiencies, for example, the GI50 values of green tea derived carbon nanodots for MCF-7, MDA-MB-231, and HeLa cells were 1.75, 0.15, and 0.072 mg ml−1, respectively.48 Similarly, black pepper and ginger derived carbon dots reduced the viability of LN229 cells by 75% at 2 mg ml−1 and MCF-7 by 64% at 5 μg ml−1, respectively,49,50 whereas in the present study, both CG (bovine gelatin) and CA (PHM3 algae) nanodots completely inhibited the viability of both HCC 1954 and HCT 116 cell lines at ng ml−1 concentrations. In the case of CG (bovine gelatin) nanodots, no reference has been made in previously reported gelatin carbon dots1 regarding their anticancer activity. In fact, the biological properties of proteins are greatly influenced by their molecular weight, structural confirmation, processing conditions and more importantly, amino acid composition.51 The different nature of gelatin proteins and their source of extraction might be the reason for the observed anticancer behavior. Although the mechanism underlining the potent antiproliferative activities of CA (PHM3 algae) and CG (bovine gelatin) nanodots was not studied, in the case of carbon nanodots it has been reported that toxicity mainly depends upon the synthesis protocol as well as the starting material employed for synthesis.52 It has been demonstrated that hydrolysis of gelatin proteins produces certain bioactive hydrolysates with good anticancer and antioxidant properties;53 moreover, there is a list of biologically active compounds present in algae with reported antioxidant properties and the potential to cure cancer.54 In the present study, hydrothermal carbonization might have produced certain bioactive compounds which might be responsible for imparting anticancer activity to CG (bovine gelatin) and CA (PHM3 algae) nanodots. Furthermore, a link between the toxic effects of ginger and green tea derived carbon dots and increased ROS production have been reported.48,50,55 Similar mechanisms might be accountable for the antiproliferative effects of CA (PHM3 algae) and CG (bovine gelatin) nanodots.
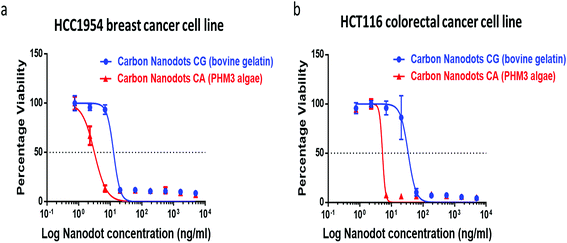 |
| | Fig. 8 (a) Anticancer activity of CA (PHM3 algae) (red) and CG (bovine gelatin) (blue) nanodots against HCC 1954 cell lines and (b) anticancer activity of CA (PHM3 algae) (red) and CG (bovine gelatin) (blue) nanodots against HCT 116 cell lines. | |
Table 3 GI50 values of CG (bovine gelatin) and CA (PHM3 algae) nanodots against HCT116 and HCC1954 cell lines
| Cell line |
Carbon nanodots |
GI50 (ng ml−1) |
| HCT116 |
CG (bovine gelatin) |
23.860 ± 14.52 (n = 2) |
| CA (PHM3 algae) |
0.542 ± 0.715 (n = 2) |
| HCC1954 |
CG (bovine gelatin) |
8.156 ± 6.596 (n = 2) |
| CA (PHM3 algae) |
0.316 ± 0.447 (n = 2) |
3.5 Highly fluorescent CG (bovine gelatin) nanodots for bioimaging
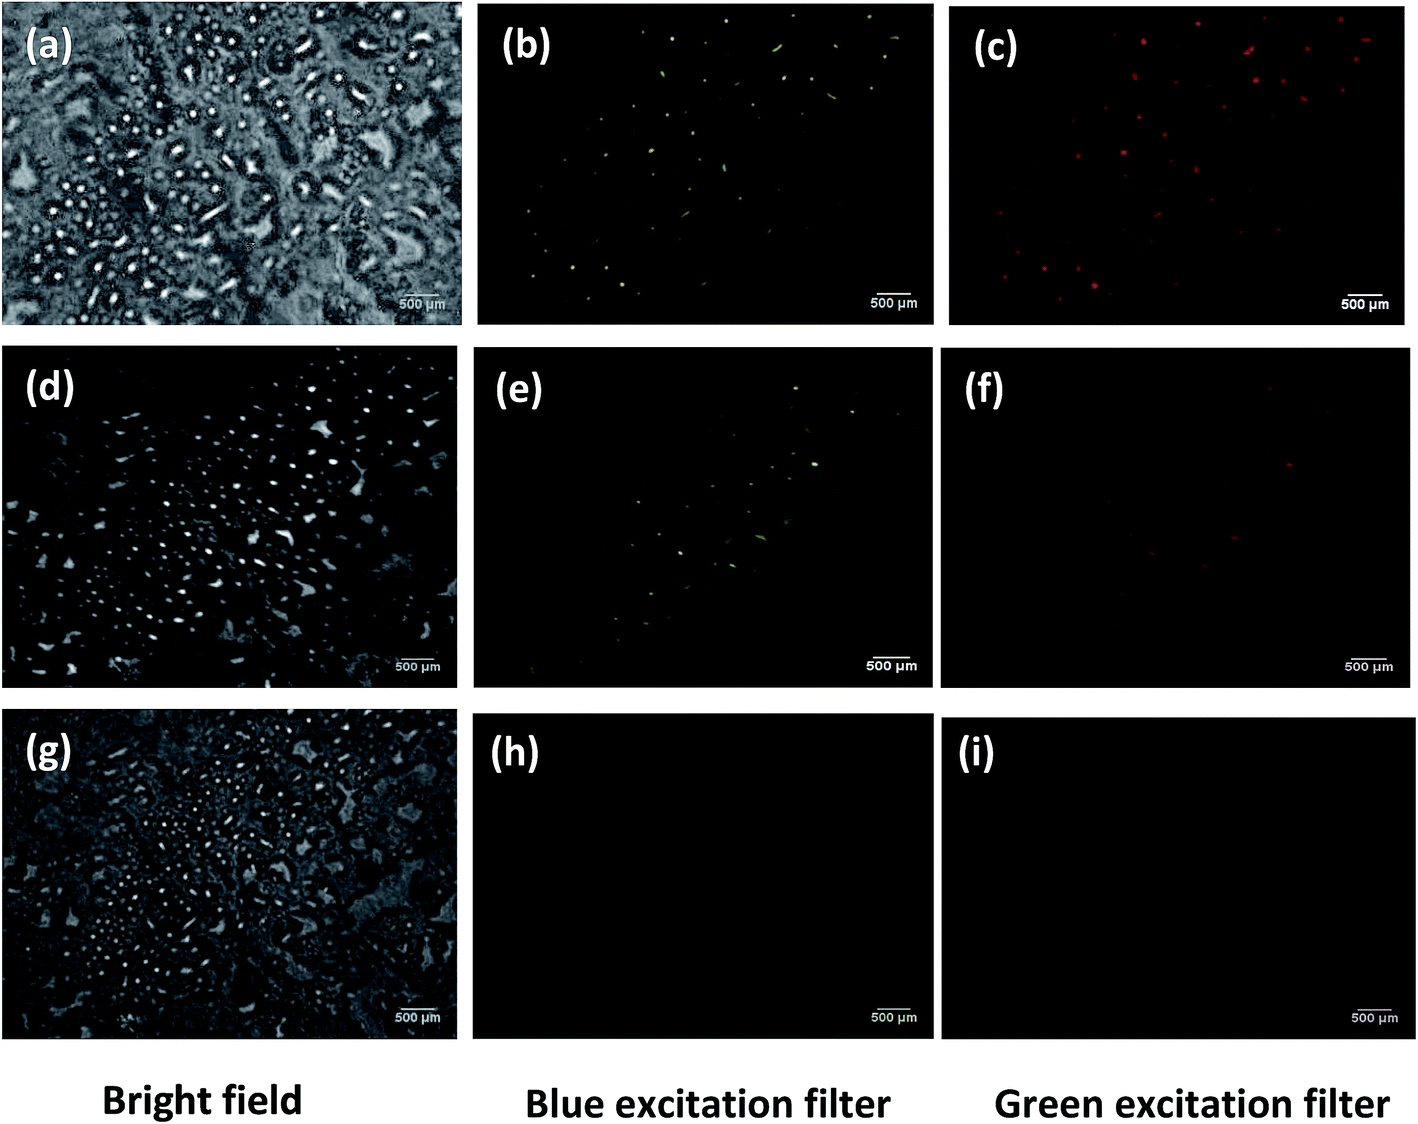
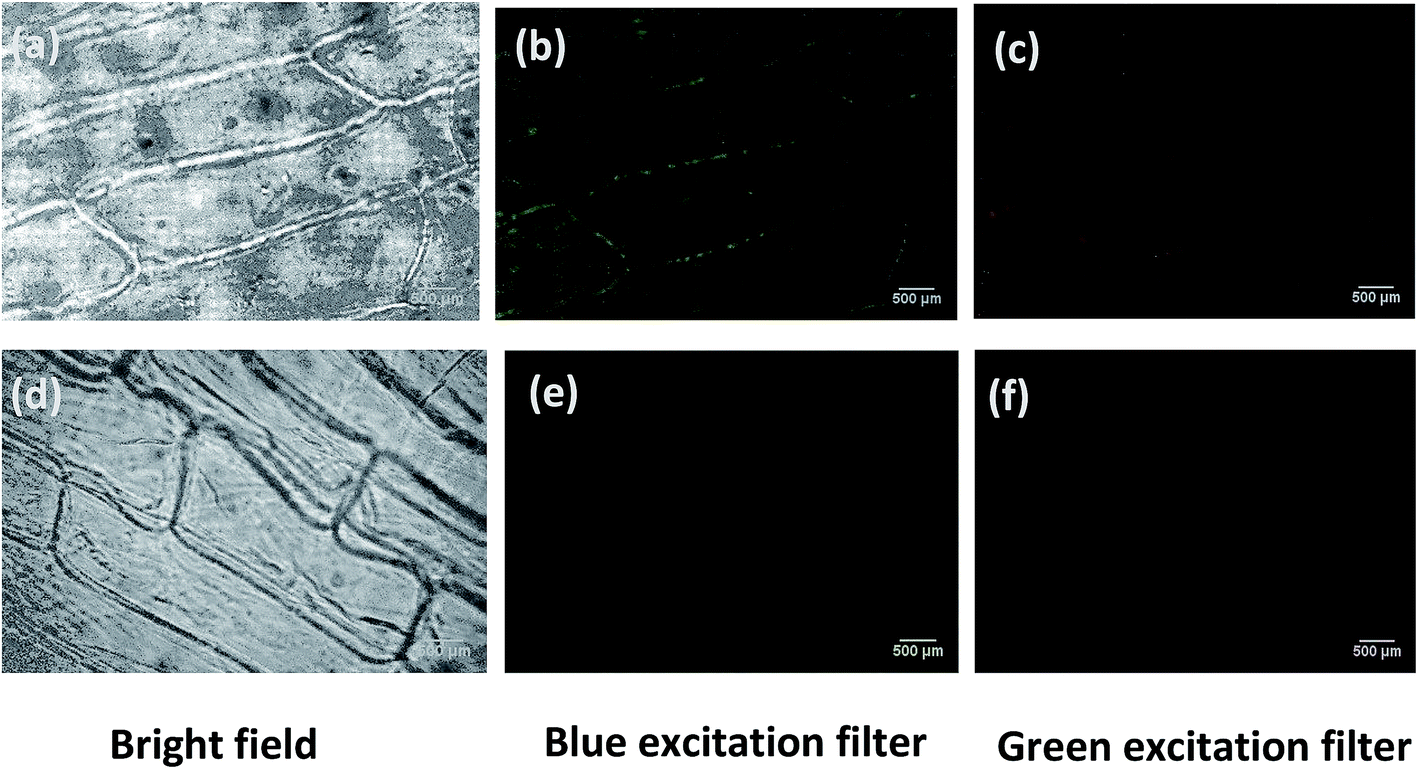
Since CG (bovine gelatin) nanodots show high PL intensity, these nanodots were used for imaging experiments of E. coli and onion epidermal cells. Fig. 9 shows the fluorescence images of bacteria (E. coli) using CG (bovine gelatin) nanodots at two different concentrations i.e. 2 mg ml−1 and 4 mg ml−1. The cell internalized carbon nanodots were imaged under bright field, and blue (λ = 450–480 nm) and green filters (λ = 510–550 nm). In bio-imaging experiments bacterial cells were completely immobilized on agarose pads, although agarose showed an irregular surface; however, agarose does not interfere with the fluorescence signal and allows a perfect, consistent, immobilized monolayer of cells with intermediate to high cell density. Bacterial cells showed yellow fluorescence under the blue excitation filter (λ = 450–480 nm) and red fluorescence under the green excitation filter (λ = 510–550 nm). The fluorescence images showed that bacterial cells have spherical and rod-shaped morphology. As is clear from the images, at a concentration of 2 mg ml−1 (Fig. 9b and c) a greater fluorescence intensity was observed compared to the fluorescence intensity at a concentration of 4 mg ml−1 (Fig. 9e and f); the reason for this could be the agglomeration of CG (gelatin) nanodots at an increased concentration due to which the cells were unable to efficiently uptake CG (bovine gelatin) nanodots. Fig. 9g–i show the control images, and no fluorescence signal is detected under the blue and green excitation filters which confirms that the fluorescence is due to CG (bovine gelatin) nanodots rather than the autofluorescence of bacterial cells. Fig. 10 shows the fluorescence images of onion epidermis. Fluorescence images were taken under bright field, blue filter (λ = 450–480 nm) and green filter (λ = 510–550 nm). The fluorescence is observed only in Fig. 10b and c which confirms that the fluorescence is due to CG (bovine gelatin) nanodots; moreover, fluorescence is mainly observed in the cell wall and in some regions of the cytoplasm of onion cells which indicates that CG (bovine gelatin) nanodots were mostly distributed in the cell wall region with some penetrating into the cytoplasm.
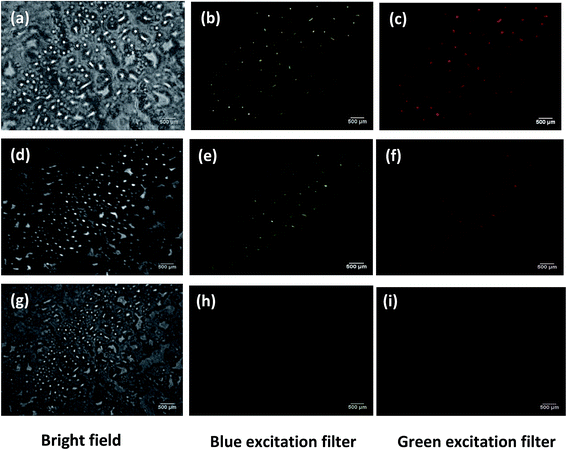 |
| | Fig. 9 (a–c) Fluorescence images at 2 mg ml−1 concentration under bright field, and blue and green excitation filters. (d–f) Fluorescence images at 4 mg ml−1 concentration under bright field, and blue and green excitation filters. (g–i) Control images of bacteria under bright field, and blue and green excitation filters obtained using a fluorescence microscope. | |
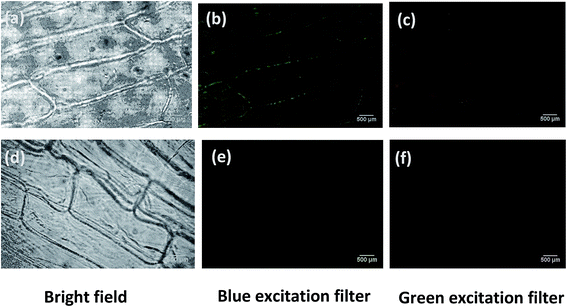 |
| | Fig. 10 (a–c) Fluorescence images of onion epidermis under bright field, and blue and green excitation filters obtained using a fluorescence microscope and (d–f) control images under bright field, and blue and green excitation filters. | |
4 Conclusion
In the present study, carbon nanodots were synthesized by hydrothermal carbonization of algal biomass of Pectinodesmus sp. and type B gelatin protein with bovine as a native source. CG (bovine gelatin) nanodots were further used for bioimaging applications in bacteria and onion cells owing to their high PL intensities and high photostability; moreover, both CA (PHM3 algae) and CG (bovine gelatin) nanodots demonstrated excellent anticancer activity with a very low GI50 value for both HCC 1954 and HCT 116 cancer cell lines. The anticancer activity of CA (PHM3 algae) nanodots was higher than that of CG (bovine gelatin) nanodots. Furthermore, chemical characterization and PL properties of CA (PHM3 algae) and CG (bovine gelatin) nanodots suggested that the PL emission can be from the surface defect states of functional groups. These surface states contain carboxyl groups, carbonyl groups, amide, hydroxyl group and other oxygenated defect states and the observed red shift in the PL spectrum of CA (PHM3 algae) nanodots can be related to amino groups and a high degree of surface oxidation, as both factors can decrease the HOMO–LUMO gap. Both CA (PHM3 algae) and CG (bovine gelatin) nanodots hold promise for bio-imaging, biomedical and optoelectronic applications.
Conflicts of interest
There are no conflicts to declare.
Acknowledgements
The authors are extremely obliged to ASAB-NUST for administrative and technical support, SCME-NUST for SEM, FTIR and XRD analysis, SNS-NUST for hydrothermal autoclaves, IESE-NUST for fluorescence microscopy, SBASSE-LUMS for SRB assay and National Institute of Lasers and Optronics/PIEAS for fluorescence spectroscopy analysis. The authors are also thankful to Ifrah Tahir, Sundus Jabeen Amina and Hasnain Qasim for their constant support and help.
References
- Q. Liang, W. Ma, Y. Shi, Z. Li and X. Yang, Easy synthesis of highly fluorescent carbon quantum dots from gelatin and their luminescent properties and applications, Carbon, 2013, 60, 421–428, DOI:10.1016/j.carbon.2013.04.055.
- I. Díez and R. H. A. Ras, Fluorescent silver nanoclusters, Nanoscale, 2011, 3(5), 1963, 10.1039/c1nr00006c.
- Y.-W. Lin, C.-C. Huang and H.-T. Chang, Gold nanoparticle probes for the detection of mercury, lead and copper ions, Analyst, 2011, 136(5), 863–871, 10.1039/c0an00652a.
- E. Hemmer, N. Venkatachalam and H. Hyodo,
et al., Upconverting and NIR emitting rare earth based nanostructures for NIR-bioimaging, Nanoscale, 2013, 5(23), 11339, 10.1039/c3nr02286b.
- J. Lippincott-Schwartz and G. H. Patterson, Development and Use of Fluorescent Protein Markers in Living Cells, Science, 2003, 300(5616), 87–91, DOI:10.1126/science.1082520.
- G. W. Chin and N. P. Cahill, The appearance of fluorescein-labelled lymphocytes in lymph following in vitro or in vivo labelling: the route of lymphocyte recirculation through mesenteric lymph nodes, Immunology, 1984, 52(2), 341–347 CAS
http://www.ncbi.nlm.nih.gov/pubmed/6429037, accessed November 22, 2017.
- O. Scholz, A. Thiel, W. Hillen and M. Niederweis, Quantitative analysis of gene expression with an improved green fluorescent protein. p6, Eur. J. Biochem., 2000, 267(6), 1565–1570 CrossRef CAS PubMed
http://www.ncbi.nlm.nih.gov/pubmed/10712585, accessed November 22, 2017.
- M. Bruchez, M. Moronne, P. Gin, S. Weiss and A. P. Alivisatos, Semiconductor Nanocrystals as Fluorescent Biological Labels, Science, 1998, 281(5385), 2013–2016, DOI:10.1126/science.281.5385.2013.
- C. Kirchner, T. Liedl and S. Kudera,
et al., Cytotoxicity of Colloidal CdSe and CdSe/ZnS Nanoparticles, Nano Lett., 2005, 5(2), 331–338, DOI:10.1021/nl047996m.
- X. Michalet, F. F. Pinaud and L. A. Bentolila,
et al., Quantum Dots for Live Cells, In Vivo Imaging, and Diagnostics, Science, 2005, 307(5709), 538–544, DOI:10.1126/science.1104274.
- A. P. Alivisatos, Semiconductor Clusters, Nanocrystals, and Quantum Dots, Science, 1996, 271(5251), 933–937, DOI:10.1126/science.271.5251.933.
- S. Y. Lim, W. Shen and Z. Gao, Carbon quantum dots and their applications, Chem. Soc. Rev., 2015, 44(1), 362–381, 10.1039/C4CS00269E.
- P. Miao, K. Han, Y. Tang, B. Wang, T. Lin and W. Cheng, Recent advances in carbon nanodots: synthesis, properties and biomedical applications, Nanoscale, 2015, 7(5), 1586–1595, 10.1039/c4nr05712k.
- F. Yuan, S. Li, Z. Fan, X. Meng, L. Fan and S. Yang, Shining carbon dots: synthesis and biomedical and optoelectronic applications, Nano Today, 2016, 11(5), 565–586, DOI:10.1016/j.nantod.2016.08.006.
- P. Tallury, A. Malhotra, L. M. Byrne and S. Santra, Nanobioimaging and sensing of infectious diseases, Adv. Drug Delivery Rev., 2010, 62(4–5), 424–437, DOI:10.1016/j.addr.2009.11.014.
- L. Zheng, F. Hong, S. Lu and C. Liu, Effect of Nano-TiO2 on Strength of Naturally Aged Seeds and Growth of Spinach, Biol. Trace Elem. Res., 2005, 104(1), 083–092, DOI:10.1385/bter:104:1:083.
- X. Dong, Y. Su and H. Geng,
et al., Fast one-step synthesis of N-doped carbon dots by pyrolyzing ethanolamine, J. Mater. Chem. C, 2014, 2(36), 7477–7481, 10.1039/c4tc01139b.
- X. Li, S. Zhang, S. A. Kulinich, Y. Liu and H. Zeng, Engineering surface states of carbon dots to achieve controllable
luminescence for solid-luminescent composites and sensitive Be2+ detection, Sci. Rep., 2015, 4(1), 4976, DOI:10.1038/srep04976.
- X. Wang, K. Qu, B. Xu, J. Ren and X. Qu, Microwave assisted one-step green synthesis of cell-permeable multicolor photoluminescent carbon dots without surface passivation reagents, J. Mater. Chem., 2011, 21(8), 2445, 10.1039/c0jm02963g.
- Y.-P. Sun, B. Zhou and Y. Lin,
et al., Quantum-Sized Carbon Dots for Bright and Colorful Photoluminescence, J. Am. Chem. Soc., 2006, 128(24), 7756–7757, DOI:10.1021/ja062677d.
- S. Y. Lim, W. Shen and Z. Gao, Carbon quantum dots and their applications, Chem. Soc. Rev., 2015, 44(1), 362–381, 10.1039/c4cs00269e.
- C. Zhu, J. Zhai and S. Dong, Bifunctional fluorescent carbon nanodots: green synthesis via soy milk and application as metal-free electrocatalysts for oxygen reduction, Chem. Commun., 2012, 48(75), 9367, 10.1039/c2cc33844k.
- L. Wang and H. S. Zhou, Green Synthesis of Luminescent Nitrogen-Doped Carbon Dots from Milk and Its Imaging Application, Anal. Chem., 2014, 86, 8902–8905 CrossRef CAS PubMed.
- B. S. B. Kasibabu, S. L. D'souza and S. Jha,
et al., One-step synthesis of fluorescent carbon dots for imaging bacterial and fungal cells, Anal. Methods, 2015, 7(6), 2373–2378, 10.1039/c4ay02737j.
- P. Das, M. Bose, S. Ganguly, S. Mondal, A. K. Das, S. Banerjee and N. C. Das, Green approach to photoluminescent carbon dots for imaging of gram-negative bacteria Escherichia coli, Nanotechnology, 2017, 28(19), 195501, DOI:10.1088/1361-6528/aa6714.
- M. O. Dekaliuk, O. Viagin, Y. V. Malyukin and A. P. Demchenko, Fluorescent carbon nanomaterials: “quantum dots” or nanoclusters?, Phys. Chem. Chem. Phys., 2014, 16(16), 16075–16084, 10.1039/c4cp00138a.
- R. Mohd Hafidz, Chemical and functional properties of bovine and porcine skin gelatin, Int. Food Res. J., 2011, 18, 813–817 Search PubMed
https://pdfs.semanticscholar.org/2d56/a099d38741e9a4053b8f97296d37dca61482.pdf, accessed December 14, 2017.
- S. Choonpicharn, S. Jaturasitha, N. Rakariyatham, N. Suree and H. Niamsup, Antioxidant and antihypertensive activity of gelatin hydrolysate from Nile tilapia skin, J. Food Sci. Technol., 2015, 52(5), 3134–3139, DOI:10.1007/s13197-014-1581-6.
- H. H. A. El Baky and G. S. El-Baroty, Healthy Benefit of Microalgal Bioactive Substances, Journal of Aquatic Science, 2013, 1(1), 11–22, DOI:10.12691/jas-1-1-3.
- M. Khalid, N. Khalid, I. Ahmed, R. Hanif, M. Ismail and H. A. Janjua, Comparative studies of three novel freshwater microalgae strains for synthesis of silver nanoparticles: insights of characterization, antibacterial, cytotoxicity and antiviral activities, J. Appl. Phycol., 2017, 29(4), 1851–1863, DOI:10.1007/s10811-017-1071-0.
- S. O. Skinner, L. A. Sepúlveda, H. Xu and I. Golding, Measuring mRNA copy number in individual Escherichia coli cells using single-molecule fluorescent in situ hybridization, Nat. Protoc., 2013, 8(6), 1100–1113, DOI:10.1038/nprot.2013.066.
- P. Dubey, K. M. Tripathi, R. Mishra, A. Bhati, A. Singh and S. K. Sonkar, A simple one-step hydrothermal route towards water solubilization of carbon quantum dots from soya-nuggets for imaging applications, RSC Adv., 2015, 5(106), 87528–87534, 10.1039/c5ra14536h.
- P. Song, L. Zhang and H. Long,
et al., A multianalyte fluorescent carbon dots sensing system constructed based on specific recognition, RSC Adv., 2017, 7(1), 28637–28646, 10.1039/c7ra04122e.
- S. Saxena, T. A. Tyson, S. Shukla, E. Negusse, H. Chen and J. Bai, Investigation of structural and electronic properties of graphene oxide, Appl. Phys. Lett., 2011, 99(1), 3–6, DOI:10.1063/1.3607305.
- W. Kwon, S. Do, J.-H. Kim, M. Seok Jeong and S.-W. Rhee, Control of Photoluminescence of Carbon Nanodots via Surface Functionalization using Para-substituted Anilines, Sci. Rep., 2015, 5(1), 12604, DOI:10.1038/srep12604.
- B. De and N. Karak, A green and facile approach for the synthesis of water soluble fluorescent carbon dots from banana juice, RSC Adv., 2013, 3(22), 8286, 10.1039/c3ra00088e.
- K. M. Tripathi, A. Bhati and A. Singh,
et al., From the traditional way of pyrolysis to tunable photoluminescent water soluble carbon nano-onions for cell imaging and selective sensing of glucose, RSC Adv., 2016, 6(44), 37319–37329, 10.1039/c6ra04030f.
- J. C. G. Esteves da Silva and H. M. R. Gonçalves, Analytical and bioanalytical applications of carbon dots, TrAC, Trends Anal. Chem., 2011, 30(8), 1327–1336, DOI:10.1016/j.trac.2011.04.009.
- S. Mohapatra, S. Sahu, N. Sinha and S. K. Bhutia, Synthesis of a carbon-dot-based photoluminescent probe for selective and ultrasensitive detection of Hg2+ in water and living cells, Analyst, 2015, 140(4), 1221–1228, 10.1039/c4an01386g.
- S. Zhu, Q. Meng and L. Wang,
et al., Highly Photoluminescent Carbon Dots for Multicolor Patterning, Sensors, and Bioimaging, Angew. Chem., Int. Ed., 2013, 52(14), 3953–3957, DOI:10.1002/anie.201300519.
- S. S. Jones, P. Sahatiya and S. Badhulika, One step, high yield synthesis of amphiphilic carbon quantum dots derived from chia seeds: a solvatochromic study, New J. Chem., 2017, 41(21), 13130–13139, 10.1039/c7nj03513f.
- R. R. Gaddam, D. Vasudevan, R. Narayan and K. V. S. N. Raju, Controllable synthesis of biosourced blue-green fluorescent carbon dots from camphor for the detection of heavy metal ions in water, RSC Adv., 2014, 4(100), 57137–57143, 10.1039/c4ra10471d.
- C. Zhang, Y. Xiao and Y. Ma,
et al., Algae biomass as a precursor for synthesis of nitrogen-and sulfur-co-doped carbon dots: a better probe in Arabidopsis guard cells and root tissues, J. Photochem. Photobiol., B, 2017, 174, 315–322, DOI:10.1016/j.jphotobiol.2017.06.024.
- S. Lu, S. Guo and P. Xu,
et al., Hydrothermal synthesis of nitrogen-doped carbon dots with real-time live-cell imaging and blood–brain barrier penetration capabilities, Int. J. Nanomed., 2016, 11, 6325–6336, DOI:10.2147/ijn.s119252.
- Z. Zhang, Y. Pan, Y. Fang, L. Zhang, J. Chen and C. Yi, Tuning photoluminescence and surface properties of carbon nanodots for chemical sensing, Nanoscale, 2016, 8(1), 500–507, 10.1039/c5nr06534h.
- T.-T. Zhang, J.-F. Jia and H.-S. Wu, Substituent and Solvent Effects on Electronic Structure and Spectral Property of ReCl(CO)3(N∧N) (N∧N = Glyoxime): DFT and TDDFT Theoretical Studies, J. Phys. Chem. A, 2010, 114(46), 12251–12257, DOI:10.1021/jp104458u.
- S. H. Jin, D. H. Kim, G. H. Jun, S. H. Hong and S. Jeon, Tuning the Photoluminescence of Graphene Quantum Dots through the Charge Transfer Effect of Functional Groups, ACS Nano, 2013, 7(2), 1239–1245, DOI:10.1021/nn304675g.
- P.-C. Hsu, P.-C. Chen, C.-M. Ou, H.-Y. Chang and H.-T. Chang, Extremely high inhibition activity of photoluminescent carbon nanodots toward cancer cells, J. Mater. Chem. B, 2013, 1(13), 1774, 10.1039/c3tb00545c.
- N. Vasimalai, V. Vilas-Boas and J. Gallo,
et al., Green synthesis of fluorescent carbon dots from spices for in vitro imaging and tumour cell growth inhibition, Beilstein J. Nanotechnol., 2018, 9(1), 530–544, DOI:10.3762/bjnano.9.51.
- V. J. Sawant and S. R. Bamane, Antioxidant, Catalytic Reducing and Anticancer Properties from Hydrothermally Green Synthesized Ginger Derived Carbon Nanodots, Asian Journal of Organic & Medicinal Chemistry, 2016, 1(4), 112–117, DOI:10.14233/ajomc.2016.AJOMC-P34.
-
J. E. Kinsella, Protein Structure and Functional Properties: Emulsification and Flavor Binding Effects, 1982, pp. 301–326, DOI:10.1021/bk-1982-0206.ch012.
- P. Pierrat, R. Wang and D. Kereselidze,
et al., Efficient in vitro and in vivo pulmonary delivery of nucleic acid by carbon dot-based nanocarriers, Biomaterials, 2015, 51, 290–302, DOI:10.1016/j.biomaterials.2015.02.017.
- A. Alemán, E. Pérez-Santín, S. Bordenave-Juchereau, I. Arnaudin, M. C. Gómez-Guillén and P. Montero, Squid gelatin hydrolysates with antihypertensive, anticancer and antioxidant activity, Food Res. Int., 2011, 44(4), 1044–1051, DOI:10.1016/j.foodres.2011.03.010.
- H. Admassu, W. Zhao, R. Yang, M. A. A. Gasmalla and E. Alsir, Development of Functional Foods: Sea Weeds (Algae) Untouched Potential and Alternative Resource – A Review, International Journal of Scientific & Technology Research, 2015, 4(9), 108–115 Search PubMed . Retrieved from http://www.ijstr.org.
- C.-L. Li, C.-M. Ou and C.-C. Huang,
et al., Carbon dots prepared from ginger exhibiting efficient inhibition of human hepatocellular carcinoma cells, J. Mater. Chem. B, 2014, 2(28), 4564, 10.1039/c4tb00216d.
Footnote |
| † Electronic supplementary information (ESI) available. See DOI: 10.1039/c9na00164f |
|
| This journal is © The Royal Society of Chemistry 2019 |
Click here to see how this site uses Cookies. View our privacy policy here. 
 Open Access Article
 This Open Access Article is licensed under a Creative Commons Attribution-Non Commercial 3.0 Unported Licence
 d,
Syed Zajif
Hussain
d,
Syed Zajif
Hussain