 Open Access Article
Carbon dots, a powerful non-toxic support for bioimaging by fluorescence nanoscopy and eradication of bacteria by photothermia†
H.
Belkahla‡
a,
R.
Boudjemaa‡
b,
V.
Caorsi
b,
D.
Pineau
a,
A.
Curcio
c,
J. S.
Lomas
 a,
P.
Decorse
a,
A.
Chevillot-Biraud
a,
T.
Azaïs
d,
C.
Wilhelm
c,
H.
Randriamahazaka
*a and
M.
Hémadi
a,
P.
Decorse
a,
A.
Chevillot-Biraud
a,
T.
Azaïs
d,
C.
Wilhelm
c,
H.
Randriamahazaka
*a and
M.
Hémadi
 *a
*a
aInterfaces, Traitements, Organisation et Dynamique des Systèmes, Université Paris Diderot, Sorbonne Paris Cité, CNRS-UMR 7086, 15 rue Jean-Antoine de Baïf, 75205 Paris Cedex 13, France. E-mail: hemadi@univ-paris-diderot.fr; hyacinthe.randria@univ-paris-diderot.fr
bAbbelight, 6 rue Jean Calvin, 75005 Paris, France
cLaboratoire Matières et Systèmes Complexes, Université Paris Diderot, Sorbonne Paris Cité, CNRS-UMR 7057, 10 rue Alice Domon et Léonie Duquet, 75205 Paris Cedex 13, France
dLaboratoire de Chimie de la Matière Condensée de Paris, Sorbonne Université, CNRS-UMR 7574, Collège de France, 4 place Jussieu, 75005 Paris, France
First published on 17th May 2019
Abstract
Carbon Dots (CDs) are innovative materials which have potential applications in many fields, including nanomedicine, energy and catalysis. Here CDs were produced by the alkali-assisted ultrasonic route and characterized by several techniques to determine their composition and properties. Fluorescence nanoscopy using single-molecule localization microscopy shows that they have very good photophysical properties and a remarkable blinking behaviour at 405 nm. Moreover, these CDs are a safe material, non-toxic towards different cell lines (cancer and non-cancer cells) even at very high concentration, reflecting an excellent biocompatibility. Photothermia, i.e. their heating capacity under laser irradiation, was evaluated at two wavelengths and at several power densities. The resulting temperature increment was high (5 < ΔT < 45 °C) and appropriate for biomedical applications. Bioimaging and photothermia were then performed on E. coli, a Gram(−) bacterium, incubated with CDs. Remarkably, by photothermia at 680 nm (0.3, 1 and 1.9 W cm−2) or 808 nm (1.9 W cm−2), CDs are able to eradicate bacteria in their exponential and stationary phases. Images obtained by 3D super-resolution microscopy clearly show the different CD distributions in surviving bacteria after mild photothermal treatment. These results confirm that CDs are multifunctional materials with a wide range of biomedical applications.
1. Introduction
Carbon nanomaterials have many interesting applications in the field of nanomedicine. They are becoming essential materials due to their diverse forms with different physical, chemical, optical, electrochemical and electrical properties.1 Recently, a new class of carbon nanoparticles, less than 10 nm in diameter, appeared accidently during the purification of carbon nanotubes.2 These are now described as “Carbon Dots” (CDs) and have attracted considerable attention because of their excellent dispersibility,3 high chemical stability and photostability,4 excellent biocompatibility,5 low toxicity6 and low cost of fabrication.7 There are, therefore, myriad possibilities for these nanoparticles in different domains of application, such as chemical sensing,8 photocatalysis,9,10 electrocatalysis,11 bioimaging,12,13 drug delivery,14,15 photodynamic therapy,16,17 biosensors,18,19etc.Moreover, there are several ways of synthesizing them. The two main approaches are classified as “top-down” and “bottom-up”. The first one is based on physical or chemical techniques (laser ablation,20 chemical oxidation,21 confined combustion,22etc.) which break down larger graphitic materials into smaller particles. The “bottom-up” approach has received considerable attention and is now the most popular way of producing CDs. The molecular precursors (carbohydrates, urea, citrate, etc.) play a central role in the formation of CDs through chemical synthesis or carbonization. Depending of the nature of the precursors, several methods can be used: chemical or hydrothermal oxidation,23 microwave pyrolysis24 or ultrasonic treatment.4,25–27
The bottom-up approach was used in this work to produce CDs from a low-cost precursor (glucose) by alkali-assisted ultrasonic irradiation according to a known procedure.4,28,29 By a facile one-step sonochemical route ultrafine, stable fluorescent CDs with a homogeneous size distribution in the nano-range were obtained.4 The ultrasonic cavitation process in liquids induces the formation of gas bubbles that grow and collapse, thus producing local 5500 °C hot spots and pressures of several thousand atmospheres.30 These locally harsh conditions are responsible for the formation of CDs.
A cutting-edge technique, Single-Molecule Localization Microscopy (SMLM)31 was here implemented to validate the feasibility of using CDs as a multitasking tool for both calibration and bioimaging. SMLM techniques require the stochastic photoswitching and the detection of single spatially and temporally separated fluorophores. To achieve this, most of the fluorophores are forced into a long-lasting non-fluorescent state, named “dark state”, allowing only a subpopulation to emit fluorescence at a given time.32 SMLM approaches strongly depend on the photophysical properties of the fluorophores and their environment. To date, such photoswitching properties mainly concern organic fluorophores (such as rhodamines, cyanines and oxazines), fluorescent proteins (PA-GFP, mEos2, etc.) and reversibly-binding probes (Nile Red).
Recently, CDs have been reported as photoswitchable fluorescent probes,33 making them applicable for nanoscopy and more especially for SMLM. Nevertheless, their use in the field of nanoscopy is relatively new and the photoswitching mechanism is still not yet properly understood.33 Further research and development on the use of CDs as probes for nanoscopy is required. Here we demonstrate that CDs can be exploited in SMLM for both calibrating the system properties (e.g. the localization precision) and for nanostructural analysis by bioimaging.
Photothermal therapy (PTT) is based on the use of near-infrared (NIR) light-absorbing agents that convert laser energy into heat, causing irreversible cellular damage and destruction of malignant cells or bacteria. Recently, CDs were used as an agent for photothermia34–36 to destroy cancer cells. Geng et al.37 reported high photothermal conversion efficiency for nitrogen and oxygen co-doped CDs under 808 nm laser irradiation. Bao et al.38 developed sulfur and nitrogen co-doped CDs with high conversion efficiency in mouse models under 655 nm laser irradiation. A very limited number of studies39 have explored the photothermal properties of CDs to eradicate bacteria: the bactericidal effect of CDs on Staphylococcus aureus is enhanced by 808 nm laser irradiation.
The aim of the present study is to explore possible applications of CDs in nanomedicine. The CDs were first characterized by a large panel of techniques: dynamic light scattering (DLS), Fourier transform infrared spectroscopy (FTIR), transmission electron microscopy (TEM), UV-visible-NIR spectroscopy, MAS NMR spectroscopy and X-ray photoelectron spectroscopy (XPS) to define their composition. Fluorescence emission spectrophotometry was performed to evaluate their photoluminescence properties.
Escherichia coli (E. coli) was chosen as a model for the two nanomedicine applications: nanoscopy and photothermia. Nanoscopy was used for the bioimaging of E. coli incubated with CDs and to demonstrate their spontaneous blinking. Their photothermal properties, namely their heating ability and the effect of the temperature increment on the viability of E. coli in vitro in two growth phases (exponential and stationary) were finally investigated.
2. Results and discussion
2.1 Synthesis and spectrophotometric study
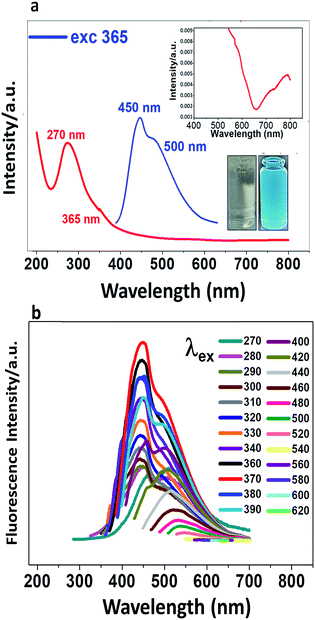
CDs were prepared from glucose as precursor in alkali medium under ultrasonic treatment. The conditions were different from the reported protocol4 in that the power was increased; a dark brown suspension was obtained (Fig. SI-1†). The absorption spectrum (Fig. 1a) shows a shoulder at 360 nm, a band at 270 nm and non-negligible absorption in the visible and NIR (400–800 nm). The absorption peak at 270 nm is due mainly to the π→π* and n →π* transitions of C![[double bond, length as m-dash]](https://www.rsc.org/images/entities/char_e001.gif) C and C
C and C![[double bond, length as m-dash]](https://www.rsc.org/images/entities/char_e001.gif) O bonds, respectively. When a very dilute suspension of CDs (colourless) is irradiated with an UV lamp, the suspension is cyan-coloured (Fig. 1a). When the suspension is excited at 365 nm, two fluorescence emission peaks are observed at 450 and 500 nm. In Fig. 1b are recorded different photoluminescence (PL) spectra obtained upon excitation at progressively higher wavelengths from 270 nm to 620 nm. The brightness and the emission maximum vary with the excitation wavelength, the maximum shifting from shorter to longer wavelength as the excitation wavelength is increased.
O bonds, respectively. When a very dilute suspension of CDs (colourless) is irradiated with an UV lamp, the suspension is cyan-coloured (Fig. 1a). When the suspension is excited at 365 nm, two fluorescence emission peaks are observed at 450 and 500 nm. In Fig. 1b are recorded different photoluminescence (PL) spectra obtained upon excitation at progressively higher wavelengths from 270 nm to 620 nm. The brightness and the emission maximum vary with the excitation wavelength, the maximum shifting from shorter to longer wavelength as the excitation wavelength is increased.
To achieve the best fluorescence response of the CDs, their concentration and pH were optimized. Emission spectra were recorded at different pHs from 2 to 11. Fig. SI-2† shows that the maximum brightness is achieved at pH 8. At low pH, CDs are weakly charged and probably aggregated. Raising the pH increases the negative charge and reduces the aggregation, leading to an enhancement of the fluorescence intensity which maximises at pH 8, selected as the working pH for the rest of the study.
2.2 Structure and characterization
The morphology and the size of CDs were examined by transmission electron microscopy (TEM). Fig. 2 shows that the CDs are spherical and well dispersed. The histogram analysis of the TEM images gives an average diameter of approximately 2.5 nm (Fig. 2a and b). The average hydrodynamic size and distribution of the CDs were also evaluated by DLS (Fig. 2d), showing a narrow size range from 1 nm to 3 nm, which is consistent with the TEM results. These studies concur in that the CDs are roughly monodispersed spherical particles with a diameter between 2 and 3 nm. Their zeta potential in aqueous media at pH 8 is negative (ξ = (−20 ± 1) mV, Fig. 2c), due to the presence of hydroxyl, carbonyl and carboxyl groups on the surface.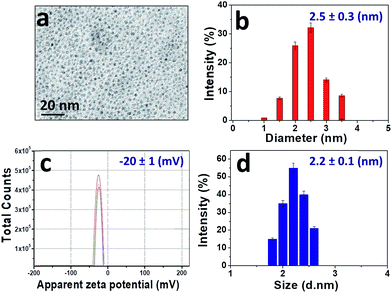 | ||
| Fig. 2 (a) TEM image; (b) size histogram; (c) zeta potential at pH 8. Each line represents individual measurements of the same sample, which were used to obtain an average value; (d) DLS profile. | ||
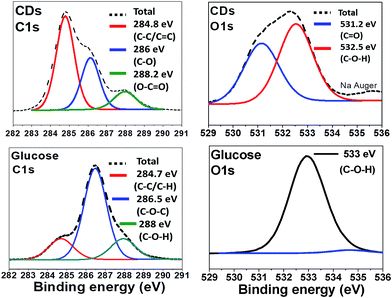
The surface groups and the composition of CDs were identified by X-ray Photoelectron Spectroscopy (XPS) and compared to the spectra of glucose (Fig. 3). Relative elemental analysis for CDs shows: C: 63.2%; N: 0.13%; Na: 6.7% and O: 30.0%, hydrogen not being XPS-detectable. The measured C 1s XPS spectrum is deconvoluted into 3 peaks centred at 284.8 eV (non-oxygenated sp3 C and sp2 C, i.e. C–C and C![[double bond, length as m-dash]](https://www.rsc.org/images/entities/char_e001.gif) C), 286 eV (C–O), and 288 eV (C–C
C), 286 eV (C–O), and 288 eV (C–C![[double bond, length as m-dash]](https://www.rsc.org/images/entities/char_e001.gif) O). The O 1s spectrum is dominated by two peaks at 531 and 532.5 eV due to C
O). The O 1s spectrum is dominated by two peaks at 531 and 532.5 eV due to C![[double bond, length as m-dash]](https://www.rsc.org/images/entities/char_e001.gif) O and C–O–H, respectively whereas for glucose only one peak, corresponding to C–O–H, appears at 533 eV.
O and C–O–H, respectively whereas for glucose only one peak, corresponding to C–O–H, appears at 533 eV.
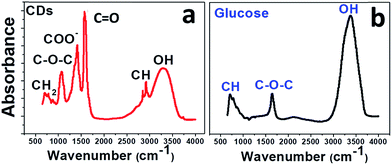
To confirm this result, the CDs were examined by infrared spectroscopy (FTIR). In Fig. 4, the FTIR spectrum of CDs (Fig. 4a) is compared to that of glucose (Fig. 4b). The glucose spectrum (Fig. 4b) shows three main bands: a strong band at 3324 cm−1 for the hydroxyl groups and two smaller ones at 1645 and 750 cm−1 for C–O and C–H stretching, respectively.
The IR spectrum of the CDs (Fig. 4a) suggests the presence of abundant oxygen-containing functional groups formed during the carbonization process: broad band for hydroxyl O–H at 3331 cm−1; COO− stretching vibrations at 1415 cm−1; asymmetric and symmetric stretching of C–O–C in carboxylate groups at about 1350 cm−1 and 1080 cm−1; C–H stretching vibrations of sp3 carbon at 2920 and 2850 cm−1; C![[double bond, length as m-dash]](https://www.rsc.org/images/entities/char_e001.gif) O stretching at around 1600 cm−1.
O stretching at around 1600 cm−1.
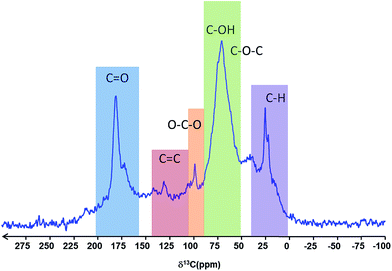
The solid-state 13C MAS NMR spectrum of the particles was assigned according to Cai et al.40 and Baccile et al.,41 and is in full agreement with the IR spectra, showing well defined bands for C–H, C–O–C, C–OH, O–C–O and C![[double bond, length as m-dash]](https://www.rsc.org/images/entities/char_e001.gif) O type carbons, with only a weak resonance for C
O type carbons, with only a weak resonance for C![[double bond, length as m-dash]](https://www.rsc.org/images/entities/char_e001.gif) C carbon (Fig. 5). The resonances are consistent with the presence of carboxylate groups, ether and alcohol functions as well as aliphatic carbons.
C carbon (Fig. 5). The resonances are consistent with the presence of carboxylate groups, ether and alcohol functions as well as aliphatic carbons.
From the elemental analysis, the XPS, FTIR and NMR spectra, we infer the existence of oxygen-rich functional groups, such as carboxyl and hydroxyl, consistent with the high hydrophilicity and stability in aqueous media of the CDs.
Oxygen-containing functional groups are located at the surface of the CDs, and the corresponding surface states may induce intra-gap states between the π band (valence band) and the π* band (conduction band). The excitation wavelength-dependent photoluminescence (see above) is attributed to the surface groups which have various energy levels, resulting in a series of emissive traps.
2.3 Photothermia
The spectrophotometric study has highlighted the optical and photoluminescence properties of the CDs. The heat-producing ability under illumination with laser radiation (photothermia) was investigated. The surface-confined charges of the CDs are expected to contribute to the optical properties in the first biological visible/NIR window from 680 nm to 980 nm.42Notably, their absorption at these wavelengths should be attributed to electron transitions between the trap-state energy levels on the surface. These trap-states play a major role in generating phonons (heat) through Shockley-Read-Hall electron–hole recombination or other defect-related paths.35
A fixed concentration of CDs (40 μg mL−1) at pH 8, was irradiated at two different wavelengths (680 nm and 808 nm). Different laser power densities were investigated for each wavelength: 0.3, 1 and 1.9 W cm−2. In Fig. 6, each sample was thermostated at 37 °C and after switching on the laser, the rise in temperature was plotted as a function of time. A plateau was reached after 8 minutes, whereupon the laser was switched off and the decrease in temperature was registered for a further 8 minutes. The highest temperature increments, 30 and 40 °C, were observed for 680 nm at 1 and 1.9 W cm−2, respectively. Smaller increments were obtained for 808 nm at 1.9 W cm−2 (16 °C), for 680 nm at 0.3 W cm−2 (10 °C) and 808 nm at 1 W cm−2 (10 °C). Irradiation at 808 nm and 0.3 W cm−2 gave the lowest increase (3 °C). The heating can therefore be easily tuned through the laser power density and wavelength to attain the temperature range required for therapeutic applications at low CD concentrations. Overall, the excellent heating capacities of CDs make them good candidates for photothermal therapy.
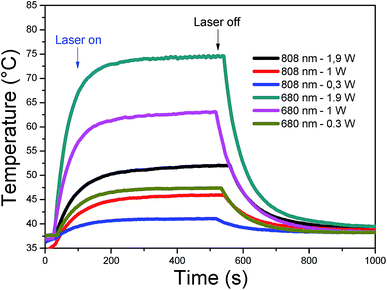 | ||
| Fig. 6 Heating curves of CDs (40 μg mL−1) in PT mode under 808 and 680 nm laser (power: 0.3, 1, and 1.9 W cm−2). | ||
2.4 Cytotoxicity
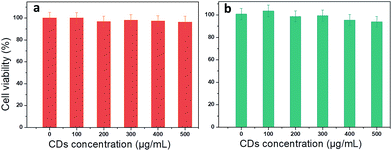
To check whether the use of CDs is favourable for medical applications, cytotoxicity was tested in two different cell lines: cancerous (Prostate cancer cells, PC-3) and non-malignant cells (Madin Darby Canine Kidney, MDCK.2). Methylene blue assay was used to perform the viability test at different CD concentrations from 0 to 500 μg mL−1. PC-3 cells show a small decrease in viability (5%) starting at very high concentration (400 and 500 μg mL−1) (Fig. 7). There is no significant loss in viability of MDCK.2 cells even at higher concentration. This result is consistent with the potential use of CDs to treat different pathologies such as cancer or bacterial infection.2.5. Applications: multifunctionality of CDs
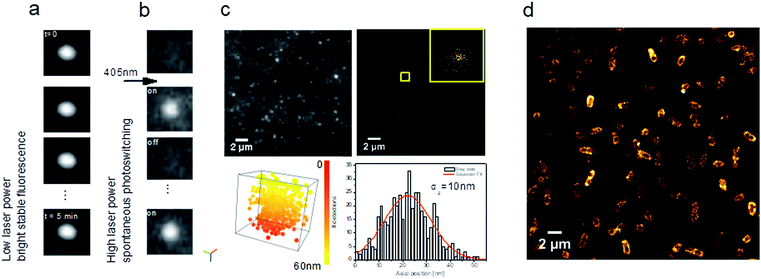 | ||
| Fig. 8 Carbon dots as multi-tasking tools for single-molecule localization microscopy. (a) Representative images of a time series showing a stable bright fluorescence or (b) UV-induced blinking under continuous excitation at 639 nm; (c) TIRF image extracted from a time series (see ESI Video SI-1†) showing blinking of CD solution (left) and reconstructed image of xy localization (right). Inset shows xy dispersion for a single CD showing a standard deviation σx,y = 10 nm (bottom, left, Video SI-2†). 3D visualization of xyz localization (box size: x, y, z = 55 nm) (bottom, right). Axial localization distribution for a single CD. σz represents the standard deviation of the axial distribution. Colour bar corresponds to the axial position from 0 to 55 nm; (d) fluorescence nanoscopy image of E. coli incubated with CDs. | ||
Interestingly, when the 639 nm laser power (as used in SMLM) is increased (200 mW) together with continuous 405 nm irradiation at low power, CDs exhibit spontaneous photoswitching (Fig. 8b; Video SI-1†). To the best of our knowledge, this intriguing phenomenon of reversible photoswitching has only been reported for photoswitchable fluorescent proteins32 and very recently for the first time for CDs.12,46 Excitation at 405 nm switches on CDs and 639 nm quenches them, while continuous excitation at 405 nm (1 mW) induces spontaneous photoswitching of CDs. In contrast to commonly-used photoswitchable organic fluorophores, where blinking is induced by means of a specific imaging buffer (consisting usually of a thiol and oxygen-scavenging enzyme systems), the CDs spontaneously blink under continuous UV irradiation.
Given their photoswitching properties and their small size (2–10 nm), CDs are highly suitable for characterizing the performances of SMLM, in particular the localization precision σ (Fig. 8c), which to a first approximation is proportional to the standard deviation of the point spread function (the response of an imaging system to a point source) over N, the number of photons detected.47Fig. 8c shows the dispersion of localizations in 3D, indicating a localization precision of 10 nm for both the lateral and axial directions.
These photophysical properties make CDs particularly interesting fluorescent probes for SMLM and open up many applications in live-cell bioimaging, since in this case there is no need for specific imaging buffers which are, moreover, cytotoxic.32,48 As a proof-of-concept for bioimaging, we used E. coli MG1655, a non-pathogenic Gram(−) bacterial strain. As shown in Fig. 8d, CDs were internalized and homogenously localized within the bacteria. A clustering analysis using the DBSCAN algorithm49 led to an estimate of about 22![[thin space (1/6-em)]](https://www.rsc.org/images/entities/char_2009.gif) 000 localizations per bacterium. These CDs can thus be used to obtain images of biological samples such as eukaryotic cells or bacteria, for example, with the same fluorophore used for calibration.
000 localizations per bacterium. These CDs can thus be used to obtain images of biological samples such as eukaryotic cells or bacteria, for example, with the same fluorophore used for calibration.
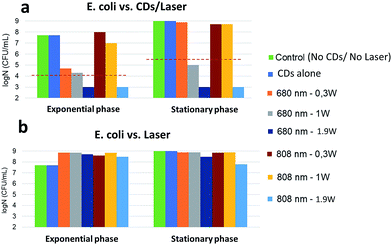
Exponentially-growing and stationary phase E. coli were incubated with CDs for 30 minutes at 37 °C and photothermal treatment was then performed by irradiating the sample for 8 minutes with a laser (680 nm or 808 nm). The temperature increment induced by irradiation of the CDs was then determined in each case and related to the survival rate (log![[thin space (1/6-em)]](https://www.rsc.org/images/entities/char_2009.gif) N) of the bacteria (Fig. SI†). A bactericidal effect was defined as a 3-log reduction in bacterial counts compared to the control (without CDs). Fig. 9a shows that the exponential phase is sensitive to the temperature increment (Fig. SI-3,† 12 < ΔT < 45 °C) resulting from the irradiation with a 680 nm laser: while the effect was bactericidal at 0.3 or 1 W cm−2, complete eradication was only found at 1.9 W cm−2. Irradiation at 808 nm was ineffective at lower powers but led to a complete eradication at 1.9 W cm−2. Against stationary phase cells, irradiation at 680 nm was ineffective at 0.3 W cm−2 and bactericidal at 1 W cm−2. Complete eradication was achieved with both wavelengths at 1.9 W cm−2. Consistently with previous literature data,52 bacteria are more resistant to local heat increase in the stationary phase than in the exponential phase. The temperature increment induced by the CDs strongly correlates with bacterial killing. When the laser was applied to E. coli in the absence of CDs, bacteria continued to grow without any toxicity or alteration of log
N) of the bacteria (Fig. SI†). A bactericidal effect was defined as a 3-log reduction in bacterial counts compared to the control (without CDs). Fig. 9a shows that the exponential phase is sensitive to the temperature increment (Fig. SI-3,† 12 < ΔT < 45 °C) resulting from the irradiation with a 680 nm laser: while the effect was bactericidal at 0.3 or 1 W cm−2, complete eradication was only found at 1.9 W cm−2. Irradiation at 808 nm was ineffective at lower powers but led to a complete eradication at 1.9 W cm−2. Against stationary phase cells, irradiation at 680 nm was ineffective at 0.3 W cm−2 and bactericidal at 1 W cm−2. Complete eradication was achieved with both wavelengths at 1.9 W cm−2. Consistently with previous literature data,52 bacteria are more resistant to local heat increase in the stationary phase than in the exponential phase. The temperature increment induced by the CDs strongly correlates with bacterial killing. When the laser was applied to E. coli in the absence of CDs, bacteria continued to grow without any toxicity or alteration of log![[thin space (1/6-em)]](https://www.rsc.org/images/entities/char_2009.gif) N in both growth phases (Fig. 9b). This shows that laser irradiation alone has no impact on bacterial development even at high power densities.
N in both growth phases (Fig. 9b). This shows that laser irradiation alone has no impact on bacterial development even at high power densities.
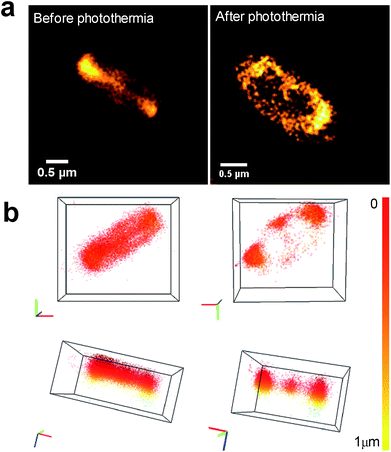
Using 3D nanoscopy before photothermal treatment, we show that the CDs are mainly internalized inside bacteria without any toxicity or damage (Fig. 10a, before photothermia). When E. coli were incubated with CDs, there are two possible situations after photothermal treatment: (i) complete eradication, and (ii) bactericidal effect with a subpopulation of surviving bacteria. In the case of complete eradication (log![[thin space (1/6-em)]](https://www.rsc.org/images/entities/char_2009.gif) N < 3), no bacteria were visible under the microscope (figure not shown). In the intermediate case (Fig. 10a, after photothermia), CDs are preferentially localized at the bacterial poles and at the septum. The number of CD localizations per bacterium, assessed by the DBSCAN algorithm, is about 9000 at the poles and about 700 at the septum. This change in CD localization within bacteria could be explained by the fact that the poles of rod-shaped bacterial cells play an important role in various molecular processes, including DNA segregation, metabolic regulation and aggregate clearance.53
N < 3), no bacteria were visible under the microscope (figure not shown). In the intermediate case (Fig. 10a, after photothermia), CDs are preferentially localized at the bacterial poles and at the septum. The number of CD localizations per bacterium, assessed by the DBSCAN algorithm, is about 9000 at the poles and about 700 at the septum. This change in CD localization within bacteria could be explained by the fact that the poles of rod-shaped bacterial cells play an important role in various molecular processes, including DNA segregation, metabolic regulation and aggregate clearance.53
3. Experimental section
3.1 Synthetic procedures
CDs were synthesized directly from D-(β)-glucose by a one-step alkali-assisted ultrasonic treatment adapted from a reported method.4 Briefly, a 1 M solution of D-(β)-glucose was prepared in a 0.5 M aqueous solution of NaOH. The mixture was then ultrasonicated for 4 hours (frequency 35 kHz, power 100% (750 W)) using an Elma TI-H-15 sonicator. The resulting CDs were obtained as a very stable and highly dispersed colloidal suspension, dark brown in our case and yellow according to the previous report (Fig. SI†). Excess glucose was removed in 24 h by means of a Float-A-Lyzer G2 dialysis device (MWCO 0.5–1 kDa). Finally the dark brown suspension of CDs was stored in the dark at 4 °C.3.2 Materials and methods
![[thin space (1/6-em)]](https://www.rsc.org/images/entities/char_2009.gif) :
:![[thin space (1/6-em)]](https://www.rsc.org/images/entities/char_2009.gif) 100 subculture grown 3 h in LB).
100 subculture grown 3 h in LB).
To assess the effect of the photothermal treatment on bacteria, each sample was centrifuged for 10 min at 5000g in order to eliminate the excess CD. The bacterial pellet was dispersed in 40 μL sterile NaCl (150 mM), centrifuged again and dispersed under the same conditions. Successive 10-fold dilutions were then made. For each dilution, three drops (10 μL) were deposited on Luria Broth agar (LB agar) plates, and incubated at 37 °C for 24 h. Colony Forming Units (CFUs) were counted and averaged for each dilution at each time. The detection limit of viable culturable cells was 100 CFU mL−1.
![[thin space (1/6-em)]](https://www.rsc.org/images/entities/char_2009.gif) 000 frames. To induce blinking behaviour, irradiation at 405 nm was added at different time intervals. (ii) Bacteria were imaged by using continuous excitation at 639 nm, in the HiLo mode. Most of the fluorescent CDs were induced into a dark state until a sufficient density was obtained (typically 1 molecule per bacterium per frame). Image series were recorded with a 50 ms exposure time. Resulting coordinate tables and images were processed and analyzed using SAFe NEO software (Abbelight, France).
000 frames. To induce blinking behaviour, irradiation at 405 nm was added at different time intervals. (ii) Bacteria were imaged by using continuous excitation at 639 nm, in the HiLo mode. Most of the fluorescent CDs were induced into a dark state until a sufficient density was obtained (typically 1 molecule per bacterium per frame). Image series were recorded with a 50 ms exposure time. Resulting coordinate tables and images were processed and analyzed using SAFe NEO software (Abbelight, France).
4. Conclusions
CDs prepared from glucose by ultrasonic treatment open up many possibilities in several domains. We have established that they can be used as a tool for calibration and bioimaging, thanks to their remarkable photoluminescence and photoswitching properties. Photothermia by means of a laser at 680 nm produces enough heat to completely eradicate E. coli at relatively low power density. Further research could increase even further the absorption of CDs in the NIR region (800–1000 nm) by doping with heteroatoms in order to tailor them for applications in bioimaging and in the photothermal treatment of diseases, such as cancer or bacterial infection. Furthermore, functionalizing the surface of CDs, for instance, with proteins could enhance their targeting ability for these applications.The exact molecular mechanism of photoswitching is still not fully understood. A better understanding of the structure–property correlation and the mechanism of blinking is the key to the development of applications of CDs in 3D fluorescence nanoscopy.
Conflicts of interest
There are no conflicts to declare.Acknowledgements
ANR (Agence Nationale de la Recherche) and CGI (Commissariat à l'Investissement d'Avenir) are gratefully acknowledged for their financial support of this work through Labex SEAM (Science and Engineering for Advanced Materials and devices) ANR 11 LABX 086, ANR 11 IDEX 05 02.Notes and references
- Y. Zhang, M. Park, H. Y. Kim, B. Ding and S.-J. Park, Sci. Rep., 2017, 7, 45086 CrossRef CAS PubMed.
- X. Xu, R. Ray, Y. Gu, H. J. Ploehn, L. Gearheart, K. Raker and W. A. Scrivens, J. Am. Chem. Soc., 2004, 126, 12736–12737 CrossRef CAS PubMed.
- S. N. Baker and G. A. Baker, Angew. Chem., 2010, 49, 6726–6744 CrossRef CAS PubMed.
- H. Li, X. He, Y. Liu, H. Huang, S. Lian, S.-T. Lee and Z. Kang, Carbon, 2011, 49, 605–609 CrossRef CAS.
- M. Havrdova, K. Hola, J. Skopalik, K. Tomankova, M. Petr, K. Cepe, K. Polakova, J. Tucek, A. B. Bourlinos and R. Zboril, Carbon, 2016, 99, 238–248 CrossRef CAS.
- A. B. Bourlinos, A. Stassinopoulos, D. Anglos, R. Zboril, M. Karakassides and E. P. Giannelis, Small, 2008, 4, 455–458 CrossRef CAS PubMed.
- H. L. Li, Z. Kang, Y. Liu and S. T. Lee, J. Mater. Chem., 2012, 22, 24230–24253 RSC.
- D. Li, P. Jing, L. Sun, Y. An, X. Shan, X. Lu, D. Zhou, D. Han, D. Shen, Y. Zhai, S. Qu, R. Zboril and A. L. Rogach, Adv. Mater., 2018, 30, e1705913 CrossRef PubMed.
- H. Yu, R. Shi, Y. Zhao, G. I. Waterhouse, L. Z. Wu, C. H. Tung and T. Zhang, Adv. Mater., 2016, 28, 9454–9477 CrossRef CAS PubMed.
- H. Li, X. He, Z. Kang, H. Huang, Y. Liu, J. Liu, S. Lian, C. H. Tsang, X. Yang and S. T. Lee, Angew. Chem., 2010, 49, 4430–4434 CrossRef CAS PubMed.
- C. Hu and L. Dai, Angew. Chem., 2016, 55, 11736–11758 CrossRef CAS PubMed.
- N. C. Verma, S. Khan and C. K. Nandi, Methods Appl. Fluoresc., 2016, 4, 044006 CrossRef PubMed.
- L. Cao, X. Wang, M. J. Meziani, F. Lu, H. Wang, P. G. Luo, Y. Lin, B. A. Harruff, L. M. Veca, D. Murray, S. Y. Xie and Y. P. Sun, J. Am. Chem. Soc., 2007, 129, 11318–11319 CrossRef CAS PubMed.
- J. Tang, B. Kong, H. Wu, M. Xu, Y. Wang, Y. Wang, D. Zhao and G. Zheng, Adv. Mater., 2013, 25, 6569–6574 CrossRef CAS PubMed.
- Q. Wang, X. Huang, Y. Long, X. Wang, H. Zhang, R. Zhu, L. Liang, P. Teng and H. Zheng, Carbon, 2013, 59, 192–199 CrossRef CAS.
- B. Tian, C. Wang, S. Zhang, L. Feng and Z. Liu, ACS Nano, 2011, 5, 7000–7009 CrossRef CAS PubMed.
- X. Tu, Y. Ma, Y. Cao, J. Huang, M. Zhang and Z. Zhang, J. Mater. Chem. B, 2014, 2, 2184–2192 RSC.
- J. C. G. Esteves da Silva and H. M. R. Gonçalves, TrAC, Trends Anal. Chem., 2011, 30, 1327–1336 CrossRef CAS.
- X. Sun and Y. Lei, TrAC, Trends Anal. Chem., 2017, 89, 163–180 CrossRef CAS.
- J. Wang, C. F. Wang and S. Chen, Angew. Chem., 2012, 51, 9297–9301 CrossRef CAS PubMed.
- M. J. Krysmann, A. Kelarakis and E. P. Giannelis, Green Chem., 2012, 14, 3141–3145 RSC.
- A. Rahy, Y. Zhou, J. Zheng, S. Y. Park, M. J. Kim, I. K. Jang, S. J. Cho and D. J. Yang, Carbon, 2012, 50, 1298–1302 CrossRef CAS.
- A. A. P. Mansur, H. S. Mansur, F. P. Ramanery, L. C. Oliveira and P. P. Souza, Appl. Catal., B, 2014, 158–159, 269–279 CrossRef CAS.
- T.-N. Pham-Truong, T. Petenzi, C. Ranjan, H. Randriamahazaka and J. Ghilane, Carbon, 2018, 130, 544–552 CrossRef CAS.
- Z. Zhang, C. Fang, X. Bing and Y. Lei, Materials, 2018, 11, 512 CrossRef PubMed.
- X. Shan, L. Chai, J. Ma, Z. Qian, J. Chen and H. Feng, Analyst, 2014, 139, 2322–2325 RSC.
- Y. Liu, C. Y. Liu and Z. Y. Zhang, J. Colloid Interface Sci., 2011, 356, 416–421 CrossRef CAS PubMed.
- V. B. Kumar, Z. Porat and A. Gedanken, Ultrason. Sonochem., 2016, 28, 367–375 CrossRef CAS PubMed.
- H. Li, Z. Kang, Y. Liu and S.-T. Lee, J. Mater. Chem., 2012, 22, 24230 RSC.
- J. J. Hinman and K. S. Suslick, Top. Curr. Chem., 2017, 375, 1–36 CrossRef CAS PubMed.
- C. Cabriel, N. Bourg, G. Dupuis and S. Leveque-Fort, Opt. Lett., 2018, 43, 174–177 CrossRef CAS PubMed.
- B. Turkowyd, D. Virant and U. Endesfelder, Anal. Bioanal. Chem., 2016, 408, 6885–6911 CrossRef CAS PubMed.
- S. Khan, N. C. Verma, A. Gupta and C. K. Nandi, Sci. Rep., 2015, 5, 11423 CrossRef CAS PubMed.
- M. Zheng, Y. Li, S. Liu, W. Wang, Z. Xie and X. Jing, ACS Appl. Mater. Interfaces, 2016, 8, 23533–23541 CrossRef CAS PubMed.
- C. Lee, W. Kwon, S. Beack, D. Lee, Y. Park, H. Kim, S. K. Hahn, S. W. Rhee and C. Kim, Theranostics, 2016, 6, 2196–2208 CrossRef CAS PubMed.
- M. Lan, S. Zhao, Z. Zhang, L. Yan, L. Guo, G. Niu, J. Zhang, J. Zhao, H. Zhang, P. Wang, G. Zhu, C.-S. Lee and W. Zhang, Nano Res., 2017, 10, 3113–3123 CrossRef CAS.
- B. Geng, D. Yang, D. Pan, L. Wang, F. Zheng, W. Shen, C. Zhang and X. Li, Carbon, 2018, 134, 153–162 CrossRef CAS.
- X. Bao, Y. Yuan, J. Chen, B. Zhang, D. Li, D. Zhou, P. Jing, G. Xu, Y. Wang, K. Hola, D. Shen, C. Wu, L. Song, C. Liu, R. Zboril and S. Qu, Light: Sci. Appl., 2018, 7, 91 CrossRef PubMed.
- N. Sattarahmady, M. Rezaie-Yazdi, G. H. Tondro and N. Akbari, J. Photochem. Photobiol., B, 2017, 166, 323–332 CrossRef CAS PubMed.
- W. Cai, R. D. Piner, F. J. Stadermann, S. Park, M. A. Shaibat, Y. Ishii, D. Yang, A. Velamakanni, S. J. An, M. Stoller, J. An, D. Chen and R. S. Ruoff, Science, 2008, 321, 1815–1817 CrossRef CAS PubMed.
- N. Baccile, G. Laurent, F. Babonneau, F. Fayon, M.-M. Titirici and M. Antonietti, J. Phys. Chem. C, 2009, 113, 9644–9654 CrossRef CAS.
- D. Jaque, L. Martinez Maestro, B. del Rosal, P. Haro-Gonzalez, A. Benayas, J. L. Plaza, E. Martin Rodriguez and J. Garcia Sole, Nanoscale, 2014, 6, 9494–9530 RSC.
- L. Schermelleh, A. Ferrand, T. Huser, C. Eggeling, M. Sauer, O. Biehlmaier and G. P. C. Drummen, Nat. Cell Biol., 2019, 21, 72–84 CrossRef CAS PubMed.
- N. Bourg, C. Mayet, G. Dupuis, T. Barroca, P. Bon, S. Lécart, E. Fort and S. Lévêque-Fort, Nat. Photonics, 2015, 9, 587–594 CrossRef CAS.
- G. T. Dempsey, M. Bates, W. E. Kowtoniuk, D. R. Liu, R. Y. Tsien and X. Zhuang, J. Am. Chem. Soc., 2009, 131, 18192–18193 CrossRef CAS PubMed.
- H. Wang, Y. Rivenson, Y. Jin, Z. Wei, R. Gao, H. Gunaydin, L. A. Bentolila, C. Kural and A. Ozcan, Nat. Methods, 2019, 16, 103–110 CrossRef CAS PubMed.
- A. V. Diezmann, Y. Shechtman and W. E. Moerner, Chem. Rev., 2017, 117, 7244–7275 CrossRef PubMed.
- A. G. Godin, B. Lounis and L. Cognet, Biophys. J., 2014, 107, 1777–1784 CrossRef CAS PubMed.
- M. Ester, H.-P. Kriegel, R. G. Sander and X. Xu, Presented in part at the Proceedings of the Second International Conference on Knowledge Discovery and Data Mining, Portland, Oregon, 1996 Search PubMed.
- S. T. Odonkor and K. K. Addo, Int. J. Microbiol., 2018, 2018, 7204013 Search PubMed.
- J. M. N. Llorens, A. Tormo and E. Martinez-Garcia, FEMS Microbiol. Rev., 2010, 34, 476–495 CrossRef CAS PubMed.
- D. S. Arora and J. Kaur, Int. J. Antimicrob. Agents, 1999, 12, 257–262 CrossRef CAS.
- S. Govindarajan, N. Albocher, T. Szoke, A. Nussbaum-Shochat and O. Amster-Choder, Front. Microbiol., 2017, 8, 2695 CrossRef.
- C. Cabriel, N. Bourg, P. Jouchet, G. Dupuis, C. Leterrier, A. Baron, M.-A. Badet-Denisot, B. Vauzeilles, E. Fort and S. Lévêque-Fort, Nat. Commun., 2019, 10, 1–10 CrossRef CAS PubMed.
Footnotes |
| † Electronic supplementary information (ESI) available. See DOI: 10.1039/c9na00140a |
| ‡ Contributed equally to this work. |
| This journal is © The Royal Society of Chemistry 2019 |

