
 Open Access Article
 This Open Access Article is licensed under a Creative Commons Attribution-Non Commercial 3.0 Unported Licence
tRNA as a stabilizing matrix for fluorescent silver clusters: photophysical properties and IR study†
Tomash S.
Sych
 *,
Alexander M.
Polyanichko
,
Ruslan R.
Ramazanov
and
Alexei I.
Kononov
*,
Alexander M.
Polyanichko
,
Ruslan R.
Ramazanov
and
Alexei I.
Kononov
Saint Petersburg State University, Saint-Petersburg 199034, Russia. E-mail: inxalid@gmail.com
First published on 23rd July 2019
Abstract
In this experimental study fluorescent silver clusters on a tRNA matrix were synthesized for the first time. Two types of fluorescent complexes emitting in the green (550 nm) and red (635 nm) regions of the visible spectrum were obtained. Using FTIR spectroscopy, we identified possible binding sites for the clusters, which appeared to be within the helical regions of tRNA. It was also shown that tRNA retained its double helical structure after the cluster formation, which is essential for its functionality.
Introduction
Nucleic acids and proteins are widely used as stabilizing matrices for fluorescent metal nanoclusters (NCs). The study of the photophysical properties of NCs and their complexes has now become a valuable task.1 A great number of studies are currently devoted to the synthesis of luminescent silver (Ag) clusters on DNA of various nucleotide sequences.2,3 It was shown that the optical properties of the clusters strongly depend on the nucleotide sequence of the stabilizing matrix. It was suggested that the clusters had an elongated structure4,5 and were stabilized by two NA strands in the double-stranded regions.6–9 Indeed, thread-like chains of Ag ions/atoms have been observed in some Ag–DNA crystal structures.10,11So far, a wealth of experimental material regarding synthesis of luminescent silver clusters on DNA has been accumulated. However, very little is known about the spectral properties and stability of luminescent clusters on RNA.12,13 In particular, transfer RNA (tRNA) has never been considered as such a stabilizing matrix before. Nowadays, tRNAs labeled with various organic dyes are widely used for in vivo and in vitro studies.14–16 Nevertheless, new labeling strategies are always of great need, aiming at improvement of the photostability of the label and lowering the side effect on the functionality of biomolecules. To overcome this limitation, we suggest the use of tRNA as a stabilizing matrix for luminescent Ag clusters. tRNA has a specific secondary structure (Fig. 1)17 with several loops and double helical regions,18,19 which is suitable for the cluster growth. If the native structure of functional groups of tRNAs (in particular, the CCA tail and the anticodon loop) is not changed in their complexes with luminescent nanoclusters (tRNA–AgNCs), the latter can be used for visualizing tRNA in living cells. We have synthesized two types of clusters, emitting in the green and red spectral regions, using bulk bacterial tRNA. Using FTIR spectroscopy we have also analyzed structural changes in tRNA upon binding Ag ions and Ag clusters.
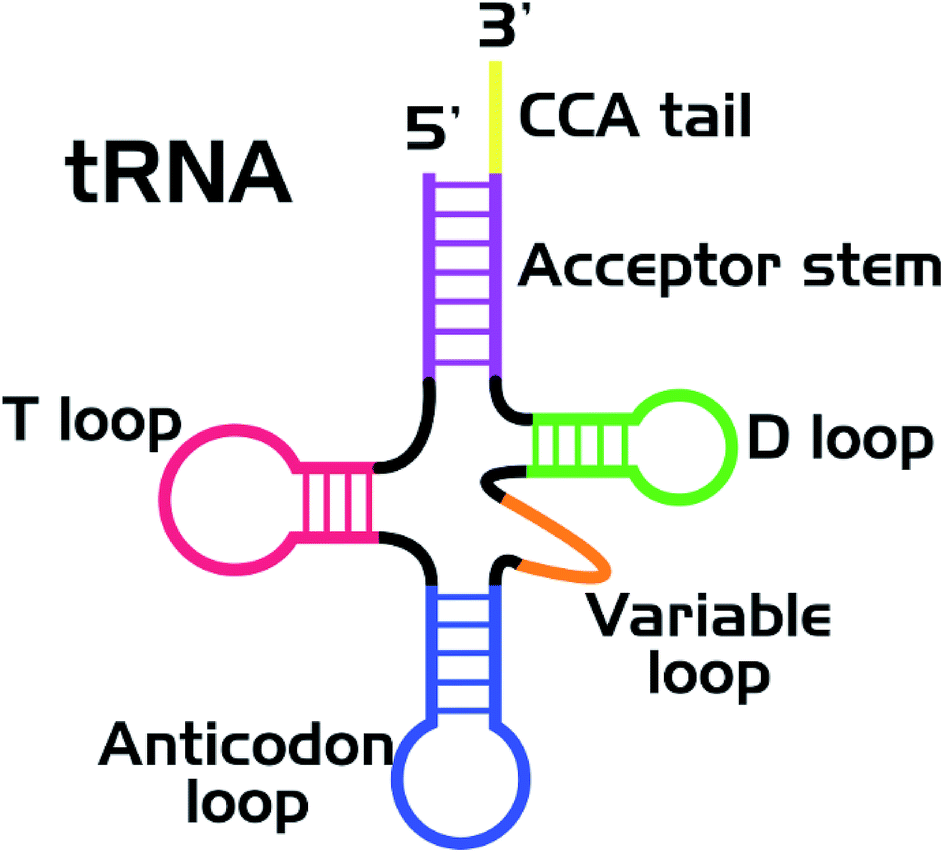 | ||
| Fig. 1 Secondary (cloverleaf) structure of tRNA. | ||
Materials and methods
Chemicals
Bulk tRNAs from E. coli (Sigma-Aldrich #R1753, type XX, strain W), silver nitrate (AgNO3), sodium borohydride (NaBH4) and potassium bromide (KBr) were purchased from Sigma. Rhodamine 6G (R6G) was supplied by Lambda Physik.Synthesis of fluorescent clusters
Depending on the desired “color” of the cluster, 1.2 μl (for synthesis of green emitters) or 2.4 μl (for red emitters) of 0.1 M AgNO3 solution was added to 940 μl of 0.24 mMPh (in moles of nucleotide) tRNA solution. The mixture was incubated for 1 hour under vigorous stirring at room temperature. Next, 60 μl of freshly prepared 1 mM NaBH4 solution was added into the mixture. The final solution was kept at room temperature for 1 hour, and after that it was kept at 4 °C in the dark (for “red” NCs) and at room temperature (for “green” NCs) until further analysis (usually at least 1 day). The optimal molar ratios (see the “Results and discussion”) were as follows: [tRNA]![[thin space (1/6-em)]](https://www.rsc.org/images/entities/char_2009.gif) :[Ag+] = 2:1 and [Ag+]:[NaBH4] = 2:1 for “green” type NCs; [tRNA]:[Ag+] = 1:1 and [Ag+]:[NaBH4] = 4:1 for “red” type NCs.
:[Ag+] = 2:1 and [Ag+]:[NaBH4] = 2:1 for “green” type NCs; [tRNA]:[Ag+] = 1:1 and [Ag+]:[NaBH4] = 4:1 for “red” type NCs.
Spectral methods
Fluorescence emission and excitation spectra were obtained at room temperature using an RF-6000 spectrofluorophotometer (Shimadzu). The measurements were carried out in a 0.4 cm quartz cuvette (Hellma Analytics). Long-wave pass filters were used to remove scattered light. The fluorescence emission spectra were corrected for instrument sensitivity. The fluorescence excitation spectra were corrected for the inner filter effect due to the high absorbance of the samples in the UV range as described elsewhere.6 The bandpass for excitation and emission was set at 5 nm. Fluorescence decay curves were obtained using a Fluorolog-3 spectrofluorometer (Horiba Jobin Yvon) employing LEDs with a full width at half maximum (FWHM) of about 2 ns. The emission bandpass was set at 14 nm. The fluorescence quantum yield of the tRNA–AgNCs was measured using R6G in ethanol (QY = 0.95) as a reference. 20 Absorption spectra were obtained with a Specord 210 Plus double-beam spectrophotometer (Analytik Jena).Prior to FTIR measurements all sample solutions were lyophilized using a Scientz-N12 freeze drier (Vilitek). The obtained powder was used to prepare KBr pellets of each sample. KBr powder of spectroscopic grade (PIKE Technologies, USA) was used to prepare the pellets. The samples were carefully blended with the KBr powder (approx. 1% mixture w/w), using an agate mortar and pestle (PIKE Technologies, USA). 7 mm pellets were formed using 50 mg of the obtained uniform powder and a hand press (PIKE Technologies, USA). IR spectra of the pellets were recorded using a Tensor 27 FTIR spectrometer (Bruker), purged with dry nitrogen and equipped with an MCT detector. Each spectrum was recorded with 4 cm−1 resolution and averaged by 128 accumulations. Background subtraction and baseline correction were performed using OPUS software provided by the spectrometer manufacturer. Each spectrum was further normalized to obtain an equal absorbance at 965 cm−1 attributed to a sugar ring vibration.
Results and discussion
To the best of our knowledge, tRNA has never been used for NC synthesis before. Thus, first of all, we have determined the optimal synthesis conditions, based on the protocol previously developed for DNA oligonucleotides.7 The obtained results demonstrated that, in the case of tRNA, there are two bands in the green and red regions of the emission spectrum (Fig. 2). For further convenience, we will denote them as “green” and “red” types of NCs. In order to determine the optimal synthesis conditions for each type of NC, the effects of pH and reaction time on their photophysical properties were studied. | ||
| Fig. 2 2D fluorescence contour plot for tRNA–AgNCs. | ||
Fig. 3 shows the dependence of emission intensity on pH. In the case of protonated tRNA (pH 5), a rather weak emission was observed for both types of clusters. Deprotonation of the tRNA (pH 10) improved the situation slightly. However, the maximal emission intensity was achieved at pH 7, which seems to be optimal for the synthesis of both types of clusters.
 | ||
| Fig. 3 Emission intensity at 550 nm (two bottom curves) and 635 nm (two upper curves) with excitation at 280 nm. | ||
We have also determined the optimal proportions of the reagents required to obtain each type of NC (Table S1†). It is noteworthy that the type of NC dominant in the resulting complex depends on the ratio between Ag+ ions and the reducing agent in the reaction mixture. Particularly, with a larger amount of Ag+ and a smaller amount of NaBH4 we obtained a “red” NC, while “green” NCs are obtained under opposite conditions (with the same amount of tRNA). It is also essential to note that following either synthetic strategy we have obtained both types of clusters (Fig. S1 and S2†).
Fig. 4 shows the spectral properties of the “red” clusters. For this type of cluster, one can observe narrow excitation and emission bands with a relatively small Stokes shift (0.3 eV). Fig. 5 shows the spectral properties of the “green” clusters. It is interesting to note that the excitation maximum of the “red” cluster coincides with the emission maximum of the “green” species (Fig. 5).
 | ||
| Fig. 4 Fluorescence excitation, emission, excitation and emission anisotropy and absorption spectrum for the “red” type of tRNA–AgNCs (λex 550 nm, λem 635 nm). | ||
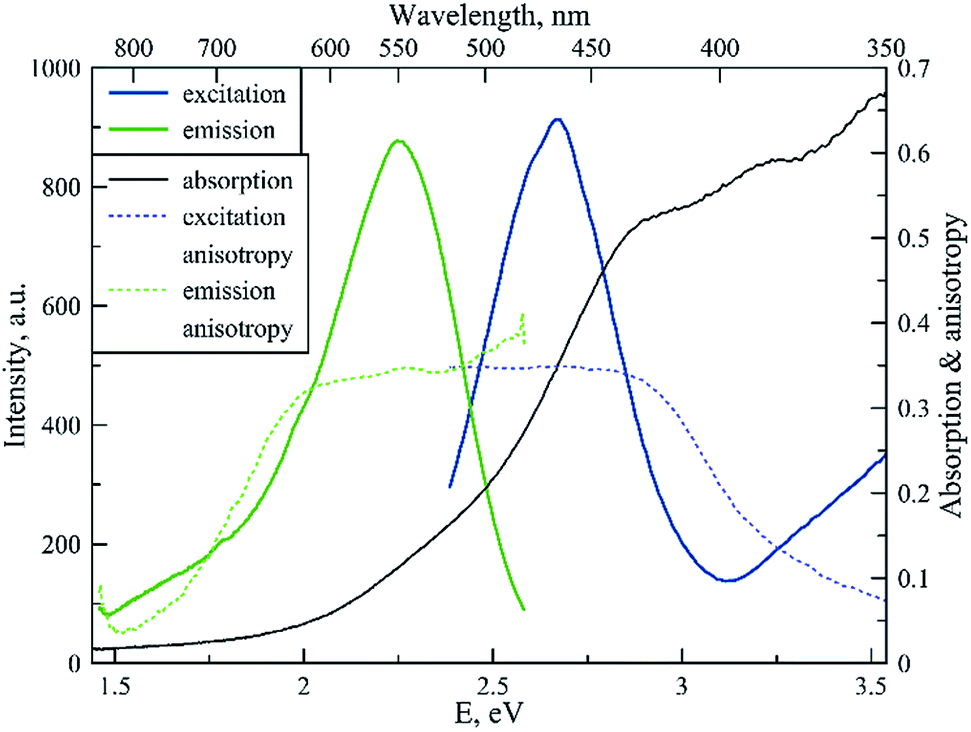 | ||
| Fig. 5 Fluorescence excitation, emission, excitation and emission anisotropy and absorption spectrum for the “green” type of tRNA–AgNCs (λex 465 nm, λem 550 nm). | ||
One can note that the shape of the absorption spectrum is quite different from the shape of the excitation spectrum. This may indicate that we have a rather heterogeneous system containing dark non-luminescent clusters and/or some large silver particles. The emission anisotropy curves of both clusters (Fig. 4 and 5) exhibit quite typical behavior at the red slopes of the bands that can be attributed to relaxation processes of nanosecond time scale and reorientation of the dipole moments of the emitters.21
Multi-exponential behavior of the fluorescence decay curves (Fig. S3 and S4†) can also be considered as a manifestation of the relaxation.22 We have also studied the stability of the obtained complexes under different conditions of storage of the complexes: at room temperature and at 4 °C (Fig. S5†). It was found that the red clusters appear to be less stable than the green ones.
The major photophysical characteristics of NCs are summarized in Table 1. The photophysical features (Stokes shifts, fluorescence decays, and fluorescence anisotropy curves) of the clusters on tRNA resemble the cluster properties on DNA sequences,2,3 which probably indicates similar structural properties.
| Cluster type | “Green” | “Red” | |
|---|---|---|---|
| Reagent ratios | tRNA | Equal | |
| [tRNA]/[AgNO3] | 2:1 |
1:1 |
|
| [AgNO3]/[NaBH4] | 2:1 |
4:1 |
|
| Excitation maximum, nm | 465 | 550 | |
| Emission maximum, nm | 550 | 635 | |
| Stokes shift, eV | 0.4 | 0.3 | |
| Lifetime, ns | 0.7 (80%) | 1.4 (57%) | |
| 2.7 (20%) | 3.1 (43%) | ||
| av. 1.1 | av. 2.1 | ||
| Quantum yield | 2% | 6% | |
We have obtained FTIR spectra of pure tRNA and its complexes with Ag+ ions and Ag clusters. The baseline corrected spectra in the range of 1900–800 cm−1 are presented in Fig. 6. The mid-IR spectra of tRNA contain two major regions corresponding to the vibrations of the nitrogenous bases (1800 to ca. 1300 cm−1) and to the vibrations of the sugar phosphate backbone (ca. 1300–800 cm−1). The sharp band at 1384 cm−1 dominant in the spectra of the complexes is typical of the stretching vibrations of nitrates, originating from AgNO3, which is used to prepare the complexes. Besides, one can notice some other features induced in the RNA spectra by Ag+ ions and silver nanoclusters, which are summarized in Table 2.
 | ||
| Fig. 6 FTIR spectra of tRNA and its complexes with silver ions (tRNA–Ag+) and silver nanoclusters (tRNA–AgNCs). The spectra were normalized to the absorbance of the sugar band at 965 cm−1, so that A965 = 0.1 in each spectrum. | ||
| Assignment (based on data published elsewhere23–32) | Band position, cm−1 | ||
|---|---|---|---|
| tRNA | tRNA–Ag+ | tRNA–AgNCs | |
| a The bands marked with (+) and (−) in the complexes demonstrate, respectively, an increase and a decrease in absorbance compared to pure tRNA. | |||
Guanine C![[double bond, length as m-dash]](https://www.rsc.org/images/entities/char_e001.gif) O stretching coupled with NH2 scissoring O stretching coupled with NH2 scissoring |
1690 | 1683 (−) | 1686 (+) |
| Cytosine in-plane ring vibration | 1650 | 1650 (+) | 1650 (+) |
| 1604 | 1607 (−) | 1603 (+) | |
| Guanine CN stretching |
1576 sh | 1576 sh | 1576 sh |
| Cytosine NH and CH in-plane deformation modes of the ring | 1529 | 1531 (−) | 1530 (+) |
| 1490 | 1490 (−) | 1489 (+) | |
| Antisymmetric phosphate stretching | 1240 | 1238 | 1239 (+) |
| Ribose stretching at C2′ | 1114 | 1114 | 1114 |
| Symmetric phosphate stretching | 1084 | 1087 (+) | 1087 (+) |
| –C–O–P– stretching in RNA | 1062 | 1071 (+) | 1071 (+) |
| Ribose –C–O–C– symmetric stretching | 996 | 999 | 998 (−) |
| 965 | 967 | 965 (+) | |
| –C–O–P– stretching in RNA | 937 | 937 (+) | 938 (+) |
| Ribose ring –C–C– stretching | 914 | 914 (−) | 914 (−) |
| Ribose CH2 rocking | 879 | 881 | 880 (+) |
| 867 | 870 (−) | 869 (+) | |
| Symmetric ribose stretching at C2′ | 812 | 814 (−) | 816 (+) |
The major assignments are based on earlier published data regarding vibrational spectra of nucleic acids in general, and RNA in particular,23–28 and their complexes with silver ions.29–31 In the presence of Ag+ ions, distinct changes are observed in the spectra of tRNA in both the above-mentioned regions, attributed to vibrations of the nitrogenous bases and the sugar phosphate backbone. A comparison of the absorption spectra of bare tRNA and the spectra of the complexes reveals appreciable changes in the bands at 1690 and 1576 cm−1. The former may be due to the guanine (G) CO stretching and NH2 scissoring vibrations and/or interaction of the bases in the pairs,25 while the latter is typical of the interactions with the N7 atom of guanine.23,24,28 The changes in vibrational modes of cytosine can also be clearly seen at 1650, 1604, 1530 and 1490 cm−1. Vibrations at 1650 and 1604 cm−1 are attributed to the cytosine (C) in-plane ring vibrations, while the others at 1530 and 1490 cm−1 involve the NH and CH in-plane deformation modes of the cytosine ring.25 It is also worth noting that most of the above spectral features, as well as some less distinct changes observed in the spectra (see Table 2), are characteristic of the base pairing.24,28 The major changes in vibrations of the sugar phosphate backbone at 1240, 1114, 1084, 1070, 937, 880, 870 and 814 cm−1 indicate that binding of the silver ions to tRNA results in considerable changes in the backbone geometry.25,26,32 Most likely, the observed spectral pattern demonstrates that Ag+ ions primarily interact with GC pairs, which leads to their destabilization and, as a result, to the destabilization of the double helical structure of tRNA. The loss of hydrogen bonding also manifests itself as a hyperchromic effect observed in the UV spectrum of tRNA upon binding with Ag+ ions (Fig. S6†).
The situation is quite different in the case of tRNA complexes with silver nanoclusters. In the region of nitrogenous base vibrations, the most considerable changes are observed in cytosine vibrations at 1650 cm−1, accompanied by a slight increase in the intensity at 1690 and 1604 cm−1, both of which also involve cytosine ring vibrations. Absorbance of the groups within the sugar phosphate backbone does not demonstrate significant changes except for the bands at 1070 and 937 cm−1 and slight changes in vibrations at 870 and 814 cm−1. All of these bands are characteristic of RNA molecules,25,26,32 and it should be noted that they demonstrate changes in the direction opposite to those for tRNA–Ag+ complexes. Thus, we can conclude that the formation of the silver clusters results in partial stabilization of the helical regions of tRNA. We assume that when Ag+ ions are reduced, most of the Ag atoms are released from RNA strands, which allows tRNA to return to its native conformation. The remaining silver ions/atoms then assemble into the clusters stabilized by cytosine-rich regions in double-stranded RNA regions.
One can also notice here that the obtained complexes have photophysical properties and binding sites similar to those typical of the clusters on cytosine-rich DNA matrices.2 For example, in the case of short cytosine-rich DNA oligonucleotides,7 several types of luminescent clusters have been reported, including ones emitting in the green (λex 330 nm/λem 510 nm) and red (λex 530 nm/λem 620 nm) spectral regions. Petty and co-authors used longer oligonucleotides, also enriched in cytosine with adenine inclusions.8 As a result, they obtained a green cluster (λex 440 nm/λem 540 nm) similar to that observed for tRNA. Those observations are in line with our conclusions that the clusters bind to cytosines in tRNA.
Conclusions
We have shown that tRNA can stabilize fluorescent silver clusters. We have demonstrated the possibility of obtaining complexes emitting in the green (550 nm) and red (635 nm) regions of the visible spectrum. An FTIR study allowed us to identify possible binding sites for the clusters, which appeared to be within the cytosine-rich helical regions of tRNA. We have also shown that tRNA retained its double helical structure after the cluster formation. This is a promising feature, which is necessary for retaining the biological functionality of tRNA, though the latter should be validated in further studies. We hope that the results obtained in this work will contribute in further development of fluorescent Ag–RNA complexes and their application in bioimaging.Conflicts of interest
There are no conflicts to declare.Acknowledgements
This work was supported by the Russian Foundation for Basic Research (projects 18-33-00603 (cluster synthesis and photophysical studies) and 18-08-01500 (FTIR studies)). Some of the spectral measurements were performed using equipment from the Centre for Optical and Laser Materials Research of Saint-Petersburg State University.Notes and references
- I. Chakraborty and T. Pradeep, Chem. Rev., 2017, 117, 8208–8271 CrossRef CAS.
- Z. Yuan, Y.-C. Chen, H.-W. Li and H.-T. Chang, Chem. Commun., 2014, 50, 9800–9815 RSC.
- E. Gwinn, D. Schultz, S. M. Copp and S. Swasey, Nanomaterials, 2015, 5, 180–207 CrossRef.
- D. Schultz, K. Gardner, S. S. R. Oemrawsingh, N. Markešević, K. Olsson, M. Debord, D. Bouwmeester and E. Gwinn, Adv. Mater., 2013, 25, 2797–2803 CrossRef CAS PubMed.
- R. R. Ramazanov and A. I. Kononov, J. Phys. Chem. C, 2013, 117, 18681–18687 CrossRef CAS.
- I. L. Volkov, Z. V. Reveguk, P. Y. Serdobintsev, R. R. Ramazanov and A. I. Kononov, Nucleic Acids Res., 2018, 46, 3543–3551 CrossRef CAS.
- R. R. Ramazanov, T. S. Sych, Z. V. Reveguk, D. A. Maksimov, A. A. Vdovichev and A. I. Kononov, J. Phys. Chem. Lett., 2016, 7, 3560–3566 CrossRef CAS PubMed.
- J. T. Petty, M. Ganguly, I. J. Rankine, E. J. Baucum, M. J. Gillan, L. E. Eddy, J. C. Léon and J. Müller, J. Phys. Chem. C, 2018, 122, 4670–4680 CrossRef CAS.
- S. M. Swasey, N. Karimova, C. M. Aikens, D. E. Schultz, A. J. Simon and E. G. Gwinn, ACS Nano, 2014, 8, 6883–6892 CrossRef CAS.
- J. Kondo, Y. Tada, T. Dairaku, Y. Hattori, H. Saneyoshi, A. Ono and Y. Tanaka, Nat. Chem., 2017, 9, 956–960 CrossRef CAS.
- D. J. E. Huard, A. Demissie, D. Kim, D. Lewis, R. M. Dickson, J. T. Petty and R. L. Lieberman, J. Am. Chem. Soc., 2018 DOI:10.1021/jacs.8b12203.
- K. A. Afonin, D. Schultz, L. Jaeger, E. Gwinn and B. A. Shapiro, Methods Mol. Biol., 2015, 1297, 59–66 CrossRef CAS PubMed.
- D. Schultz and E. Gwinn, Chem. Commun., 2011, 47, 4715–4717 RSC.
- S. C. Blanchard, H. D. Kim, R. L. Gonzalez, J. D. Puglisi and S. Chu, Proc. Natl. Acad. Sci. U. S. A., 2004, 101, 12893–12898 CrossRef CAS PubMed.
- S. C. Blanchard, R. L. Gonzalez, H. D. Kim, S. Chu and J. D. Puglisi, Nat. Struct. Mol. Biol., 2004, 11, 1008–1014 CrossRef CAS PubMed.
- I. L. Volkov, M. Lindén, J. A. Rivera, K.-W. Ieong, M. Metelev, J. Elf and M. Johansson, Nat. Chem. Biol., 2018, 14, 618 CrossRef CAS PubMed.
- H. Lodish, A. Berk, S. L. Zipursky, P. Matsudaira, D. Baltimore and J. Darnell, Molecular Cell Biology, W. H. Freeman, 4th edn, 2000 Search PubMed.
- R. W. Holley, J. Apgar, G. A. Everett, J. T. Madison, M. Marquisee, S. H. Merrill, J. R. Penswick and A. Zamir, Science, 1965, 147, 1462–1465 CrossRef CAS PubMed.
- J. L. Sussman, S. R. Holbrook, R. W. Warrant, G. M. Church and S. H. Kim, J. Mol. Biol., 1978, 123, 607–630 CrossRef CAS PubMed.
- R. F. Kubin and A. N. Fletcher, J. Lumin., 1982, 27, 455–462 CrossRef.
- I. Díez, R. H. A. Ras, M. I. Kanyuk and A. P. Demchenko, Phys. Chem. Chem. Phys., 2013, 15, 979–985 RSC.
- S. A. Bogh, C. Cerretani, L. Kacenauskaite, M. R. Carro-Temboury and T. Vosch, ACS Omega, 2017, 2, 4657–4664 CrossRef CAS.
- H. Fritzsche and C. Zimmer, Eur. J. Biochem., 1968, 5, 42–44 CrossRef CAS PubMed.
- M. Tsuboi, K. Shuto and S. Higuchi, Bull. Chem. Soc. Jpn., 1968, 41, 1821–1829 CrossRef CAS.
- M. Tsuboi, Appl. Spectrosc. Rev., 1970, 3, 45–90 CrossRef.
- M. C. Chen and G. J. Thomas Jr, Biopolymers, 1974, 13, 615–626 CrossRef CAS PubMed.
- S. Alex and P. Dupuis, Inorg. Chim. Acta, 1989, 157, 271–281 CrossRef CAS.
- E. Taillandier and J. Liquier, Methods Enzymol., 1992, 211, 307–335 CAS.
- K. A. Hartman, Biochim. Biophys. Acta, Nucleic Acids Protein Synth., 1967, 138, 192–195 CrossRef CAS.
- D. E. DiRico, P. B. Keller and K. A. Hartman, Nucleic Acids Res., 1985, 13, 251–260 CrossRef CAS PubMed.
- H. Arakawa, J. F. Neault and H. A. Tajmir-Riahi, Biophys. J., 2001, 81, 1580–1587 CrossRef CAS.
- T. Sato, Y. Kyogoku, S. Higuchi, Y. Mitsui, Y. Iitaka, M. Tsuboi and K. Miura, J. Mol. Biol., 1966, 16, 180–190 CrossRef CAS PubMed.
Footnote |
| † Electronic supplementary information (ESI) available. See DOI: 10.1039/c9na00112c |
| This journal is © The Royal Society of Chemistry 2019 |