
 Open Access Article
 This Open Access Article is licensed under a Creative Commons Attribution-Non Commercial 3.0 Unported Licence
Aggregation-induced heterogeneities in the emission of upconverting nanoparticles at the submicron scale unfolded by hyperspectral microscopy†
Francisco
Gonell‡§
 a,
Alexandre M. P.
Botas‡
b,
Carlos D. S.
Brites
b,
Pedro
Amorós
c,
Luís D.
Carlos
*b,
Beatriz
Julián-López
*a and
Rute A. S.
Ferreira
*b
a,
Alexandre M. P.
Botas‡
b,
Carlos D. S.
Brites
b,
Pedro
Amorós
c,
Luís D.
Carlos
*b,
Beatriz
Julián-López
*a and
Rute A. S.
Ferreira
*b
aInstitute of Advanced Materials (INAM), Universitat Jaume I, Castellón de la Plana 12006, Spain. E-mail: julian@uji.es
bDepartamento de Física and CICECO - Aveiro Institute of Materials, Universidade de Aveiro, 3810-193 Aveiro, Portugal. E-mail: lcarlos@ua.pt; rferreira@ua.pt
cInstitute of Materials Science (ICMUV), University of Valencia, Catedrático José Beltrán 2, 46980 Paterna, Valencia, Spain
First published on 21st May 2019
Abstract
Transparent upconverting hybrid nanocomposites are exciting materials for advanced applications such as 3D displays, nanosensors, solar energy converters, and fluorescence biomarkers. This work presents a simple strategy to disperse upconverting β-NaYF4:Yb3+/Er3+ or Tm3+ nanoparticles into low cost, widely used and easy-to-process polydimethylsiloxane (PDMS)-based organic–inorganic hybrids. The upconverting hybrids were shaped as monoliths, films or powders displaying in the whole volume Tm3+ or Er3+ emissions (in the violet/blue and green/red spectral regions, respectively). For the first time, hyperspectral microscopy allows the identification at the submicron scale of differences in the hybrids' emission colour, due to variations in the relative intensity of the distinct components of the upconversion spectrum. The effect is attributed to the size distribution of the agglomerates of nanoparticles, highlighting the importance of studying the emission at submicron scales, since this effect is not observable in measurements recorded in larger areas.
Introduction
The unique luminescence properties of upconverting NaYF4 nanoparticles (UCNPs) doped with trivalent lanthanide ions1 (Ln3+) have aroused tremendous interest in recent years as light transducers for bioimaging,2–4 therapeutics,5–9 anticounterfeiting,10 photovoltaics,11–13 solar fuels14 or photocatalysis.15 The excitation using NIR radiation, instead of high-energetic UV or visible ones, has emerged as an interesting feature enabling the use of UCNPs in smart and more sustainable technologies, taking advantage of the easy-processing of established deposition/printing techniques that provide low cost, highly transparent, and flexible thin films. Embedding UCNPs into polymer nanocomposites has some definitive advantages and naturally transparent hybrid materials containing the most efficient β-NaYF4:Yb3+/Er3+ or Tm3+ UCNPs have been reported in the last few years for diverse applications.16 Some of the most relevant examples include a general route to obtain poly(methyl methacrylate) (PMMA) containing oleic acid-stabilized UCNPs,17 electrospun upconverting nanofibers for broad photonic applications,18 upconverting organic–inorganic di-ureasil hybrids as promising multimodal spectral converters,19 polyethylene terephthalate embedding upconverting nanorods for biopower applications,20 and polydimethylsiloxane (PDMS) doped with NaYF4:Yb3+/Er3+/Gd3+ nanorods (0.1 wt%) with unique interface properties for 3D image visualization.21PDMS is a widely used silicon-based polymer due to its transparency, low autofluorescence, biocompatibility, water repellence and unique rheological properties. In addition, it is easy to mould nanostructures of PDMS, and they remain flexible when stuck tightly to glass or another substrate. Thus, an outstanding number of applications grounded on PDMS composites are envisaged in areas such as tactile or pressure sensors,22 microheaters obtained by external electric or magnetic driving of PDMS elements doped with metallic particles,23 biosensors in microfluidic systems,24 and photonic micromembranes.25 Nonetheless, highly transparent PDMS nanocomposites incorporating UCNPs are not easy to produce due to the light scattering from undesired aggregates, with UCNPs' surface modification usually being required.26
Looking ahead for applications of UCNPs in smart optical technologies a good match of the refractive indices between polymer and NPs is necessary. Though the refractive index value of PDMS (∼1.4)27 is close to that of β-NaYF4:20%Er3+ (∼1.52),28 some engineering must be done. One strategy to increase the PDMS' refractive index is to include inorganic nano-oxides with a higher refractive index such as, for instance, ZrO2,29 TiO2,30 Ta2O5,31 and Nb2O5,32 however, at the cost of undesired phase segregation and light scattering.
To overcome these drawbacks, and taking into account our previous experience in PDMS hybrids cross-linked with MxOy nanoclusters,33–35 this work presents a simple strategy to prepare transparent PDMS nanocomposites embedding UCNPs with tailorable mechanical, thermal, optical and hydrophobic properties by modifying the nature of the cross-linking metal M (M = Ti, Zr, Nb and Ta). The PDMS based-nanocomposites described herein have efficient emission in the blue, green and red spectral regions upon excitation at 980 nm. They can be applied in the technological fields requiring UCNPs with long-term stability, such as NIR-pumped 3D displays, active optical fibres, etc. Moreover, this is one of the few transparent hybrid materials with blue upconversion emission that have been reported so far.21,36
In a step forward in comparison with previous reports, nano-oxide domains are generated in situ during the PDMS polymerization from molecular precursors. Using this strategy, the domains exhibit amorphous nature (and therefore have no optical interaction with active upconverting species) and are randomly distributed at the nanoscale level, maximizing the chemical compatibility and dispersibility of the UCNPs in the PDMS matrix. In addition, the mild conditions of the sol–gel procedure provide considerable versatility in terms of composition and physicochemical properties and in shaping as bulk materials, fibres or films.
To evaluate the homogeneity of the spectral properties of the PDMS based-nanocomposites at the submicron scale we use hyperspectral microscopy that allows us to detect spatial changes in the intensity ratio of the Er3+ transitions in the green (4S3/2 → 4I15/2) and red (4F9/2 → 4I15/2) spectral ranges. Interestingly, the UCNPs' emission spectra depend on the UCNP aggregate's dimensions revealing a more intense green emission as the aggregate dimensions decrease. Puzzlingly, the measurements in large collection areas do not allow us to observe these heterogeneities, demonstrating the potential of hyperspectral microscopy for spatially resolved spectroscopic analysis, when compared with conventional spectrofluorometers that perform measurements in much wider areas (up to nine orders of magnitude).
Hyperspectral microscopy is a technique that can be used to simultaneously obtain spectral and spatial information by combining spectroscopy with optical microscopy.37,38 Such a combination allows us to capture images with a spectral resolution of up to 2.73 nm in a spectral range of 400–1000 nm with a spatial resolution in the submicron scale. Hyperspectral imaging showed successful applications in remote sensing of the Earth,39 food control,40 identification of materials' phases at the micro- and nano-scales,38 and safety/security, by detecting variations in the blood oxygenation of the face and hands, which are used to detect emotional stress signals in potential criminals.41,42
The relevance of hyperspectral imaging for mapping at the submicron scale has been described in a few reports focused on biomedical applications, such as cellular uptake monitoring of bioimaging agents43–47 and identification of pathogens and cancerous cells.48–52 In these examples, the spectral profile results from light reflectance measurements. The combination of hyperspectral microscopy with emission properties is even less explored and, as far as we know, only two examples published by some of us can be found. One refers to down-shifting Si-based NPs whose emission in the red spectral range combined with hyperspectral analysis was used to discuss film homogeneity at the submicron scale53 and the other example explores hyperspectral microscopy within MG-63 cells in which the emission arising from UCNPs enabled the monitoring of cellular uptake in lanthanide-based NPs.54
Experimental
Synthesis of the UCNPs
NaYF4 NPs doped with 20 molar% of Yb3+ ions and 2 molar% of Er3+ or Tm3+ ions were synthesized through thermal decomposition, according to the procedure reported by Yi et al.55 Typically, 10−2 mol of NaCF3COO and 5 × 10⁻³ mol of Ln(CH3COO)3 (Ln = Y, Yb, Er or Tm) were mixed together with 50 mL of oleylamine and were added to a three-necked flask. The mixture was then heated under vacuum at 373 K for 45 minutes forming a transparent and yellow solution. The reaction flask was flushed with Ar for 5 minutes and heated at 613 K. After 2 hours of reaction under Ar flow and vigorous magnetic stirring, the solution was cooled down. The resultant UCNPs were isolated by adding ethanol followed by centrifugation. The UCNPs were then redispersed in cyclohexane at a concentration of 1 mg mL−1. Fig. S1-ESI† shows the X-ray diffraction (XRD) patterns of the as-synthesized NaYF4:Yb3+/Er3+ and NaYF4:Yb3+/Tm3+ UCNPs. The samples crystallized in the optically efficient hexagonal polymorph β-NaYF4, in agreement with the International Centre for Diffraction Data (ICDD) database (Nr 28-1192). The enhanced (100) and diminished (002) reflections are characteristic of a spherical morphology or nanorods.56 Inductively coupled plasma mass spectrometry (ICP-MS) was used to quantify the average composition of UCNPs indicating molar percentages of 1.95% (Er), 18.07% (Yb) and 79.98% (Y), which are in good agreement with the stoichiometry (2%, 20% and 78%, respectively).Synthesis of the UCNPs/PDMS–MxOy nanocomposites
All reactants and solvents were used as received without further purification. Dimethyldiethoxysilane (DEDMS, 98%), zirconium isopropoxide (Zr(OPri)4), titanium isopropoxide (Ti(OPri)4), tantalum ethoxide (Ta(OEt)5) and niobium ethoxide (Nb(OEt)5) were purchased from Sigma-Aldrich. Ethanol and cyclohexane were obtained from Scharlab.In a typical synthesis, 0.250 mL of the UCNP suspension in cyclohexane was added to a pre-hydrolyzed DEDMS solution (DEDMS![[thin space (1/6-em)]](https://www.rsc.org/images/entities/char_2009.gif) :H2O:EtOH in a 1:1:1 molar ratio, acidified with HCl at pH = 1, and 30 minutes of hydrolysis). Then, an appropriate amount of the metal alkoxide (M = Ta, Nb, Ti and Zr) was added. The M:Si molar ratio was fixed at 1:4. After 30 minutes of stirring, the sol was sonicated for 5 minutes.
:H2O:EtOH in a 1:1:1 molar ratio, acidified with HCl at pH = 1, and 30 minutes of hydrolysis). Then, an appropriate amount of the metal alkoxide (M = Ta, Nb, Ti and Zr) was added. The M:Si molar ratio was fixed at 1:4. After 30 minutes of stirring, the sol was sonicated for 5 minutes.
For the preparation of monoliths, 2.2 mL of sol was poured into polyethylene round vials (Kartell) and left to dry at 308 K for one week. The final monoliths were cylinders of about 20 mm diameter and 1.5 mm high.
Thin films of around 450 nm thickness were prepared by spin coating on a glass substrate. The nanocomposite made of PDMS–MxOy containing Yb3+/Er3+- or Yb3+/Tm3+-doped UCNPs are referred to in the manuscript as HyTa, HyNb, HyTi and HyZr, followed by the active ions (Yb3+/Er3+ or Yb3+/Er3+).
Instrumental techniques
XRD patterns of the synthesized powder samples were collected on a Siemens D5000 diffractometer with CuKα radiation at 1.5406 Å, in the 2θ range 10.00–80.00° with a 0.05° step size and an acquisition time per step of 1.5 s, in the reflection scanning mode. The reference data were collected from ICDD database.ICP-MS analysis was performed using an Agilent 7500cx quadrupole ICP-MS mass spectrometer. The liquid samples were prepared by dissolving the UCNPs into hot nitric acid.
High resolution transmission electron microscopy (HRTEM) images were collected using a JEOL 2100 LaB6 microscope at an accelerating voltage of 200 kV, coupled with an Inca Energy TEM 200 (Oxford) X-ray energy dispersive spectrometer (XEDS). The UCNPs were dispersed in ethanol and deposited onto carbon coated Cu grids. The monolithic samples were directly sectioned with a Powertome XL (RMC) microtome. Microtome sections of 90–150 nm thickness were collected over carbon coated Cu grids for observation. Structural analysis of the recorded images was performed by using the Digital Micrograph 3.4.3 suite from Gatan.57
Scanning-transmission mode (STEM) analysis was performed on a JEOL-JEM-2010F microscope with a LaB6 electron gun operated at 200 kV using a high angle annular dark field detector which allows Z-contrast imaging. EDS spectra were collected with an EDS X-Max 80 from Oxford Instruments. In this case, the samples were deposited onto carbon-coated gold grids in order to avoid overlapping of energy lines with erbium and ytterbium elements.
Thin-film thicknesses were measured using a Dektak 6M stylus profiler.
The absorption spectra were recorded in the UV/visible/NIR spectral regions (200–1100 nm) on a Cary 5000 Varian spectrophotometer.
The conventional (optical) microscopy images were recorded using an Olympus BX51 bright field microscope (100× objective), in reflection mode, equipped with a digital CCD camera (Retiga 4000R, QImaging) used to capture optical microphotographs of the samples. The upconversion emission colour coordinates (x,y) were calculated accordingly to the Commission Internationale de L'Éclairage (CIE) chromaticity standards defined for the 2° observer.
The hyperspectral images were recorded using a hyperspectral imaging system from CytoViva, coupled to an Olympus BX51 microscope, that includes a digital camera (Pixelfly USB, PCO) coupled to a spectrograph (V10E 2/3′′, Specim, 30 μm slit, nominal spectral range of 400–1000 nm and nominal spectral resolution of 2.73 nm). Both optical and hyperspectral images were recorded in bright-field reflection mode, under irradiation from a 980 nm CW NIR laser diode (PSU-H-LED, CNI Lasers) excitation. Each pixel field-of-view on the hyperspectral images corresponds to 129 × 129 nm2 on the samples' plane. The hyperspectral scanning is vertical and each image results from 696 lines, using 5 s exposure time per line. All the hyperspectral data were acquired and analysed using ENVI 4.8 software. The hyperspectral image pseudocolor is based on the intensity of the Er3+ upconversion emission (not normalised to the Er3+ concentration thus, a quantitative assessment of the performance cannot be inferred).
The room-temperature upconversion spectra were recorded using a Fluorolog-3 Horiba Scientific (Model FL3-2T) spectrofluorometer, with a TRIAX 320 single-emission monochromator (fitted with a 1200 grooves mm−1 grating blazed at 500 nm) coupled to a R928 Hamamatsu photomultiplier. In order to calculate the temperature uncertainty, 40 consecutive emission spectra using two different integration times (0.2 and 0.5 s) were acquired. The spectra were corrected for the detection and optical spectral response of the spectrofluorometer.
The emission spectral radiant flux, or spectral radiant power, (S(λ), W nm−1) were measured using an integrating sphere (ISP 150L-131, Instrument Systems). All the spectra were acquired with a resolution of 0.1 nm, 0.2 s integration time and 5 averaged spectral scans. The integrating sphere (BaSO4 coating) has an internal diameter of 150 mm and was coupled to an array spectrometer (MAS-40, Instrument Systems). The measurements have an accuracy within 5%, according to the manufacturer. A customized optical fibre (SarSpec, 0.6 mm core diameter with an adaptable-length ferrule) guides a CW infrared laser diode (PSU-H-LED, CNI Lasers).
Laser powers (P, W) were measured with a thermal power sensor (ThorLabs, thermopile-S310C) coupled to an optical power and energy meter (Thorlabs, PM100D). The power measurements present a 5% relative error, accordingly to the manufacturer.
The emission quantum yield, q = Nem/Nabs, defined as the ratio between the number of emitted (Nem) and absorbed (Nabs) photons, was calculated from the measured spectral flux as:58

Results and discussion
The HRTEM images confirm the formation of well-crystallized fluoride NPs with a rounded morphology and particle size distribution centred at 23 ± 5 nm, as illustrated for the NaYF4:Yb3+/Er3+ NPs in Fig. 1A and B. The presence of the hexagonal β-phase was corroborated by XRD (Fig. S1-ESI†). The analysis of the sample by STEM-EDS did not detect any clustering of Er and/or Yb elements, in good agreement with compositional homogeneity of UCNPs (Fig. S2-ESI†).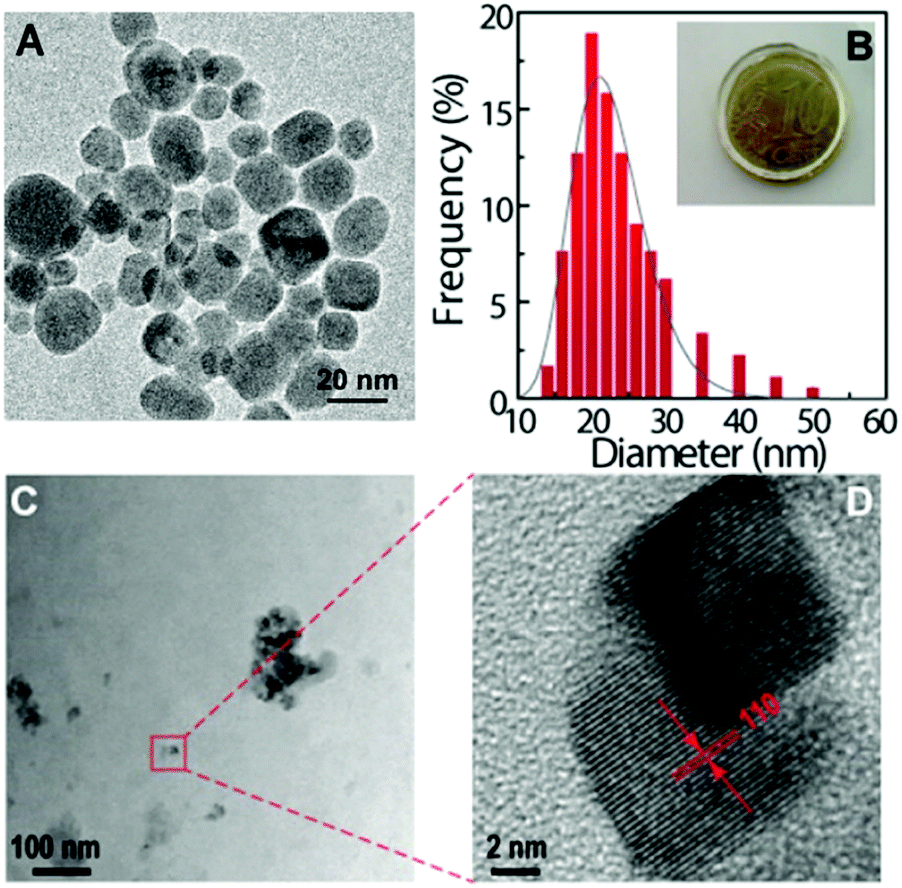 | ||
| Fig. 1 (A) HRTEM image of the NaYF4:Yb3+/Er3+ UCNPs. (B) Particle size distribution obtained from analysis of the HRTEM images. The solid line is the best fit to a log-normal distribution with a diameter of 23 ± 5 nm. The inset shows a digital photograph of the HyTa–Yb3+/Er3+ hybrid. (C and D) HRTEM images of the HyTa–Yb3+/Er3+ hybrid at different magnifications. The interplanar distance marked corresponds to 0.30 nm. | ||
The absolute q values were quantified for a suspension of NaYF4:Yb3+/Er3+ dispersed in cyclohexane (5.13 g L−1) under 980 nm excitation. The spectral power density could only be detected by the setup using high excitation power, 1.84 W, that is indicative of the further improvement in the synthesis that may lead to a higher upconversion efficiency of the UCNPs. The integration of the emitted photon spectral density in the 500–700 nm range, results in q = 0.041 ± 0.006. This value is similar to those reported in the literature for UCNPs,59 between 0.005 and 0.10 for NaYF4:Yb3+/Er3+ UCNPs of 8–30 nm diameter. The setup used does not permit to measure the emitted spectral power density for all the other samples (remains below the detection limits) and thus the corresponding q values were not quantified.
The incorporation of UCNPs within the hybrid matrices (HyTi, HyZr, HyNb and HyTa) did not affect the transparency of the PDMS–MxOy host. The inset of Fig. 1B shows a picture of one of the UCNPs/PDMS–MxOy hybrid samples (HyTa). Fig. 1C and D show that the UCNPs are crystalline and exhibit the interplanar distances associated with the hexagonal polymorph. The UCNPs are randomly distributed within the hybrid matrix forming aggregates with a large distribution in size of the order of 102 nm (corresponding in average to ∼5 UCNPs). The UCNPs' spatial distribution observed in Fig. 1C reflects the good stability of the colloidal precursor sol that endures the gelation process. Moreover, we concluded that the addition of cyclohexane-dispersed UCNPs in the reaction medium did not significantly affect the hydrolysis and condensation mechanisms of the metalorganic precursors, as far as no segregation of undesired metal oxide domains (MxOy, where M = Ti, Zr, Nb and Ta) are perceptible. Thus, one can assume that the structural arrangement of PDMS units and of the metal oxide domains is similar to that previously reported,33–35 indicating that the presence of fluoride NPs does not significantly change the hybrid's-local structure.
The transparency of the UCNPs/PDMS–MxOy hybrid monoliths is unequivocally confirmed by the absorption spectra (Fig. S3-ESI†) that show negligible absorption in the visible range after particles' incorporation. Taking into account the fact that the absorption edge reported in the literature for pure PDMS is about 200 nm,60 an important shift towards longer wavelengths is observed when the amorphous MxOy nanodomains are included within the siloxane network. This shift has been previously attributed to O → M charge transfer and the position of the band depends on the chemical nature of the M–O bonds and the size of the MxOy nanodomains.34,61 The absorption spectra of NaYF4:Yb3+/Er3+ and NaYF4:Yb3+/Tm3+ powders exhibit the typical intra-4f transitions (shown in Fig. S3A-ESI†), but the low concentration of UCNPs in the hybrids does not allow to detect these bands in the corresponding absorption spectra.
As illustrated in Fig. S4-ESI,† both the NaYF4:Yb3+/Er3+ and NaYF4:Yb3+/Tm3+ cyclohexane suspensions of UCNPs and the hybrid monoliths show efficient upconversion emission in the green (2H11/2 → 4I15/2 and 4S3/2 → 4I15/2 transitions, Er3+) and blue region (1G4 → 3H6 transition, Tm3+) through the Yb3+ absorption at 980 nm (2F7/2 → 2F5/2 transition).
Under 980 nm excitation, the Tm3+-doped UCNPs exhibit strong upconversion emissions dominated by the blue band at around 475 nm (1G4 → 3H6, Fig. 2A). The emission spectra of the HyM:Yb3+/Tm3+ hybrids (Fig. 2B) well reproduce the profile of the corresponding UCNPs. A slight increase in the blue emission is observed in the case of the PDMS composite material, in comparison with that of the pure UCNPs, demonstrating the ability of this host matrix to efficiently disperse the NPs. It is interesting to note the red Tm3+-emission which is known to be favoured by energy transfer mechanisms involving multiphonon non-radiative relaxation processes. It is also remarkable the increased intensity of the 1D2 → 3H6 band centred at 360 nm, particularly for the HyTa hybrid host.
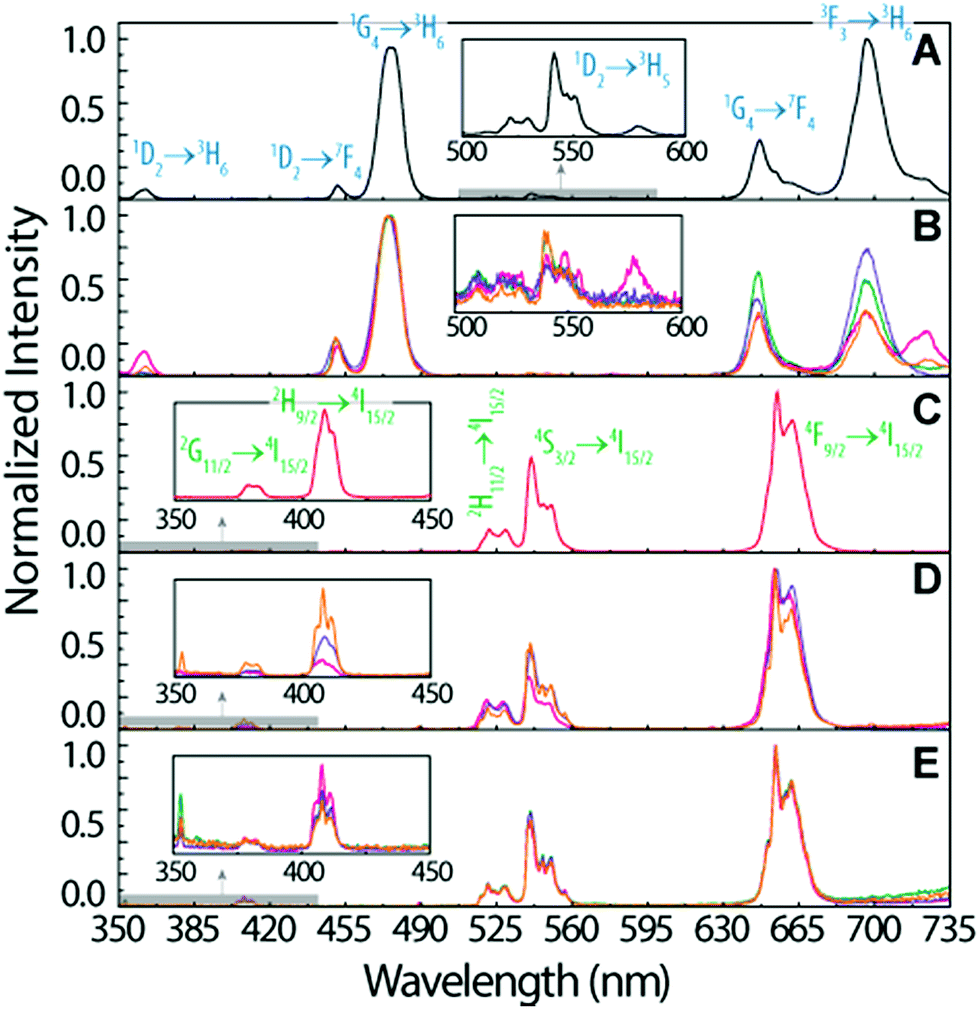 | ||
| Fig. 2 Room temperature upconversion emission spectra of (A) NaYF4:Yb3+/Tm3+ UCNPs under 980 nm excitation (15.9 W cm−2), (B) monoliths of (green) HyNb–Yb3+/Tm3+, (pink) HyTa–Yb3+/Tm3+, (violet) HyZr–Yb3+/Tm3+ and (orange) HyTi–Yb3+/Tm3+ (297.5 W cm−2); (C) NaYF4:Yb3+/Er3+ UCNPs (29.5 W cm−2); (D) HyTa–Yb3+/Er3+ processed as a (violet) monolith, (orange) film and (pink) ground monolith (128.5 W cm−2); (E) films of (green) HyNb–Yb3+/Er3+, (pink) HyTa–Yb3+/Er3+, (violet) HyZr–Yb3+/Er3+ and (orange) HyTi–Yb3+/Er3+ (128.5 W cm−2). The Tm3+ and Er3+ transitions are identified in (A and C), respectively. | ||
Fig. 2C shows the emission of NaYF4:Yb3+/Er3+ UCNPs exhibiting the characteristic 2H11/2, 4S3/2 → 4I15/2 and 4F9/2 → 4I15/2 Er3+ transitions, in the green and red spectral regions, respectively. Low relative-intensity transitions in the blue spectral region arising from the 2G11/2 and 2H9/2 levels are also observed (inset in Fig. 2C). After the nanoparticles' incorporation into the hybrid materials, no significant changes were observed in the energy, the number of Stark components and the full-width at half maximum of their corresponding spectra, as illustrated in Fig. 2D. However, when comparing the emission spectra arising from the monolith samples with that from the films, an increase in the blue band intensity (2H9/2,2G11/2 → 4I15/2 transitions) and a slight decrease of the 2H11/2 → 4I15/2 and 4F9/2 → 4I15/2 transitions are observed (Fig. 2E). In the case of the ground monolith, a decrease of the 4S3/2 → 4I15/2 transition is detected instead. These trends occur similarly in the four hybrid nanocomposites (Fig. S5-ESI†).
The upconversion emission spectra of the four HyM–Yb3+/Er3+ (M: Ti, Zr, Nb and Ta) films are shown in Fig. 2E. A careful analysis of the spectra profiles reveals small differences in the intensity of the bands, particularly in the emissions in the blue and green spectral regions, probably associated with minor modifications of the local distribution of the UCNPs in the nanocomposites. This behaviour also occurs in the monoliths and ground samples (Figs. S6-ESI†). The similar emission profiles show that, unlike other features such as hydrophobicity, mechanical properties and refractive index that can be tuned by changing the inorganic MxOy constituents,62–64 the upconversion process is quite insensitive to the metal M used in the hybrid. This is an important point for the usage of these materials since it means that the emission properties will remain invariable; meanwhile other properties can be adjusted by modifying the hybrid's composition.
The number of photons involved in upconversion was determined from the power-like relationship between the excitation intensity, Iexc, and the emitted integrated power, Pemi, expressed as Pemi ∝ IexcN (details in the ESI†).2 The measurements performed in HyTa–Yb3+/Er3+ UCNPs and HyZr–Yb3+/Er3+, HyTi–Yb3+/Er3+ and HyNb–Yb3+/Er3+ hybrids show that the emissions in the red and green spectral regions result from a two-photon upconversion process. In the pristine Yb3+/Tm3+ UCNPs, however, the emissions in the blue and red spectral regions were ascribed to a three-photon process but the power dependence decreases to values around 2 in the hybrids. This phenomenon could be related to partial absorption of the exciting radiation by the matrix, thus reducing the effective power absorbed by the NPs.
To infer the upconversion emission distribution among the hybrid nanocomposites, the monoliths' surface was analysed using hyperspectral microscopy under NIR (980 nm) laser irradiation. The technique allows measuring the spectra from areas much smaller than the one in conventional spectrofluorometers (Fig. 2D and E). The smallest area measured in hyperspectral microscopy, corresponds to 1.66 × 10⁴ nm2 (a single pixel), while a conventional spectrofluorometer measures the emission from an area of ∼1013 nm2. As an illustrative example, we selected the HyTa–Yb3+/Er3+ monolith due to the higher UC quantum yield of the NaYF4:Yb3+/Er3+ nanoparticles, compared with that found for the other samples, that render the subsequent analysis easier. Fig. 3A shows a series of spherical bright spots with diameter values in the range 102 to 103 nm which, as detailed below, are related to UCNP aggregates of distinct sizes, as determined by HRTEM (Fig. 1). Nevertheless, we note that the contribution of the scattering and guidance of the emitted photons from the UCNPS for the larger bright spots cannot be excluded.
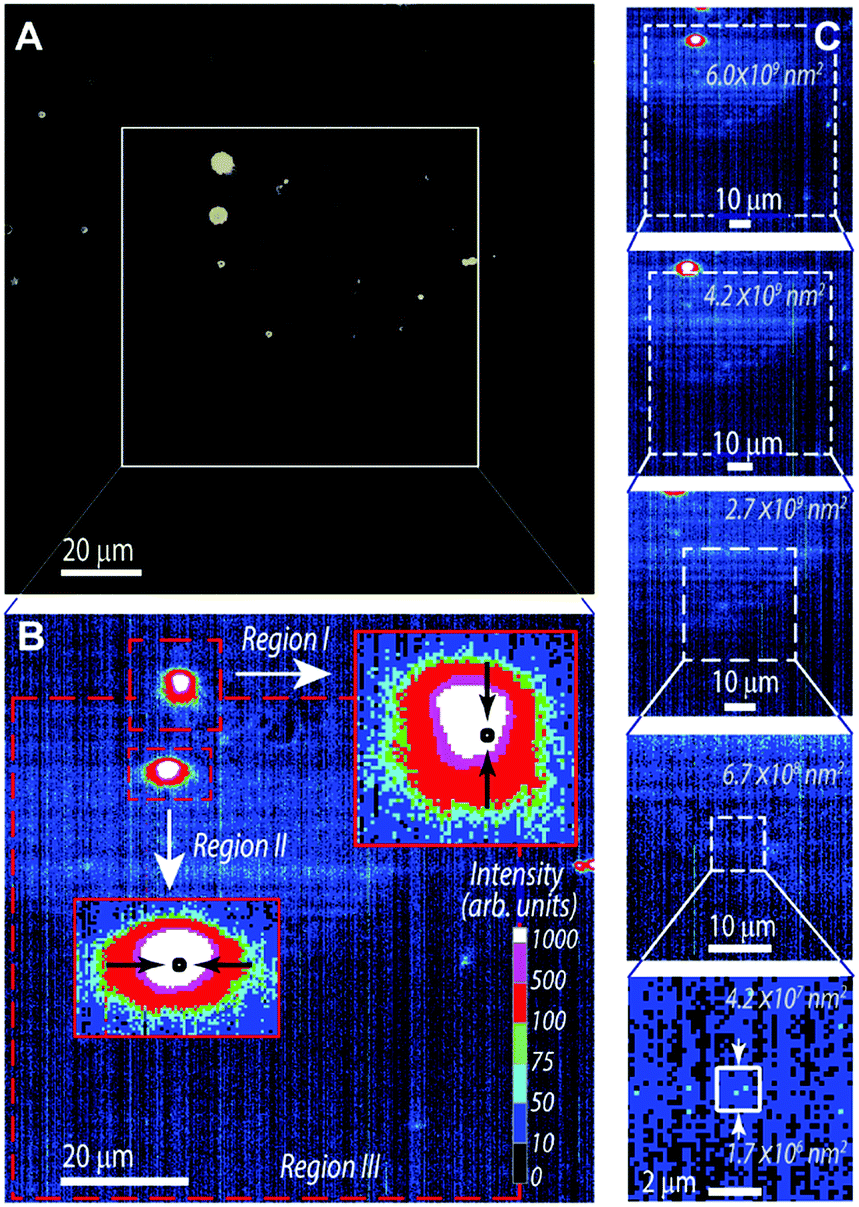 | ||
| Fig. 3 (A) Optical and (B) hyperspectral microscopy images (of the area marked in (A)) of HyTa–Yb3+/Er3+ processed as a monolith under 980 nm CW laser irradiation at room temperature. In (A), the yellow colour arises from the UC emission with CIE colour coordinates in the yellow-green spectral region (036, 0.56). In (B), the colour scale is based on the emitted intensity at 656 nm and the magnifications of region I and region II presented as insets. (C) Distinct areas of region III (marked in B) used to collect the emission spectra. | ||
To further characterize these bright spots, hyperspectral microscopy was performed in a selected region (marked with a red dashed rectangle in Fig. 3A). The hyperspectral image (Fig. 3B) reveals brighter regions around the spherical spots observed in the optical image, whose spectral analysis show the 4F9/2 → 4I15/2 and 4S3/2 → 4I15/2 Er3+ radiative upconversion transitions, Fig. 4A and B. This observation unequivocally demonstrates that the bright spots in Fig. 3A correspond to aggregates of NaYF4:Yb3+/Er3+ UCNPs.
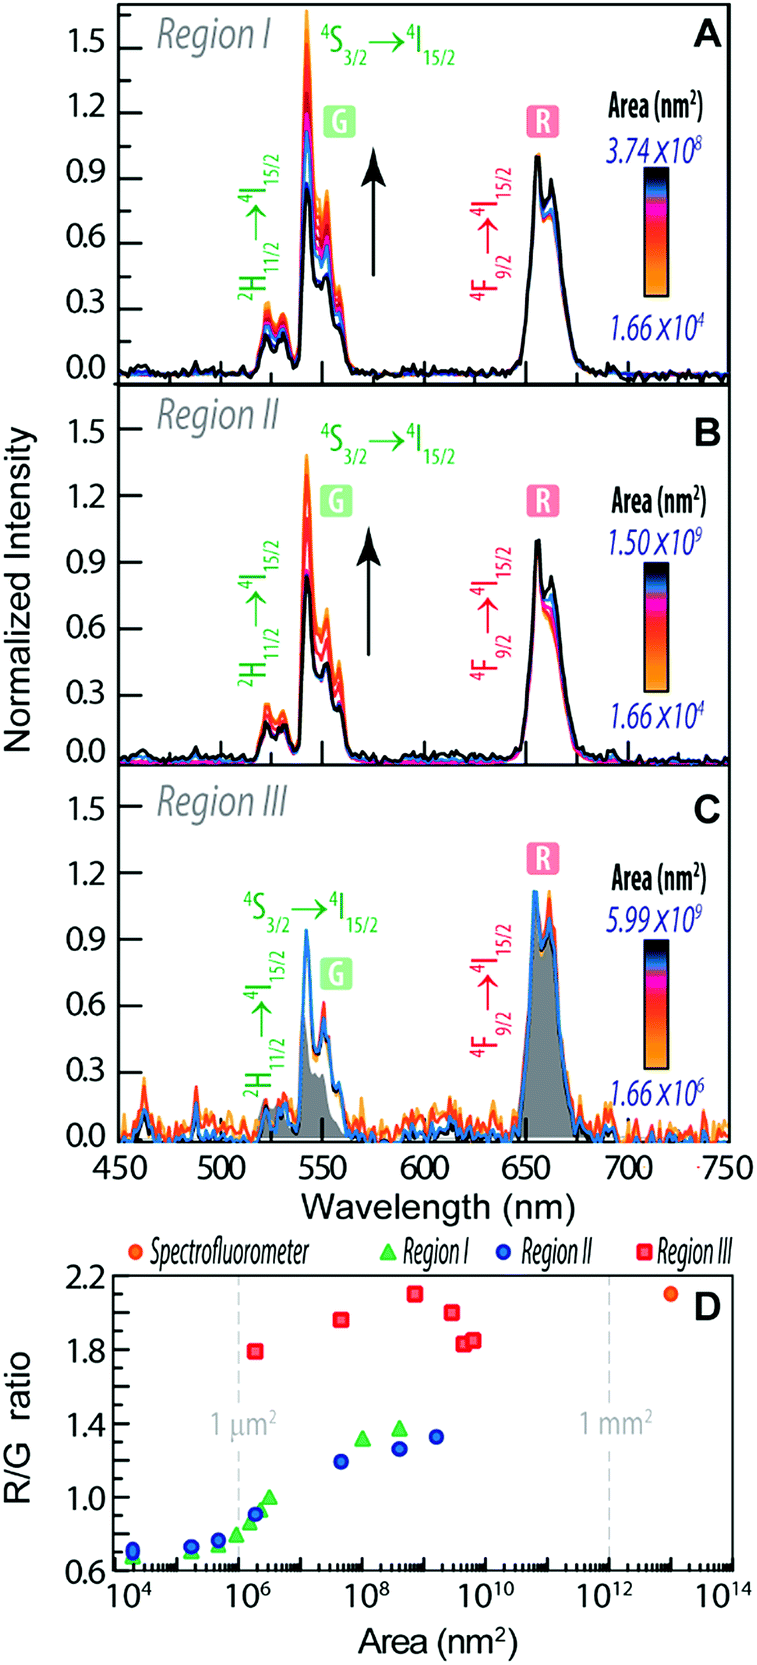 | ||
| Fig. 4 Emission spectra using distinct collection areas of (A) region I, (B) region II and (C) region III of Fig. 3B. The grey shaded area corresponds to the emission spectra measured on the spectrofluorometer (collection area of 1013 nm2) (D). R/G ratio as a function of the area of the measurement in the distinct regions. | ||
The emission spectra were measured as a function of the area, as illustrated for the two selected aggregates (region I and region II, Fig. 3B).
We notice that, independent of the collection area, the emission spectra are remarkably different from that acquired with the spectrofluorometer (Fig. 2D), in particular in what concerns the relative intensity of the red 4F9/2 → 4I15/2 and green 4S3/2 → 4I15/2 transitions, despite the analogous energy and number of Stark components, which readily indicates that all the Er3+ ions occupy the same average local environment as the sample. For the spectrum acquired using the spectrofluorometer, the relative red/green (R/G) intensity ratio is around 2.1 for a collection area of ∼1013 nm2 (Fig. 4D). The spectra measured using hyperspectral analysis reveal that the 4S3/2 → 4I15/2 transition dominates the spectra until the collection area is ∼107 nm2. At larger collection areas that include both the cluster and adjacent regions, the 4F9/2 → 4I15/2 transition becomes the more intense one. The variation of the R/G ratio for the aggregates (with the size in the range 102 to 103 nm) is shown in Fig. 4D. These results show inhomogeneities at the micrometre scale for the relative intensity of the 4F9/2 → 4I15/2 and 4S3/2 → 4I15/2 transitions, although the barycentre energies and number of Stark components are constant. In particular, the emission collected from the core of the cluster is clearly dominated by the 4S3/2 → 4I15/2 transition.
Further indications of this spectral intensity non-homogeneity may be found by collecting the hyperspectral images in a region in which no evidence of aggregation is observed or in which its relative contribution is negligible (region III, Fig. 4D). The spectra measured under these conditions (outside the bright spots) also present the 4F9/2 → 4I15/2 and 4S3/2 → 4I15/2 Er3+ upconversion transitions, which indicates that besides the region that corresponds to the bright spots, the NaYF4:Yb3+/Er3+ UCNPs were incorporated in other regions of the monolith as smaller luminescent aggregates. Scanning region III as a function of the collection area (∼106 to 1010 nm2), we notice that the 4F9/2 → 4I15/2 transition dominates the spectra, similar to that found using the spectrofluorometer (Fig. 4C). Also, the R/G ratio is analogous to that found in later measurements (Fig. 4D).
The variation of the R/G ratio in NaYF4:Yb3+/Er3+ UCNPs is a phenomenon that has already been reported.65–74 In particular, for NaYF4:Yb3+/Er3+ NPs modified by the presence of Au NPs67 and rhodamine-B,69 a decrease of the R/G ratio (due to the increase of the relative intensity of the 4S3/2 → 4I15/2 transition) is observed, whereas in the presence of the S-0378 dye the opposite trend is observed, as the 4F9/2 → 4I15/2 transition is enhanced.69 This latter behaviour is also seen when the Yb3+ relative amount is enhanced.65,66 We note, however, that none of those aspects occur in the present case.
Among these studies that discuss the phenomena behind the variation of the R/G ratio, three main mechanisms are proposed (Fig. 5). The first mechanism involves the modulation of the excitation source by changing the excitation frequency or the pulse width68,71,73 and is based on the fact that the 4F9/2 excited state can be populated by energy transfer from a nearby Yb3+ (path i, Fig. 5). The 4F9/2 → 4I15/2 transition is maximized by populating the 4F9/2, while limiting the excitation of the 4F7/2 level, induced by repeating the excitation when the population of 4I13/2 has peaked from the previous excitation pulse.68 The second mechanism is the multiphonon relaxation (path ii, Fig. 5), that populates the 4F9/2 state due to relaxation from 2H11/2/4S3/2 levels (the energy gap between 2H11/2/4S3/2 and 4F9/2 is ∼3200 cm−1). The relaxation is more effective with the increase of the OH groups at the surface of the NPs that generate high-energy vibrational modes at 3200–3600 cm−1.70 The last mechanism is the cross relaxation between Er3+ ions (path iii, Fig. 5) contributing to the emission of NaYF4:Yb3+/Er3+ NPs with high Er3+ and Yb3+ concentrations in the red spectral region.66,72
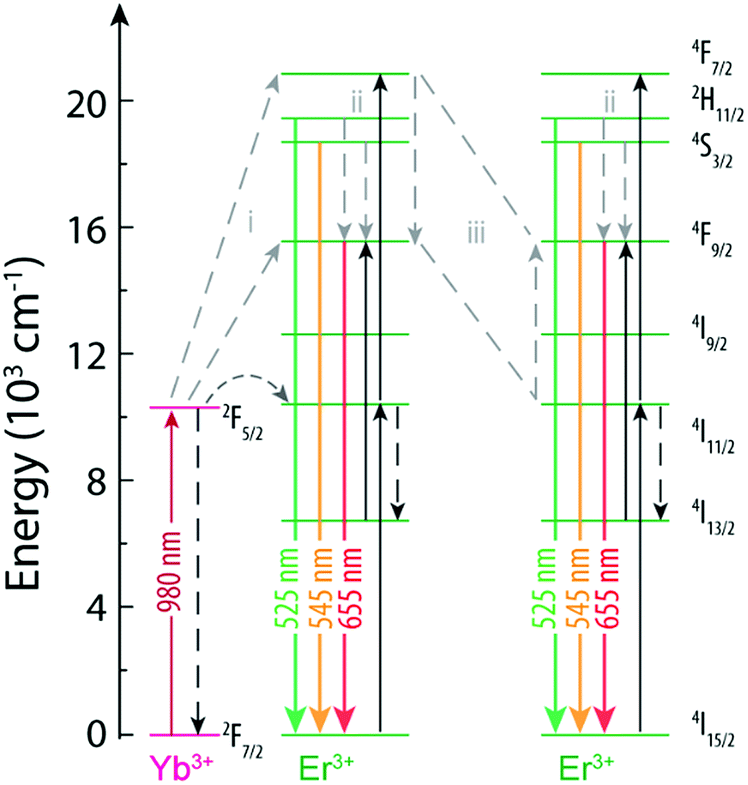 | ||
| Fig. 5 Partial energy level diagram of Yb3+ and Er3+ in NaYF4:Yb3+/Er3+ NPs.68 The mechanisms proposed in the literature as being responsible for the variation of the R/G ratio are shown. | ||
A study about β-NaYF4:Yb3+/Er3+ and α-NaYF4:Yb3+/Er3+ UCNPs in solution reports a dependence of the R/G ratio on the size of the NPs.65 For a power density of 1.22 W cm−2 the decrease of the size of α-NaYF4:Yb3+/Er3+ NPs from 13.7 nm to 5.2 nm leads to an increase of the R/G ratio. This is attributed to a larger number of Er3+ ions at the surface for smaller NPs and so the Er3+ ions are closer to defects, surface states, ligands and impurities that can quench the Er3+ emission. The R/G ratio of β-NaYF4:Yb3+/Er3+ NPs also increases when the sizes decreases from 72.1 nm to 20.2 nm.65 The increase of the R/G ratio with the decrease of the NP size is due to the increase of the surface/volume ratio for smaller NPs and it is the same effect that we observe in this work. The increase of the surface/volume and the consequent increase of the R/G ratio may be, thus, ascribed to the lower level of aggregation of the NPs and not due to the variations in the size of the NPs.
Conclusions
In this work, highly transparent and upconverting PDMS–MxOy nanocomposites (M: Ti, Zr, Nb and Ta) emitting in the red, green and blue spectral regions were successfully prepared. The strategy of dispersing NaYF4:Yb3+/Er3+ and NaYF4:Yb3+/Tm3+ UCNPs in these organic–inorganic hybrid matrices provides a new family of tuneable materials in terms of composition (by varying the nature of MxOy) and their associated properties (refractive index, mechanical properties, hydrophilic character, etc.).The hyperspectral analysis at the submicron scale of the illustrative HyTa–Yb3+/Er3+ example under 980 nm excitation unveiled aggregation-induced heterogeneities in the upconversion emission, undoubtedly signalled by changes in the intensity of the 2H11/2, 4S3/2 → 4I15/2 (G) transition relative to that of the 4F9/2 → 4I15/2 (R) one. We univocally assign higher R/G ratios to imaged regions corresponding to agglomerates of the upconverting nanoparticles, in comparison to the regions in which the particles are less aggregated. To the best of our knowledge, this is the first time variations in the R/G ratio in different regions of the same sample are detected, changing the spatial resolution of the detected region. This is only possible by performing hyperspectral microscopy at the submicron scale, highlighting the advantage of using this tool in comparison with conventional spectroscopic techniques. Indeed, hyperspectral microscopy enabled the quantitative analysis of inhomogeneities in the sample emission at the submicrometric scale, that are completely indiscernible using the spectrofluorometer, demonstrating the enormous potential of studying of the emission properties of the materials at such spatial scales.
This work opens the possibility of using the UCNPs' emission to infer modifications on their local environment imposed by external stimuli, such as temperature or pressure, converting the UCNP-embedding nanocomposites into sensors operating at the nanoscale.
Conflicts of interest
There are no conflicts to declare.Acknowledgements
This work was developed within the scope of the project CICECO-Aveiro Institute of Materials, POCI-01-0145-FEDER-007679 (FCT Ref. UID/CTM/50011/2019) financed by Portuguese funds through the Fundação para a Ciência e a Tecnologia/Ministério da Educação e Ciência and when appropriate co-financed by FEDER under the PT2020 Partnership Agreement. This work was also supported by Spanish Government (MINECO, project MAT2015-64139-C4-2-R) and Universitat Jaume I (UJI-B2018-71 project). The support provided by the Portuguese and Spanish governments (bilateral actions Ref. E92 and PRI-AIBPT2011-1010), and MAT2011-27008 project is also acknowledged. CDSB and AMPB acknowledge their grants financed by the SusPhotoSolutions project CENTRO-01-0145-FEDER-000005. SCIC from Universitat Jaume I and Electron Microscopy Service from Universitat Politècnica of Valencia are also acknowledged for instrumental facilities.Notes and references
- M. Haase and H. Schäfer, Angew. Chem., Int. Ed., 2011, 50, 5808–5829 CrossRef CAS.
- G. Chen, T. Y. Ohulchanskyy, R. Kumar, H. Ågren and P. N. Prasad, ACS Nano, 2010, 4, 3163–3168 CrossRef CAS PubMed.
- G. Y. Chen, J. Shen, T. Y. Ohulchanskyy, N. J. Patel, A. Kutikov, Z. P. Li, J. Song, R. K. Pandey, H. Agreen, P. N. Prasad and G. Han, ACS Nano, 2012, 6, 8280–8287 CrossRef CAS PubMed.
- J. Zhou, Z. Liu and F. Li, Chem. Soc. Rev., 2012, 41, 1323–1349 RSC.
- P. Zhang, W. Steelant, M. Kumar and M. Scholfield, J. Am. Chem. Soc., 2007, 129, 4526–4527 CrossRef CAS.
- D. Bechet, P. Couleaud, C. Frochot, M. L. Viriot, F. Guillemin and M. Barberi-Heyob, Trends Biotechnol., 2008, 26, 612–621 CrossRef CAS.
- F. Wang, D. Banerjee, Y. Liu, X. Chen and X. Liu, Analyst, 2010, 135, 1839–1854 RSC.
- N. M. Idris, M. K. Gnanasammandhan, J. Zhang, P. C. Ho, R. Mahendran and Y. Zhang, Nat. Med., 2012, 18, 1580–1585 CrossRef CAS PubMed.
- A. Bagheri, H. Arandiyan, C. Boyer and M. Lim, Adv. Sci., 2016, 3, 1500437 CrossRef PubMed.
- Y. Liu, K. Ai and L. Lu, Nanoscale, 2011, 3, 4804–4810 RSC.
- J. de Wild, A. Meijerink, J. K. Rath, W. G. J. H. M. van Sark and R. E. I. Schropp, Energy Environ. Sci., 2011, 4, 4835–4848 RSC.
- J. Wang, T. Ming, Z. Jin, J. Wang, L. D. Sun and C. H. Yan, Nat. Commun., 2014, 5, 5669 CrossRef CAS.
- M. He, X. C. Pang, X. Q. Liu, B. B. Jiang, Y. J. He, H. Snaith and Z. Q. Lin, Angew. Chem., Int. Ed., 2016, 55, 4280–4284 CrossRef CAS PubMed.
- F. Gonell, M. Haro, R. S. Sánchez, P. Negro, I. Mora-Seró, J. Bisquert, B. Julián-López and S. Gimenez, J. Phys. Chem. C, 2014, 118, 11279–11284 CrossRef CAS.
- W. Qin, D. Zhang, D. Zhao, L. Wang and K. Zheng, Chem. Commun., 2010, 46, 2304–2306 RSC.
- Z. Cheng and J. Lin, Macromol. Rapid Commun., 2015, 36, 790–827 CrossRef CAS PubMed.
- J. C. Boyer, N. J. J. Johnson and F. C. J. M. van Veggel, Chem. Mater., 2009, 21, 2010–2012 CrossRef CAS.
- Y. Bao, Q. A. N. Luu, Y. Zhao, H. Fong, P. S. May and C. Jiang, Nanoscale, 2012, 4, 7369–7375 RSC.
- B. Julián-López, F. Gonell, P. P. Lima, V. T. Freitas, P. S. André, L. D. Carlos and R. A. S. Ferreira, Nanotechnology, 2015, 26, 405601 CrossRef PubMed.
- Z. Wang, W. Li, N. Yu, Z. Liu, L. Zhang and Z. Chen, RSC Adv., 2016, 6, 42763–42769 RSC.
- F. Wang, Y. Han, C. S. Lim, Y. Lu, J. Wang, J. Xu, H. Chen, C. Zhang, M. Hong and X. Liu, Nature, 2010, 463, 1061–1065 CrossRef CAS.
- H.-K. Lee, S.-I. Chang and E. Yoon, J. Microelectromech. Syst., 2006, 15, 1680–1686 Search PubMed.
- H.-S. Chuang and S. Wereley, J. Micromech. Microeng., 2009, 19, 045010 CrossRef.
- J. Wu, R. Wang, H. Yu, G. Li, K. Xu, N. C. Tien, R. C. Roberts and D. Li, Lab Chip, 2015, 15, 690–695 RSC.
- S. Sang and H. Witte, Biosens. Bioelectron., 2010, 25, 2420–2424 CrossRef CAS.
- W. Feng, C. Han and F. Li, Adv. Mater., 2013, 25, 5287–5303 CrossRef CAS.
- F. Schneider, J. Draheirn, R. Kamberger and U. Wallrabe, Sens. Actuators, A, 2009, 151, 95–99 CrossRef CAS.
- A. Shalav, B. S. Richards and M. A. Green, Sol. Energy Mater. Sol. Cells, 2007, 91, 829–842 CrossRef CAS.
- S. Lee, H.-J. Shin, S.-M. Yoon, D. K. Yi, J.-Y. Choi and U. Paik, J. Mater. Chem., 2008, 18, 1751–1755 RSC.
- A. Hosseinzadeh, C. T. Middlebrook and M. E. Mullins, Proc. SPIE, 2015, 9360, 93600P-93601–93600P-93606 Search PubMed.
- J. L. Ferrari, K. d. O. Lima, E. Pecoraro, R. A. S. Ferreira, L. D. Carlos and R. R. Gonçalves, J. Mater. Chem., 2012, 22, 9901–9908 RSC.
- M. D. Young, N. Tran, P. A. Tran, J. D. Jarrell, R. A. Hayda and C. T. Born, J. Biomed. Mater. Res., Part A, 2014, 102, 1478–1485 CrossRef PubMed.
- B. Julián, C. Gervais, E. Cordoncillo, P. Escribano, F. Babonneau and C. Sanchez, Chem. Mater., 2003, 15, 3026–3034 CrossRef.
- B. Julián, R. Corberán, E. Cordoncillo, P. Escribano, B. Viana and C. Sanchez, J. Mater. Chem., 2004, 14, 3337–3343 RSC.
- B. Julian, C. Gervais, N. Rager, J. Maquet, E. Cordoncillo, P. Escribano, F. Babonneau and C. Sanchez, Chem. Mater., 2004, 16, 521–529 CrossRef CAS.
- R. Chai, H. Lian, Z. Hou, C. Zhang, C. Peng and J. Lin, J. Phys. Chem. C, 2010, 114, 610–616 CrossRef CAS.
- Q. Li, X. He, Y. Wang, H. Liu, D. Xu and F. Guo, J. Biomed. Opt., 2013, 18, 100901 CrossRef PubMed.
- G. A. Roth, S. Tahiliani, N. M. Neu-Baker and S. A. Brenner, Wiley Interdiscip. Rev.: Nanomed. Nanobiotechnol., 2015, 7, 565–579 CAS.
- A. F. H. Goetz, G. Vane, J. E. Solomon and B. N. Rock, Science, 1985, 228, 1147–1153 CrossRef CAS PubMed.
- A. Iqbal, D.-W. Sun and P. Allen, Food Control, 2014, 46, 242–254 CrossRef.
- T. Chen, P. Yuen, M. Richardson, G. Liu and Z. She, IEEE Trans. Affect. Comput., 2014, 5, 391–405 Search PubMed.
- V. C. Coffey, Opt. Photonics News, 2015, 26, 26–33 CrossRef.
- M. Mortimer, A. Gogos, N. Bartolomé, A. Kahru, T. D. Bucheli and V. I. Slaveykova, Environ. Sci. Technol., 2014, 48, 8760–8767 CrossRef CAS PubMed.
- D. Yohan, C. Cruje, X. Lu and D. Chithrani, Nano-Micro Lett., 2015, 7, 127–137 CrossRef PubMed.
- J. H. Shannahan, H. Sowrirajan, I. Persaud, R. Podila and J. M. Brown, J. Nanomater., 2015, 2015, 127235 Search PubMed.
- P. Zamora-Perez, D. Tsoutsi, R. Xu and P. G. Rivera, Materials, 2018, 11, 243 CrossRef PubMed.
- F. Akhatova, A. Danilushkina, G. Kuku, M. Saricam, M. Culha and R. Fakhrullin, Bull. Chem. Soc. Jpn., 2018, 91, 1640–1645 CrossRef CAS.
- V. Mikulová, K. Kolostová and T. Zima, Folia Biol., 2011, 57, 151–161 Search PubMed.
- K. Darwiche, P. Zarogoulidis, L. Krauss, F. Oezkan, H. R. F. Walter, R. Werner, D. Theegarten, L. Sakkas, A. Sakkas, W. Hohenforst-Scmidt, K. Zarogoulidis and L. Freitag, Int. J. Nanomed., 2013, 8, 4533–4542 Search PubMed.
- G. Lu and B. Fei, J. Biomed. Opt., 2014, 19, 010901 CrossRef PubMed.
- G. A. Sotiriou, F. Starsich, A. Dasargyri, M. C. Wurnig, F. Krumeich, A. Boss, J.-C. Leroux and S. E. Pratsinis, Adv. Funct. Mater., 2014, 24, 2818–2827 CrossRef CAS.
- S. Zhu, K. Su, Y. Liu, H. Yin, Z. Li, F. Huang, Z. Chen, W. Chen, G. Zhang and Y. Chen, Biomed. Opt. Express, 2015, 6, 1135–1145 CrossRef PubMed.
- A. M. P. Botas, C. D. S. Brites, J. Wu, U. Kortshagen, R. N. Pereira, L. D. Carlos and R. A. S. Ferreira, Part. Part. Syst. Charact., 2016, 33, 740–748 CrossRef CAS.
- M. L. Debasu, C. D. S. Brites, S. Balabhadra, H. Oliveira, J. Rocha and L. D. Carlos, ChemNanoMat, 2016, 2, 520–527 CrossRef CAS.
- G. S. Yi and G. M. Chow, Adv. Funct. Mater., 2006, 16, 2324–2329 CrossRef CAS.
- X. Ye, J. E. Collins, Y. Kang, J. Chen, D. T. N. Chen, A. G. Yodh and C. B. Murray, Proc. Natl. Acad. Sci. U. S. A., 2010, 107, 22430–22435 CrossRef CAS.
- S. Bernal, F. J. Botana, J. J. Calvino, C. López-Cartes, J. A. Pérez-Omil and J. M. Rodríguez-Izquierdo, Ultramicroscopy, 1998, 72, 135–164 CrossRef CAS.
- S. Balabhadra, M. L. Debasu, C. D. S. Brites, R. A. S. Ferreira and L. D. Carlos, J. Lumin., 2017, 189, 64–70 CrossRef CAS.
- J.-C. Boyer and F. C. J. M. van Veggel, Nanoscale, 2010, 2, 1417–1419 RSC.
- V.-M. Graubner, R. Jordan, O. Nuyken, T. Lippert, M. Hauer, B. Schnyder and A. Wokaun, Appl. Surf. Sci., 2002, 197–198, 786–790 CrossRef CAS.
- N. M. Ravindra, P. Ganapathy and J. Choi, Infrared Phys. Technol., 2007, 50, 21–29 CrossRef CAS.
- O. Foussaier, M. Menetrier, J.-J. Videau and E. Duguet, Mater. Lett., 2000, 42, 305–310 CrossRef CAS.
- N. Yamada, I. Yoshinaga and S. Katayama, J. Sol-Gel Sci. Technol., 2000, 17, 123–130 CrossRef CAS.
- F. Compoint, D. Fall, H. Piombini, P. Belleville, Y. Montouillout, M. Duquennoy, M. Ouaftouh, F. Jenoit, B. Piwakowski and C. Sanchez, J. Mater. Sci., 2016, 51, 5031–5045 CrossRef CAS.
- H.-X. Mai, Y.-W. Zhang, L.-D. Sun and C.-H. Yan, J. Phys. Chem. C, 2007, 111, 13721–13729 CrossRef CAS.
- J. Zhao, Y. Sun, X. Kong, L. Tian, Y. Wang, L. Tu, J. Zhao and H. Zhang, J. Phys. Chem. B, 2008, 112, 15666–15672 CrossRef CAS PubMed.
- S.-Z. Zhang, L.-D. Sun, H. Tian, Y. Liu, J.-F. Wang and C.-H. Yan, Chem. Commun., 2009, 2547–2549 RSC.
- F. C. Gainer, G. S. Joshua, R. C. de Silva and M. Romanowski, J. Mater. Chem., 2011, 21, 18530–18533 RSC.
- H. H. Gorris, R. Ali, S. M. Saleh and O. S. Wolfbeis, Adv. Mater., 2011, 23, 1652–1655 CrossRef CAS PubMed.
- N. Bogdan, F. Vetrone, G. A. Ozin and J. A. Capobianco, Nano Lett., 2011, 11, 835–840 CrossRef CAS PubMed.
- C. F. Gainer, G. S. Joshua and M. Romanowski, SPIE-Int. Soc. Opt. Eng., Proc., 2012, 1, 8231–82310 Search PubMed.
- W. Wei, Y. Zhang, R. Chen, J. Goggi, N. Ren, L. Huang, K. K. Bhakoo, H. Sun and T. T. Y. Tan, Chem. Mater., 2014, 26, 5183–5186 CrossRef CAS.
- R. Deng, F. Qin, R. Chen, W. Huang, M. Hong and X. Lui, Nat. Nanotechnol., 2015, 10, 237–242 CrossRef CAS.
- D. T. Klier and M. U. Kumke, J. Phys. Chem. C, 2015, 119, 3363–3373 CrossRef CAS.
Footnotes |
| † Electronic supplementary information (ESI) available: X-ray diffraction, scanning transmission electron microscopy, UV/visible/NIR absorbance, upconversion emission. See DOI: 10.1039/c8na00412a |
| ‡ These authors contributed equally to this work. |
| § Current address: Laboratoire de Chimie de la Matière Condensée de Paris (LCMCP), Sorbonne Université, CNRS, Collège de France, Paris, 75005, France. |
| This journal is © The Royal Society of Chemistry 2019 |