 Open Access Article
Bifunctional hexagonal Ni/NiO nanostructures: influence of the core–shell phase on magnetism, electrochemical sensing of serotonin, and catalytic reduction of 4-nitrophenol†
R.
Manigandan
 a,
T.
Dhanasekaran
 a,
A.
Padmanaban
 a,
K.
Giribabu
 b,
R.
Suresh
 c and
V.
Narayanan
 *a
*a
aDepartment of Inorganic Chemistry, University of Madras, Guindy Campus, Chennai, India. E-mail: vnnara@yahoo.co.in
bElectrodics and Electrocatalysis Division, CSIR-CECRI, Karaikudi, India
cDepartment of Analytical and Inorganic Chemistry, University of Concepcion, Chile
First published on 31st January 2019
Abstract
Ni0/NiO (nickel/nickel oxide) core–shell nanostructures were synthesized through a facile combustible redox reaction. Remarkably, the hetero-phase boundary with different crystalline orientations offered dual properties, which helped in bifunctional catalysis. Presence of a metallic Ni phase changed physicochemical properties and some emerging applications (magnetic properties, optical conductivity, electrochemical sensitivity, catalytic behaviour) could be foreseen. Moreover, formation of a NiO layer on metal surface prevented magnetism-induced aggregation, arrested further oxidation by hindering oxygen diffusion, and acted as a good sorbent to enhance the surface adsorption of the analyte. Hexagonal Ni/NiO nanostructures manifested well-defined ferromagnetic behavior and the catalyst could be collected easily at the end of the catalytic reduction. Ni/NiO core–shell catalysts at the nanoscale had outstanding catalytic performance (reduction of 4-nitrophenol to 4-aminophenol) compared with pure NiO catalysts beyond a reaction time of ∼9 min. The estimated sensitivity, limit of detection and limit of quantification towards the electrochemical sensing of serotonin were 0.185, 0.43 and 1.47 μM μA−1, respectively. These results suggest that a bifunctional Ni/NiO nanostructure could be a suitable catalyst for electrochemical detection of serotonin and reduction of 4-nitrophenol.
1. Introduction
Engineering of earth-abundant nanostructured materials with unique properties and applications has been explored extensively for fundamental scientific and technological interests. In the last few decades, nickel-based hybrid materials have garnered considerable attention in memory devices, gas sensors, electrochromic films, battery cathodes, catalytic materials and magnetic materials1–6 due to their unique physicochemical properties (intrinsic strength, light weight, corrosion resistance and good conductivity). Nickel-based hybrid materials are earth-abundant, have low toxicity, and can be used to make inexpensive materials.7–10 Thus, nickel hybrid materials have been used for engineering (e.g., alloying, doping, core-shells) various typical crystalline structures.11,12 In particular, researchers have focused on NiO core/shell materials due to their exceptional physiochemical behaviors: abnormal adsorptive properties, active magnetic centers, high surface areas, surface defects and fast diffusivities. Moreover, pure NiO may not be preferred as a good catalyst due to poor electrical conductivity and antiferromagnetic nature. Hence, to overcome this problem, decoration of noble metals (Ag, Au, Cu) on nickel-oxide surfaces has enhanced their catalytic behaviour, but recovery is difficult and the process is expensive.13,14 Therefore, development of a cost-effective magnetic recoverable catalyst must be the prioritized. Furthermore, Ni/NiO core–shell materials are highly electrochemically stable due to alloying effects and structure-induced strain effects.15,16 Formation of a nickel-oxide layer hinders the diffusion of oxygen to make contact with the “buried” nickel crystallites. Hence, the metallic Ni hybridised with NiO would be a suitable candidate for bifunctional applications, and would enhance sorption after electron transfer as well as electrochemical and catalytic activity. An intriguing feature could be a synergetic effect arising between the metallic core and acid–base sites in the core–shell structure, which would enhance the catalytic performance.Key challenges in the synthesis of core–shell materials are scalability and multi-step processes. Modification of a core material with a shell by problematic complex procedures or addition of a reactive material can affect the phase boundary of core structures. It is necessary to have a general method to prepare nanoparticles with controlled size to attain unique properties. Core/shell nanostructured materials have been prepared by several methods: template-mediated synthesis, low-pressure spray pyrolysis and polymer-matrix assisted synthesis.17,18 Few of the methods stated above are suitable for large-scale synthesis; they suffer from size-heterogeneity and expense. To overcome these issues, we chose a rapid, single-step procedure for large-scale material synthesis with facile methodology. Hence, a combustible redox reaction would be preferred to obtain highly crystalline material, and rapid accomplishment could arrest the post-oxidation of metallic nickel.19
Addition of 1–10% of a non-ionic kosmotrope (e.g., glycerol, propylene glycol and ethylene glycol (EG)) in an aqueous system makes it highly viscous due to the formation of strong water–water hydrogen bonds, which affect the size of nanoparticles without the assistance of surfactants or templates.20,21 Herein, we used ethylene glycol (EG) as a multipurpose solvent to attain a high boiling point and high viscous nature and maintained a reducing atmosphere to control nucleation.
Most nitro-aromatic compounds have been found to be environmentally poisonous materials. 4-Nitrophenol (4-NP) is one of the most refractory pollutants often present in industrial effluents, but is important in the preparation of several analgesic and antipyretic drugs such as paracetamol and phenacetin.22–24 In addition, 5-hydroxytryptamine (5-HT, serotonin) is a monoamine neurotransmitter involved in a large number of physiological processes in the digestive system, mood, sleep, emesis, sexuality, and appetite. Changes in serotonin levels within the digestive system can cause neurological disorders and several diseases.25 Therefore, detection of the 5-HT level is a crucial requirement for understanding the mechanisms of gastrointestinal functions and monitoring pathophysiological conditions. Hence, it is worthy to conduct the reduction of 4-NP to 4-aminophenol and electrochemical detection of 5-HT using an earth-abundant catalyst. The initial focus of this work was to understand materials properties through optimizing nanostructured Ni/NiO for potential applications (electrochemical detection of 5-HT and catalytic reduction of 4-AP). We tried to gain better understanding of the effect of the metallic-nickel phase on physicochemical properties (structural, magnetic and optical) through metal/metal oxide hybrid nanostructure approaches. The relatively simple method of preparation makes them an attractive class of hybrid catalysts.
We utilized the auto combustible redox reaction of Ni/NiO to further improve magnetic and catalytic properties. Briefly, a detailed investigation and discussion on structural analysis, elemental analysis, electronic transition, surface morphology, and magnetic properties of hexagonal magnetic Ni/NiO nanostructures were reported. Additionally, to study the bifunctional catalytic ability of magnetic Ni/NiO, we undertook electrochemical sensing of 5-HT and catalytic reduction of 4-NP.
2. Experimental section
Materials
Nickel acetate tetrahydrate, ammonium carbonate, EG, hydrazine hydrate, 4-NP and sodium borohydride were purchased from SRL India Ltd and 5-HT from Sigma-Aldrich; all were used as received. For the preparation of buffer solution, disodium hydrogen phosphate, sodium dihydrogen phosphate, acetic acid, sodium acetate, hydrochloric acid, potassium chloride, sodium hydroxide, and ethanol were purchased from Merck, and double-distilled water used as solvent.Synthesis of Ni/NiO nanostructures
Ni/NiO nanostructures were prepared by reacting a stoichiometric amount of aqueous 0.01 M nickel acetate and 5% EG homogenized for 10 min. After few seconds, pale-green Ni-glycol micelles were formed. The reaction mixture turned to purple after slow addition of 1 mM hydrazine hydrate, which turned bluish upon addition of an aqueous 0.01 M ammonium carbonate mixture at 0.1![[thin space (1/6-em)]](https://www.rsc.org/images/entities/char_2009.gif) :
:![[thin space (1/6-em)]](https://www.rsc.org/images/entities/char_2009.gif) 1 ratio. Excessive addition of a hydrazine
1 ratio. Excessive addition of a hydrazine![[thin space (1/6-em)]](https://www.rsc.org/images/entities/char_2009.gif) :
:![[thin space (1/6-em)]](https://www.rsc.org/images/entities/char_2009.gif) ammonium carbonate (hydrazinocarbonic acid) dissolved the intermediate precursor to a dark-blue solution. This suspension was stirred for 20 min at 60 °C with a magnetic stirrer. Furthermore, the reaction mixture was transferred directly to a silica boat and then evaporated on a hot plate for a combustible redox reaction. The temperature was increased until the sample mixture was ignited. Once complete combustion was over, samples were removed immediately from the hot plate to arrest complete oxidation. This reaction mixture is too vigorous and explosive when we used nickel nitrate instead of nickel acetate. The resulting black spongy powder (as-combusted or Ni–C) was heated in a muffle furnace at 300 °C, 400 °C, and 500 °C for 10 min to improve its crystalline nature.
ammonium carbonate (hydrazinocarbonic acid) dissolved the intermediate precursor to a dark-blue solution. This suspension was stirred for 20 min at 60 °C with a magnetic stirrer. Furthermore, the reaction mixture was transferred directly to a silica boat and then evaporated on a hot plate for a combustible redox reaction. The temperature was increased until the sample mixture was ignited. Once complete combustion was over, samples were removed immediately from the hot plate to arrest complete oxidation. This reaction mixture is too vigorous and explosive when we used nickel nitrate instead of nickel acetate. The resulting black spongy powder (as-combusted or Ni–C) was heated in a muffle furnace at 300 °C, 400 °C, and 500 °C for 10 min to improve its crystalline nature.
Characterization techniques
The crystal structure, grain size and lattice parameter of the sample were determined by a diffractometer (Rich Siefert 3000) with Cu Kα1 radiation (λ = 1.5406 Å). X-ray photoelectron spectroscopy (XPS) measurements were made using an Omicron Nanotechnology system with a XM-1000 monochromatic Al Kα source (1483 eV) operated at 300 W (emission current of 20 mA running at 15 kV) and a base pressure of 5 × 10⁻⁵ mbar. The survey scan was undertaken with a step size of 0.5 eV along with 50 eV as the pass energy. A high-resolution scan was done with 0.03 eV as the step size and 20 eV as the pass energy with three sweep segments. Raman spectroscopy was done using a laser confocal microscope (Raman-11; Nanophoton). Ultraviolet-diffuse reflectance spectroscopy (UV-DRS) was undertaken using a spectrophotometer (lambda650; PerkinElmer). The morphology of the nanopowder was analyzed by field-emission scanning electron microscopy (FE-SEM) using a SU6600 system (Hitachi) coupled with transmission electron microscopy (TEM) and energy-dispersive X-ray analysis (EDAX) (TECNAI G2 model T-30; FEI) at an accelerating voltage of 200 kV. Magnetic properties were measured at room temperature using a vibrating sample magnetometer (Lakeshore 7404).Electrochemical sensing of 5-HT
Electrochemical measurements were performed at 298 K using an electrochemical analyzer (1103A; CHI). A three-electrode cell was used with a saturated calomel electrode (SCE) as the reference electrode, platinum wire as the counter electrode, and a modified glassy carbon electrode (GCE) as the working electrode. Cyclic voltammetry (CV) and differential pulse voltammetry (DPV) studies were carried out at various potential windows at a scan rate of 50 to 500 mV s−1 in 0.1 M N2 saturated phosphate buffer solution. The modifying process of the electrode was followed by the method described by Kumar and colleagues.26 The catalyst suspension was prepared by dispersing 2 mg of the sample in 5 mL of ethanol using ultrasonication for 10 min. Then, 5 μL of the suspension stated above was spread on the highly polished GCE surface from the aliquots and dried at room temperature. Various pH (2–9) solutions were prepared by mixing the stock solutions: 0.1 M HCl and 0.1 M KCl were used to prepare pH (1–2)-buffered saline, acetic acid-buffered saline (ABS, pH 3–5) adjusted with 0.1 M CH3COOH, 0.1 M CH3COONa, and phosphate-buffered saline (PBS, pH > 6) was prepared by mixing of Na2HPO4, 1.36 g of NaH2PO4, and NaOH into 1 L of deionized water.Catalytic reduction of 4-NP
An aqueous suspension of Ni/NiO nanoparticles (5 mL, 0.4 g L−1) was added to a NaBH4 aqueous solution (5 mL, 0.3 M), and the mixture stirred for 10 min at room temperature. 4-NP (5 mL, 0.003 M) was then added to the mixture, which was stirred until the bright-yellow color changed gradually to colorless (Fig. S2 and S3†). The reaction progress was monitored by measuring UV-Vis absorption spectra. To study catalyst durability, the catalyst was centrifuged after reaction for 60 min, and the clear supernatant liquid was decanted carefully. The catalyst was washed thoroughly with water and ethanol, followed by drying at 60 °C for 6 h in a vacuum oven. Then, the catalyst was reused for subsequent recycling under the same reaction conditions.3. Results and discussion
Structural analysis of Ni/NiO
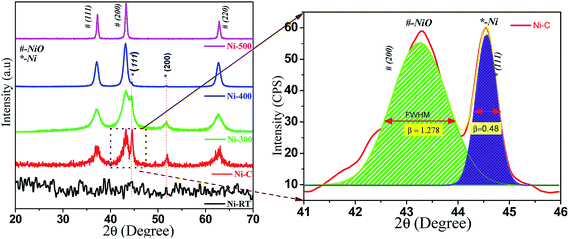
All synthesized samples were characterized using various methods, including X-ray diffraction (XRD). Fig. 1 shows the powder XRD pattern of Ni/NiO [as precipitated at RT (Ni–RT), as-combusted (Ni–C), 300 °C (Ni-300), 400 °C (Ni-400) and 500 °C (Ni-500), respectively]. The XRD spectrum of Ni-RT gave only unresolved peaks due to its amorphous nature, which could not be resolved without annealing. Remarkably, the reaction mixture showed well-resolved diffraction peaks after combustion. The resulting combusted materials contained NiO and metallic Ni0 and equal ratios were identified. The diffraction peaks appearing at 2θ = 37.12°, 43.29°, and 62.87° were indexed as the (111), (200), and (220) planes of the cubic phase (a = 4.177 Å) of NiO (JCPDS no. 065-5745), with an Fm![[3 with combining macron]](https://www.rsc.org/images/entities/char_0033_0304.gif) m (225) space group. The diffraction peaks appearing at 2θ = 44.4°, and 51.5° were indexed as the (111), and (200) planes of the cubic phase (a = 3.535 Å) of metallic Ni (JCPDS no. 065-0380), with an Fm
m (225) space group. The diffraction peaks appearing at 2θ = 44.4°, and 51.5° were indexed as the (111), and (200) planes of the cubic phase (a = 3.535 Å) of metallic Ni (JCPDS no. 065-0380), with an Fm![[3 with combining macron]](https://www.rsc.org/images/entities/char_0033_0304.gif) m (225) space group. Moreover, the XRD characteristic peaks were broader with high intensity, which indicated a small crystallite size. Upon calcination, the intensity of metallic peaks at 45° and 52° started to vanish, which could have been due to oxidation of Ni0 to its oxide material by higher thermal energy. However, little signal intensity was observed up to 400 °C, in accordance with the diffraction of the metallic phase. For (Ni-500), after calcination at 500 °C, no diffraction peaks correspond to the metallic phase. Diffraction bands disappeared completely and NiO characteristic peaks were narrow with high intensity. Hence, complete oxidation of the metallic phase to the pure NiO phase as evidenced by increasing crystallite size and disappearance of Ni0 bands, and in good agreement with the literature,27 was observed. The average crystallite size of Ni and NiO were calculated by the deconvolution of highly intense diffraction peaks, based on the Scherrer formula:
m (225) space group. Moreover, the XRD characteristic peaks were broader with high intensity, which indicated a small crystallite size. Upon calcination, the intensity of metallic peaks at 45° and 52° started to vanish, which could have been due to oxidation of Ni0 to its oxide material by higher thermal energy. However, little signal intensity was observed up to 400 °C, in accordance with the diffraction of the metallic phase. For (Ni-500), after calcination at 500 °C, no diffraction peaks correspond to the metallic phase. Diffraction bands disappeared completely and NiO characteristic peaks were narrow with high intensity. Hence, complete oxidation of the metallic phase to the pure NiO phase as evidenced by increasing crystallite size and disappearance of Ni0 bands, and in good agreement with the literature,27 was observed. The average crystallite size of Ni and NiO were calculated by the deconvolution of highly intense diffraction peaks, based on the Scherrer formula:D = 0.9λ/β![[thin space (1/6-em)]](https://www.rsc.org/images/entities/char_2009.gif) cos cos![[thin space (1/6-em)]](https://www.rsc.org/images/entities/char_2009.gif) θ θ | (1) |
| Name | Phase | XRD | XPS | DRS | VSM | |||||
|---|---|---|---|---|---|---|---|---|---|---|
| 2θ (°) | d (hkl) (Å) | FWHM (°) | Crystallite D (nm) | ΔEB (eV) | E g (eV) | M s (emu g−1) | M r (emu g−1) | H c (Oe) | ||
| Ni–C | Ni0 | 44.56 | 2.03(111) | 0.478 | ≈18.77 | 18.2 | 2.62 | ≈16.87 | ≈2.418 | ≈115 |
| NiO | 43.27 | 2.09(200) | 1.284 | ≈6.95 | ||||||
| Ni-300 | Ni0 | 44.45 | 2.03(111) | 0.410 | ≈21.87 | — | 2.71 | ≈12.86 | ≈2.620 | ≈141 |
| NiO | 43.26 | 2.09(200) | 2.118 | ≈4.22 | ||||||
| Ni-400 | Ni0 | 44.44 | 2.03(111) | 0.550 | ≈16.30 | — | 3.08 | ≈00.91 | ≈0.212 | ≈152 |
| NiO | 43.20 | 2.09(200) | 0.926 | ≈9.64 | ||||||
| Ni-500 | NiO | 43.28 | 2.09(200) | 0.448 | ≈19.93 | 17.9 | 3.23 | ≈00.02 | ≈0.002 | ≈72 |
Fig. 2A and B show the XPS survey, Ni (2p), and C (1s) core level spectrum of Ni/NiO hybrid materials calcined at Ni-300 °C, and Ni-500 °C, respectively. The binding energies (EB) of obtained spectra were charge-corrected by referencing the C 1s peak to 284.6 eV. The deconvoluted C 1s spectrum in the range 281–290 eV is shown in Fig. 2i. The Ni (2p) core-level (Fig. 2ii) emission was split into two significant peaks at EB of 857.6 and 875.3 eV with two satellite peaks corresponding to the spin–orbit components of 2p3/2 and 2p1/2, respectively. The spin–orbit separation ΔEB = 17.9 (NiO) & ΔEB = 18.2 eV (Ni/NiO) and the peak 2p3/2 looked stronger than 2p1/2. The spin–orbit sublevels 2p3/2 and 2p1/2 were superimposed multiplet splitting, which was due purely to the electrostatic interaction between 2p and 3d shells. Apart from that, an additional small shoulder peak appeared at lower energy than Ni2+ at 853.9 eV that could be assigned to metallic Ni in the Ni/NiO hybrid structure (Fig. 2B), which was not observed in NiO-500 sample (Fig. 2A) and which was in good agreement with the literature.17,28 The O (1s) core-level spectra of binding energy vs. intensity are shown in Fig. S1.† The two peaks with binding energies of 528–535.7 eV were due to a hybrid metal oxide (Ni–O) and surface hydroxyl group, respectively. The presence of a surface hydroxyl group was due to the hygroscopic character of the metal oxide.29,30 The obtained XPS elemental analyses provided good information about the presence of Ni0, and Ni2+ species in Ni/NiO, and were in accordance with the results discussed above (Fig. 1).
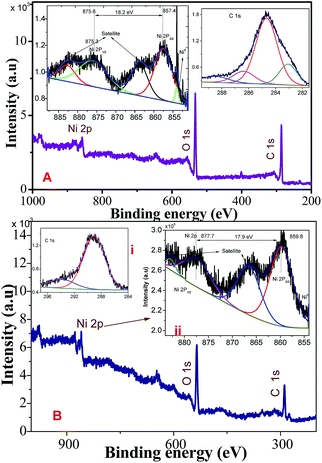 | ||
| Fig. 2 XPS survey, C (1s), Ni (2p) core-level spectrum of Ni/NiO hybrid materials obtained at (A) Ni-300, and (B) Ni-500. | ||
Morphological analyses of Ni/NiO
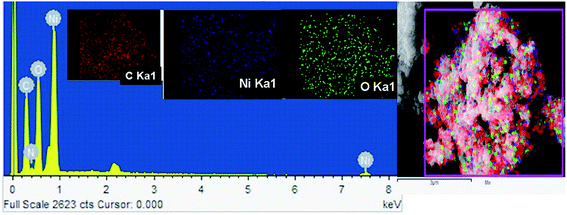
The FE-SEM image of Ni/NiO shown in Fig. 3a was in agreement with TEM results (Fig. 3b, d and e), which clearly indicated that the product consisted of assembled nanostructures. Close inspection of high-magnification FESEM and TEM images (Fig. 3) suggested that the coalescence between particles may have contributed to growth in the combustion stage. Ripening at this stage led to the formation of a hexagonal nanostructure. At the combustion stage, the ripening process took place due to the thermal diffusion of ions, which induced structural and shape deformations. Subsequent inspection of the results revealed the formation of a Ni/NiO hybrid nanostructure obtained by ripening followed by orientation. Fig. 3c shows a selected area electron diffraction (SAED) pattern consisting of bright rings, lattice fringes (Fig. 3e) and EDAX elemental mapping that matched well to Ni/NiO nanostructures, which were in good agreement with powder XRD results (Fig. 4).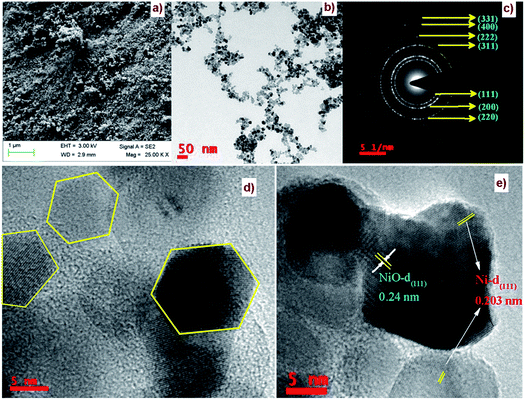 | ||
| Fig. 3 (a) FESEM image, (b, d & e) HRTEM images and (c) SAED pattern of a Ni/NiO nanocomposite (Ni–C). | ||
Formation mechanism of Ni/NiO nanostructures in a single-step reaction procedure
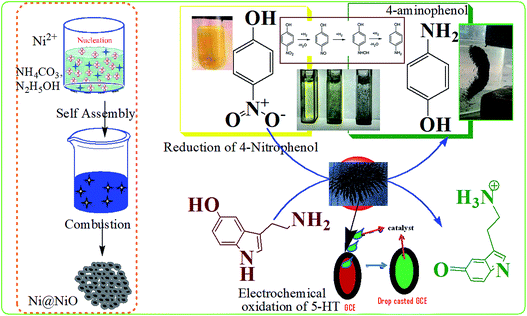
In general, synthesis of Ni/NiO core@shell materials encompasses multiple stages with the assistance of a reducing agent under basic medium and, usually, an inert atmosphere is maintained during the entire process. In this work, a EG![[thin space (1/6-em)]](https://www.rsc.org/images/entities/char_2009.gif) :
:![[thin space (1/6-em)]](https://www.rsc.org/images/entities/char_2009.gif) N2H4 mixture along with ammonium carbonate acted as a redox agent to create an in situ mildly basic condition and inert atmosphere upon combustion. According to experimental results, the possible formation mechanism of the Ni/NiO chain-like core–shell nanoarchitecture could be explained in two main steps. First, the self-assembly of EG
N2H4 mixture along with ammonium carbonate acted as a redox agent to create an in situ mildly basic condition and inert atmosphere upon combustion. According to experimental results, the possible formation mechanism of the Ni/NiO chain-like core–shell nanoarchitecture could be explained in two main steps. First, the self-assembly of EG![[thin space (1/6-em)]](https://www.rsc.org/images/entities/char_2009.gif) :
:![[thin space (1/6-em)]](https://www.rsc.org/images/entities/char_2009.gif) N2H4 results in micelle formation, which reduces flocculation and stimulates the formation of a well-defined structure by creating a steric atmosphere on the surface of nuclei due to the inherent van der Waals attraction of the surfactant.31 Second, the combustible intermediates (N, O–centred bidentate hydrazidocarbonic anion derivatives (N2H3COO−)) could be formed by a metathesis reaction between hydrazine hydrate and ammonium carbonate (N2H4
N2H4 results in micelle formation, which reduces flocculation and stimulates the formation of a well-defined structure by creating a steric atmosphere on the surface of nuclei due to the inherent van der Waals attraction of the surfactant.31 Second, the combustible intermediates (N, O–centred bidentate hydrazidocarbonic anion derivatives (N2H3COO−)) could be formed by a metathesis reaction between hydrazine hydrate and ammonium carbonate (N2H4![[thin space (1/6-em)]](https://www.rsc.org/images/entities/char_2009.gif) :
:![[thin space (1/6-em)]](https://www.rsc.org/images/entities/char_2009.gif) (NH4)2CO3 mixture), which would result in nickel hydrazinocarboxylate salts (Ni(N2H3COO)2/Ni(N2H3COO)2(N2H4)2) by coordination with nickel cations.32 Herein, the EG
(NH4)2CO3 mixture), which would result in nickel hydrazinocarboxylate salts (Ni(N2H3COO)2/Ni(N2H3COO)2(N2H4)2) by coordination with nickel cations.32 Herein, the EG![[thin space (1/6-em)]](https://www.rsc.org/images/entities/char_2009.gif) :
:![[thin space (1/6-em)]](https://www.rsc.org/images/entities/char_2009.gif) N2H4
N2H4![[thin space (1/6-em)]](https://www.rsc.org/images/entities/char_2009.gif) :
:![[thin space (1/6-em)]](https://www.rsc.org/images/entities/char_2009.gif) (NH4)2CO3 mixture acted as an agent as well as a fuel. Briefly, addition of hydrazine nucleated metallic Ni0 partially along with combustible nickel hydrazinocarboxylate (Ni(N2H3COO)2/(N2H4)2Ni(N2H3COO)2) on the surface of Ni0 grains due to the formation of the N2H3COO− intermediate, which also controlled the size of particles by arresting further agglomeration. Formation of an N–N-based highly energetic precursor (nickel hydrazinocarboxylate) was evidenced by characteristic Fourier transform infrared (FTIR) peaks (Fig. S2†) and the thermal behavior of the precursor was also evaluated by thermal gravimetry-differential thermal gravimetry (TG-DTG) (Fig. S3†), which were in good agreement with the literature.33 To achieve a crystalline NiO shell, the resulting precursor was combusted at above ≈250 °C. At a calcination temperature of 500 °C, the core metallic nickel was oxidized to pure NiO. Furthermore, at this stage of crystal growth (Fig. 7), formation of a porous nature would be rational due to the removal of N2, NO2 and a large amount of CO2 in the presence of atmospheric oxygen. Moreover, the metallic nickel was covered by porous nickel oxide, which allowed contact with reactants on core and shell surfaces, and the nickel oxide layer arrested further oxidation of Ni0. Based on the results stated above, a solution-solid-solid growth mechanism was proposed.
(NH4)2CO3 mixture acted as an agent as well as a fuel. Briefly, addition of hydrazine nucleated metallic Ni0 partially along with combustible nickel hydrazinocarboxylate (Ni(N2H3COO)2/(N2H4)2Ni(N2H3COO)2) on the surface of Ni0 grains due to the formation of the N2H3COO− intermediate, which also controlled the size of particles by arresting further agglomeration. Formation of an N–N-based highly energetic precursor (nickel hydrazinocarboxylate) was evidenced by characteristic Fourier transform infrared (FTIR) peaks (Fig. S2†) and the thermal behavior of the precursor was also evaluated by thermal gravimetry-differential thermal gravimetry (TG-DTG) (Fig. S3†), which were in good agreement with the literature.33 To achieve a crystalline NiO shell, the resulting precursor was combusted at above ≈250 °C. At a calcination temperature of 500 °C, the core metallic nickel was oxidized to pure NiO. Furthermore, at this stage of crystal growth (Fig. 7), formation of a porous nature would be rational due to the removal of N2, NO2 and a large amount of CO2 in the presence of atmospheric oxygen. Moreover, the metallic nickel was covered by porous nickel oxide, which allowed contact with reactants on core and shell surfaces, and the nickel oxide layer arrested further oxidation of Ni0. Based on the results stated above, a solution-solid-solid growth mechanism was proposed.
Optical studies of Ni/NiO
Fig. 5A shows the absorption spectra of Ni/NiO calcined at Ni–C, 300, 400 and 500 °C carried out using UV–Vis DRS to characterize optical absorbance. UV absorption in the wavelengths of the visible region consisted of a significant broad band at 720 nm, predominant peak between 400 and 580 nm, and at 369 nm. Increasing the temperature led the relative intensity of the two broad bands to increase significantly, suggesting that the intensity of the composed bands depended strongly upon the environment. The weaker absorption band at 400–580 nm was ascribed to absorption of the Ni host lattice due to the transition from the 2p orbitals of O2− to the 3d orbitals Ni2+. The weak absorption at 720 nm was attributed to the internal d–d transition.34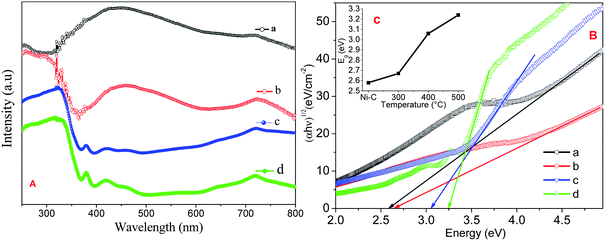 | ||
| Fig. 5 (A) UV-VIS DRS absorption spectra, (B) Tauc plot of Ni/NiO (a) Ni–C, (b) Ni-300, (c) Ni-400, and (d) Ni-500. Inset: plot of estimated band gap against temperature. | ||
The band gap can be calculated from eqn (2):
| (αhν) = A(hν − Eg)2 | (2) |
Band gaps deduced from a Tauc plot of (αhν)2vs. hν are shown in Fig. 5B. The extrapolated value of hν up to zero absorption elicits the valence-to-conduction-band direct-allowed transition or optical band gap energy (Eg) of various materials. It is well known that a semiconductor with nanoscale size shows a blue shift in its spectrum due to quantum confinement effects.34 The synthesized Ni/NiO resulted in a lower Eg value than that of pure NiO. This effect was likely due to the chemical defects present in the inter-granular regions, which generate new energy levels to decrease the distance between the valence to conduction band.
Magnetic studies of Ni/NiO
The magnetic properties of Ni/NiO hybrid nanostructures were analyzed by a vibrating sample magnetometer, with an applied field between −15![[thin space (1/6-em)]](https://www.rsc.org/images/entities/char_2009.gif) 000 Oe to 15
000 Oe to 15![[thin space (1/6-em)]](https://www.rsc.org/images/entities/char_2009.gif) 000 Oe. The magnetization versus magnetic field plots (measurements of M–H magnetic hysteresis loops) are shown in Fig. 6 carried out at room temperature. The resulting graph provided evidence for ferromagnetic behavior, which could be concluded based on the obtained coercivity (Hc) and retentivity of the hysteresis loops. Ni/NiO hybrid nanostructures manifested well-defined ferromagnetic behavior at room temperature and had coercivity, which was due to the higher thermal energy than the anisotropy energy of the nanoparticles (Table 1). The saturation magnetization (Ms), remanent magnetization (Mr), and Hc were determined to be 16.17 emu g−1, 2.41 emu g−1, and 115 Oe, respectively, for Ni/NiO as a combusted sample. The Ms of Ni/NiO compared with that reported for pure Ni0 nanoparticles exhibited a large difference, which could be attributed to weak magnetic interfaces (nonmagnetic residual carbon and antiferromagnetic nickel oxide layer covered on the surface of metallic Ni nanoparticles). Accordingly, the magnetization of nanoparticles is usually smaller than that of the corresponding bulk materials.35
000 Oe. The magnetization versus magnetic field plots (measurements of M–H magnetic hysteresis loops) are shown in Fig. 6 carried out at room temperature. The resulting graph provided evidence for ferromagnetic behavior, which could be concluded based on the obtained coercivity (Hc) and retentivity of the hysteresis loops. Ni/NiO hybrid nanostructures manifested well-defined ferromagnetic behavior at room temperature and had coercivity, which was due to the higher thermal energy than the anisotropy energy of the nanoparticles (Table 1). The saturation magnetization (Ms), remanent magnetization (Mr), and Hc were determined to be 16.17 emu g−1, 2.41 emu g−1, and 115 Oe, respectively, for Ni/NiO as a combusted sample. The Ms of Ni/NiO compared with that reported for pure Ni0 nanoparticles exhibited a large difference, which could be attributed to weak magnetic interfaces (nonmagnetic residual carbon and antiferromagnetic nickel oxide layer covered on the surface of metallic Ni nanoparticles). Accordingly, the magnetization of nanoparticles is usually smaller than that of the corresponding bulk materials.35
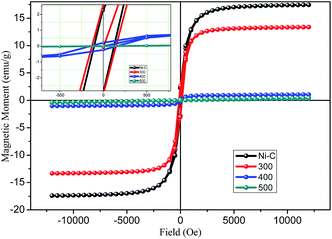 | ||
| Fig. 6 Plot of magnetization versus magnetic field for Ni/NiO hybrid nanostructures inset: magnified view. | ||
Catalytic reduction reaction of 4-NP to 4-aminophenol
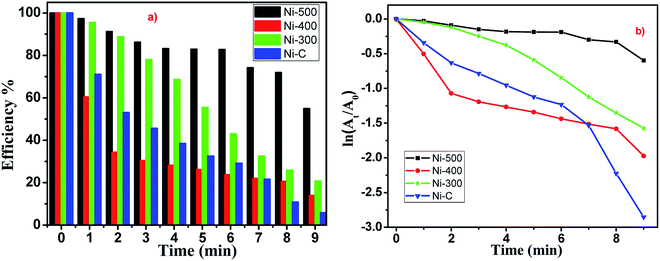
To evaluate the catalytic activity of the Ni/NiO core/shell catalyst, all samples (Ni–C or as-combusted nanocatalysts, Ni-300, Ni-400 and Ni-500) were verified through catalytic reduction of 4-NP to 4-aminophenol. Most nitro-aromatic compounds are environmentally poisonous materials. 4-NP is one of the most refractory pollutants often present in industrial effluents, whereas 4-AP is important in the preparation of several analgesic and antipyretic drugs, such as paracetamol and phenacetin.36 The reduction reaction of 4-NP can be easily monitored by UV-Vis spectroscopy (Fig. S4 and S5†). A solution of 4-NP exhibited a strong absorption peak at 400 nm when treated with an aqueous solution of NaBH4 (Fig. S4†). Addition of Ni/NiO nanocatalysts into a 4-nitrophenolate-BH4 system led to a decrease in peak intensity corresponding to the 4-nitrophenolate ion at 400 nm. This increase in the peak intensity corresponded to 4-aminophenol at 298 nm, which is in good agreement with the literature.37,38 Catalytic reduction started with the formation of an intermediate (4-nitrophenolate ions), which turned a mild-yellow solution to dark-yellow. Adsorption of nitrophenolate on the nanoparticle surface followed by hydrogen transfer to catalyst facilitated reduction of the nitro group to an amino group. The decrease in the strong absorption peak at 400 nm could be readily monitored: the absorption associated with 4-nitrophenolate decreased with a concomitant increase in the absorption maximum at 298 nm. A new peak could be achieved due to desorption of reduced p-aminophenol from the adsorbent. These results indicated that a cost-effective, abundant, facile Ni/NiO core–shell system with higher active surface area could catalyse the reduction reaction through adsorption–desorption kinetics. The mechanism underlying the reduction reaction is shown schematically in Fig. 7.The reduction reactions followed pseudo first-order kinetics with respect to 4-NP, which was defensible from a linear correlation between ln(At/A0) with time. Catalytic performances depended strongly on the morphology and environment of the catalyst. The reaction proceeded rapidly, with conversion completer at a reaction time of ∼9 min (Fig. 8). Moreover, Ni/NiO core-shell-structured catalysts with nanoscale facilitated the outstanding catalytic performance compared with pure NiO catalysts. Finally, the fact that the reduction efficiency decreased with the increasing calcination temperature of catalysts could have been due to the lattice defect, phase transformation and increasing particle size. Those defects in Ni/NiO lattices lead to changes in the band gap (electronic effect), loss of synergetic behaviour (adsorption of substrates) and decreased surface-to-volume ratio.
Electrochemical sensing behavior of 5-HT on the modified electrode
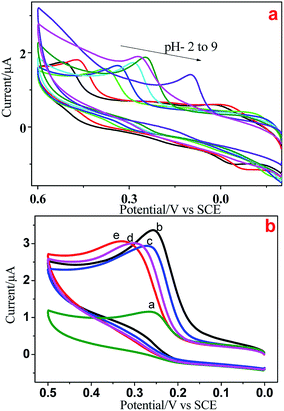
We used electrochemical methods to detect 5-HT due to its electroactive behavior. Initially, CV was done at various pH (2–9) values to examine the electrochemical behavior of all Ni/NiO catalysts. Fig. 9a shows the cyclic voltammograms of GCE/5-HT at various pH values at a scan rate of 100 mV s−1. They show an anodic oxidation peak in the potential windows of 0.2 to 0.6 V corresponding to the electrochemical oxidation of 5-HT on the surface of the bare electrode. As the pH increased from 2 to 9, the oxidation peak potential shifted to a less positive potential, which could have been due to the generation of hydroxyl ions.39 The results provide strong evidence that the electrochemical oxidation of 5-HT was dependent upon the pH of the electrolyte and that the behavior of GCE/5-HT differed significantly. Compared with the other pH values, pH-7 and pH-8 showed better electrochemical behavior towards 5-HT, which had similar values of current density and various peak potential values. A buffer solution of pH 8 was chosen for all subsequent experiments due to the higher peak current and less positive potential values.Fig. 9b depicts the electrochemical oxidation of 5-HT on the surface of bare GCE (9a) and Ni/NiO modified GCE (Fig. 9b–d) as the working electrode (GCE/Ni/NiO/5-HT) in PBS containing 5 × 10⁻⁵ M 5-HT. Bare and modified electrodes showed an anodic peak with slight potential differences and more current variations in the potential region of 0.27–0.33 V. Ni/NiO-modified GCE toward 5-HT showed higher electrocatalytic activity than that of bare GCE. The Ni/NiO phase shifted the oxidation potential to less positive potential with greater electrocatalytic activity compared with that of pure NiO. The surface pH effect on the modified electrodes could be the reason for the less positive potential shift (a synergetic effect between zero-valent Ni sites and acid–base sites in Ni–Ni–O catalysts improves the catalytic performance by shifting the potential towards a less positive region27) because pH altered the anodic oxidation peak. Moreover, Ni/NiO samples showed an increase in conductivity due to the electronic effect between the core and shell. Electron transfer within phases altered the electronegativity and it had two electronic environments in each grain boundary, which enhanced the current density.
The effect of scan rate on the electrochemical response of 5 × 10⁻⁵ M 5-HT at the surface of GCE/Ni/NiO was studied by cyclic voltammetry to investigate electrode reaction kinetics (Fig. 10a). When the scan rate was increased, the oxidation peak current moved positively and the reduction peak current moved negatively. The inset of Fig. 10a shows a plot of peak current (Ip) vs. square root of scan rate (ν1/2). Fig. 10b shows that the oxidation peak currents were linearly proportional to the scan rate from 50 to 500 mV s−1. The linear regression equation for the anodic process was Ia = 0.518ν0.5 − 1.608 (R2 = 0.997). The number of electrons involved in the overall reaction could be obtained by eqn (3) (n = number of electrons, Ip = peak current, R = gas constant, T = 298 K, F = Faraday constant, Q = charge, ν = scan rate). The total number of electrons involved in the redox process of 5-HT was ∼2, which is consistent with the literature. These data suggest that the electrode reaction corresponded to a diffusion-controlled process.40–42
| n = 4IRT/FQν | (3) |
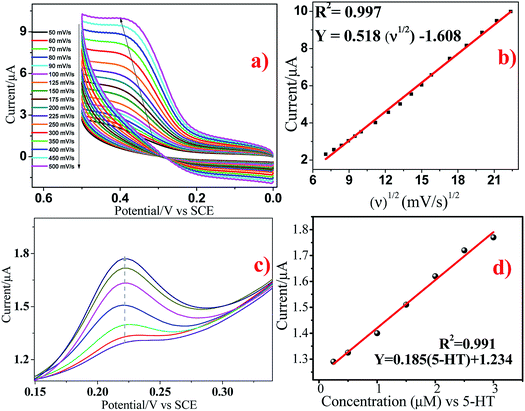 | ||
| Fig. 10 (a and b) Cyclic voltammograms of GCE/Ni/NiO/5-HT at different scan rates in PBS containing 5 × 10⁻⁵ M 5-HT. (cand d) Differential pulse voltammograms of 5-HT at Ni/NiO/GCE. | ||
The DPV response of 5-HT at Ni/NiO/GCE is displayed in Fig. 10c. The oxidation peak current of 5-HT increased gradually at 0.25 × 10⁻⁶ to 3 × 10⁻⁶ M. The calibration graph for 5-HT determination by Ni/NiO/GCE is shown as the inset in Fig. 10d. The linear regression equation was found to be Ia (μA) = 0.185[5-HT] (μM) + 1.234 (R2 = 0.991). This corresponded to a sensitivity of 0.185 μM μA−1, showing that Ni/NiO/GCE was highly sensitive towards 5-HT. The small drop in current upon increasing the concentration found in the linear plot might have been due to the kinetic limitation of the electrode. The calculated limit of detection (3σ/s) was 0.437 μM μA−1 and limit of quantification (10σ/s) was 1.470 μM μA−1 (S/N = 3). The obtained results of Ni/NiO/GCE/5-HT were comparable with those of other electrochemical sensors. Furthermore, the stability and reproducibility of Ni/NiO/GCE/5-HT was investigated by measuring electrode sensitivity after 30 day storage in air under ambient conditions: repetitive measurements revealed acceptable catalytic-current signal responses. These data suggested that Ni/NiO/GCE (Ni–C) possessed high sensitivity, stability and reproducibility towards 5-HT oxidation.
Conclusions
A simple method was developed to synthesize bifunctional Ni/NiO core–shell nanostructures by a facile combustible redox reaction. A possible growth mechanism was discussed based on FE-SEM, TEM, XRD and XPS results and physicochemical properties such as the band gap (UV-Vis DRS) and magnetism (vibrating-sample magnetometer). Structural and morphology analyses clearly showed a metallic phase in as-combusted Ni/NiO nanostructures. Here, the metallic Ni phase was found to be stable up to 300 °C; upon increasing the temperature >300 °C, formation of the NiO phase increased and NiO was oxidized completely at 500 °C.We believe that our method and choice of material has several advantages: simple reaction conditions, large-scale synthesis, cost-effective earth-abundant material, and easy recoverable magnetism. The ferromagnetic Ni/NiO prepared by our method showed high sensitivity towards 5-HT and better catalytic reduction toward 4-NP. These findings are important for enabling catalytic studies and providing a sensor platform. Our method can be utilized to fabricate storage devices due to their outstanding optoelectronic properties.
Conflicts of interest
There are no conflicts to declare.Acknowledgements
R. M. thanks UGC-NRC (Professor K. Muralidharan, University of Hyderabad) and DST-SERB-N-PDF (File No: PDF/2016/000571) for constant support throughout this work.References
- J. Guo, S. Zheng and S. H. Sun, Angew. Chem., Int. Ed., 2014, 52, 8526–8544 CrossRef PubMed.
- A. Varma, A. S. Mukasyan, A. S. Rogachev and K. V. Manukyan, Chem. Rev., 2016, 116, 14493–14586 CrossRef CAS PubMed.
- K. L. Nardi, N. Yang, C. F. Dickens, A. L. Strickler and S. F. Bent, Adv. Energy Mater., 2015, 5, 1500412–1500418 CrossRef.
- S. Xiong, C. Yuan, X. Zhang and Y. Qian, CrystEngComm, 2011, 13, 626–632 RSC.
- A. Querejeta-Fernández, M. Parras, A. Varela, F. del Monte, M. García-Hernández and J. M. González-Calbet, Chem. Mater., 2010, 22, 6529–6541 CrossRef.
- R. Boddula and P. Srinivasan, New J. Chem., 2015, 39, 5382–5388 RSC.
- E. Elanthamilan, A. Sathiyan, S. Rajkumar, E. J. Sheryl and J. P. Merlin, Sustainable Energy Fuels, 2018, 2, 811–819 RSC.
- K. Han, T. Kreuger, B. Mei and G. Mul, ACS Catal., 2017, 7, 1610–1614 CrossRef CAS PubMed.
- C. Kim, J. W. Jung, K. R. Yoon, D. Y. Youn, S. Park and I. D. Kim, ACS Nano, 2016, 10, 11317–11326 CrossRef CAS PubMed.
- M. P. Proenca, C. T. Sousa, A. M. Pereira, P. B. Tavares, J. Ventura and M. Vazquez, Phys. Chem. Chem. Phys., 2011, 13, 9561–9567 RSC.
- L. Zhang, Q. Liu, T. Aoki and P. A. Crozier, J. Phys. Chem. C, 2015, 119, 7207–7214 CrossRef CAS.
- J. Park, E. Kang, S. U. Son, H. M. Park, M. K. Lee, J. Kim, K. W. Kim, H.-J. Noh, J.-H. Park, C. J. Bae, J.-G. Park and T. Hyeon, Adv. Mater., 2005, 17, 429–434 CrossRef CAS.
- M. Wang, D. Tian, P. Tian and L. Yuan, Appl. Surf. Sci., 2013, 283, 389 CrossRef CAS.
- X. Y. Lang, H. Y. Fu, C. Hou, G. F. Han, P. Yang, Y. B. Liu and Q. Jiang, Nat. Commun, 2013, 4, 2169 CrossRef PubMed.
- J. Wang, D. Teschner, Y. Yao, X. Huang, M. Willinger, L. Shao and R. Schlögl, J. Mater. Chem. A, 2017, 5, 9946–9951 RSC.
- A. Khort, K. Podbolotov, R. Serrano-García and Y. K. Gun'ko, J. Solid State Chem., 2017, 253, 270–276 CrossRef CAS.
- V. Ganeshchandra Prabhu, A. R. Paloly, N. G. Divya and M. J. Bushiri, Mater. Sci. Eng., B, 2018, 228, 132–141 CrossRef CAS.
- N. Chopra, H. G. McWhinney and W. Shi, Mater. Charact., 2011, 61, 635–641 CrossRef.
- L. Zhou, Z. Gu, X. Liu, W. Yin, G. Tian, L. Yan, S. Jin, W. Ren, G. Xing, W. Li, X. Chang, Z. Hu and Y. Zhao, J. Mater. Chem., 2012, 22, 966–974 RSC.
- R. Manigandan, K. Giribabu, S. Munusamy, S. Praveen Kumar, S. Muthamizh, T. Dhanasekaran, A. Padmanaban, R. Suresh, A. Stephen and V. Narayanan, CrystEngComm, 2015, 17, 2886–2895 RSC.
- R. Manigandan, K. Giribabu, R. Suresh, S. Munusamy, S. Praveen kumar, S. Muthamizh, T. Dhanasekaran, A. Padmanaban and V. Narayanan, RSC Adv., 2015, 5, 7515–7521 RSC.
- T. Seto, H. Akinaga, F. Takano, K. Koga, T. Orii and M. Hirasawa, J. Phys. Chem. B, 2005, 109(28), 13403–13405 CrossRef CAS PubMed.
- X.-Q. Qiao, Z.-W. Zhang, F.-Y. Tian, D.-F. Hou, Z.-F. Tian, D.-S. Li and Q. Zhang, Cryst. Growth Des., 2017, 17, 3538–3547 CrossRef CAS.
- P. Veerakumar, N. Dhenadhayalan, K.-C. Lin and S.-B. Liu, ChemistrySelect, 2017, 2, 1398–1408 CrossRef CAS.
- Y. T. Li, L. N. Tang, Y. Ning, Q. Shu, F. X. Liang, H. Wang and G. J. Zhang, Sci. Rep., 2016, 6, 28018 CrossRef CAS PubMed.
- D. R. Kumar, D. Manoj and J. Santhanalakshmi, Anal. Methods, 2014, 6, 1011–1020 RSC.
- H. Chen, S. He, M. Xu, M. Wei, D. G. Evans and X. Duan, ACS Catal., 2017, 7, 2735–2743 CrossRef CAS.
- Y. S. Chen, J. F. Kang, B. Chen, B. Gao, L. F. Liu, X. Y. Liu, Y. Y. Wang, L. Wu, H. Y. Yu, J. Y. Wang, Q. Chen and E. G. Wang, J. Phys. D: Appl. Phys., 2012, 45, 065303–065309 CrossRef.
- M. A. Peck and M. A. Langell, Chem. Mater., 2012, 24, 4483–4490 CrossRef CAS.
- R. Manigandan, K. Giribabu, R. Suresh, L. Vijayalakshmi, A. Stephen and V. Narayanan, Mater. Res. Bull., 2013, 48, 4210–4215 CrossRef CAS.
- D. Su, M. Ford and G. Wang, Sci. Rep., 2012, 2, 924–930 CrossRef PubMed.
- K. C. Patil, J. S. Budkuley and V. R. PaiVerneker, J. Inorg. Nucl. Chem., 1979, 41, 953–955 CrossRef CAS.
- P. Ravindranathan and K. C. Patil, Proc.–Indian Acad. Sci., Chem. Sci., 1985, 95, 345–356 CAS.
- W. J. Duan, S. H. Lu, Z. L. Wu and Y. S. Wang, J. Phys. Chem. C, 2012, 116, 26043–26051 CrossRef CAS.
- A. C. Johnston-peck, J. Wang and J. B. Tracy, ACS Nano, 2009, 3(5), 1077–1084 CrossRef CAS PubMed.
- C. Nethravathi, J. Prabhu, S. Lakshmipriya and M. Rajamathi, ACS Omega, 2017, 2, 5891–5897 CrossRef CAS.
- L. Xiao, R. Xu and F. Wang, Talanta, 2018, 179, 448–455 CrossRef CAS PubMed.
- S. Billakanti, G. K. Baskaran and K. Muralidharan, ChemistrySelect, 2017, 2, 4753–4758 CrossRef CAS.
- K. Giribabu, R. Suresh, R. Manigandan, S. Munusamy, S. P. Kumar, S. Muthamizh and V. Narayanan, Analyst, 2013, 138, 5811–5818 RSC.
- A. G. Guell, K. E. Meadows, P. R. Unwin and J. V. Macpherson, Phys. Chem. Chem. Phys., 2010, 12, 10108–10114 RSC.
- R. Suresh, K. Giribabu, R. Manigandan, S. P. Kumar, S. Munusamy, S. Muthamizh, A. Stephen and V. Narayanan, Sens. Actuators, B, 2014, 202, 440–447 CrossRef CAS.
- D. Manoj, D. R. Kumar and J. Santhanalakshmi, Anal. Methods, 2013, 5(14), 3503 RSC.
Footnote |
| † Electronic supplementary information (ESI) available. See DOI: 10.1039/c8na00342d |
| This journal is © The Royal Society of Chemistry 2019 |

