
 Open Access Article
 This Open Access Article is licensed under a Creative Commons Attribution-Non Commercial 3.0 Unported Licence
In situ formation of defect-engineered N-doped TiO2 porous mesocrystals for enhanced photo-degradation and PEC performance†
Xiaolan
Kang
,
Xue-Zhi
Song
 ,
Sihang
Liu
,
Mingzhu
Pei
,
Wen
Wen
and
Zhenquan
Tan
*
,
Sihang
Liu
,
Mingzhu
Pei
,
Wen
Wen
and
Zhenquan
Tan
*
School of Petroleum and Chemical Engineering, Dalian University of Technology, Panjin 124221, P. R. China. E-mail: tanzq@dlut.edu.cn
First published on 26th December 2018
Abstract
N-Doped oxygen defective N/TiO2−x mesocrystal nanocubes were successfully prepared by a facile strategy in our system. Crystal topotactic transformation from NH4TiOF3 mesocrystals facilitated the formation of a porous structure of TiO2. Meanwhile, the introduction of N dopants and oxygen vacancies (OVs) was also achieved during this process. The as-prepared products exhibit much higher photoelectrochemical (PEC) and photocatalytic degradation performance under visible light illumination. It is suggested that the promising catalytic properties result from the synergistic effect of doping, OVs and the amazing porous mesocrystal structure of N/TiO2−x.
Introduction
Photocatalysis is a promising approach to resolve the increasingly serious environmental pollution problems and provide renewable and clean energy (e.g., solar water splitting and artificial photosynthesis) directly from sunlight.1 In the past few decades, tremendous efforts have been devoted to improving the efficiency of photocatalytic materials, especially semiconductor photocatalysts, such as TiO2, SnO2, ZnO, etc.2 Among them, TiO2 is the most promising and suitable candidate for photo-degradation because of its high photo-corrosion resistance and UV-driven activity, as well as the abundant natural reserves, and it is easy to produce on a large scale.3 However, the efficiency of TiO2-based photocatalysts is intrinsically limited by the wide band gap, which leads to low light absorption capability. Also, the fast electron–hole recombination and poor electrical conductivity seriously restrict its further applications.4 Therefore, a number of great efforts have been made to fabricate TiO2 photocatalysts with high efficiency, such as hetero-junction design, exposed facet optimization, and doping with various anions or noble metal nanoparticles.5In the context of absorbing more solar energy across a broad range of the spectrum, an excellent finding was reported by Chen et al. in 2011.6 They introduced black TiO2 with a very narrow band-gap of 1.54 eV, which could utilize almost the entire solar energy spectrum and showed remarkable water-splitting performance. Studies have proved that the formation of atomic defects, such as oxygen vacancies (OVs) and Ti3+ in TiO2, or introducing disordered layers in the surface, could significantly tune the electronic and crystal structure as well as the surface properties of crystalline TiO2.7 Ti3+ self-doping and OVs in reduced TiO2−x can be regarded as electron donors, which cause the formation of mid-gap states below the CB minimum and upshift the Fermi level,8 so that the enhancement of solar light absorption and colorization could be achieved. Moreover, these electron donors in self-modified TiO2−x lead to higher electron density and the enhancement of electric conductivity, which could further promote the separation of charge carriers. Sinhamahapatra et al.9 developed a magnesiothermic reduction method to synthesize black TiO2−x in a 5% H2/Ar atmosphere. By controlling the amount of magnesium, the content of OVs, surface defects, band gap and position, as well as carrier recombination centers can be effectively controlled. The highest hydrogen production rate reached 43 mmol h−1 g−1 with Pt as the co-catalyst under visible light irradiation, which is the catalyst with the highest hydrogen production efficiency. Accordingly, the investigation of defect-controlled TiO2 is of great significance.
Another promising strategy to modify the electronic structure of TiO2 nanomaterial and enhance its response to visible light is doping with nitrogen.1b Numerous studies, carried out over TiO2 single crystals, nanocubes and nanocrystalline powder, have certified that doping nitrogen into TiO2 is an effective method to modify its electronic and optical properties. It is well established that the band gap of TiO2 can be apparently narrowed by inducing substitutionally doped nitrogen, which forms N 2p states at the top of the TiO2 valence band (VB).10 The implantation of a N dopant into TiO2 can be effectively achieved with a variety of methods, including chemical vapor deposition, ion implantation and wet processes with an additional N source.11 However, it is urgent to develop a facile nitrification process with a cost-effective treatment which is also instrument-independent.
Recently, TiO2 mesocrystals, which are assemblies of crystallographically oriented nanocrystals, have been hailed as a new kind of porous TiO2 material.12 They were discovered by Colfen et al.13 in 2005 and proposed as an ordered nanoparticle superstructure. It is well known that the TiO2 photocatalyst with a large crystallite size can maintain structure coherence and facilitate the migration of photo-excited electrons, while large specific surface area as well as exposure of highly active facets is essential for high photocatalytic activity. TiO2 mesocrystals are characterized by high porosity, high crystallinity and oriented subunit alignment, making them an excellent candidate in photocatalysis.14 NH4TiOF3 mesocrystals have usually been used as the precursor of TiO2 mesocrystals because of the similar critical parameters in the {001} facet of the two materials. NH4TiOF3 can be converted to TiO2 through pyrolysis with the shapes preserved, which is known as topotactic transformation.15 Even more noteworthy, this transformation process is accompanied by the release of N, F and H, which provides raw materials for anionic doping.
Herein, we have for the first time successfully designed and fabricated a hierarchical N-doped reduced anatase TiO2 (N/TiO2−x) mesocrystal catalyst with enhanced photo-degradation activity under visible-light. The whole preparation process is very simple and eco-efficient, which mainly consists in a one-step hydrothermal treatment to synthesize NH4TiOF3 mesocrystals, followed by heating with NaBH4 at 400 °C in a nitrogen atmosphere. During this process, NH4TiOF3 mesocrystals were topologically converted to hierarchical TiO2 mesocrystal nanocubes and the in situ introduction of oxygen vacancies and N-doping were achieved simultaneously. Unreduced anatase TiO2 nanoparticles were obtained by calcining NH4TiOF3 mesocrystals in air. Both the obtained N/TiO2−x mesocrystals and unreduced anatase TiO2 nanoparticles were comprehensively analyzed by high-resolution transmission electron microscopy (HR-TEM), photoluminescence (PL) spectroscopy, X-ray photoelectron spectroscopy (XPS), UV–vis spectroscopy, and electron spin resonance (ESR) to study the changes in their structures and reactivity. It was found that the different thermal annealing conditions bring about obvious changes in the electron structure and crystallinity of TiO2. Interestingly, TEM analysis showed that the existence of NaBH4 and N2 spheres can help maintain the cubic morphology of N/TiO2−x mesocrystals, and selected area electron diffraction (SAED) manifested their single crystal nature. The photo-decomposition of organic contaminants and photoelectrochemical (PEC) performance of N/TiO2−x were greatly enhanced under visible light irradiation.
Results and discussion
XRD patterns were collected to evaluate the crystal phase, crystallinity and lattice strain of the as-prepared samples; the results are summarized in Fig. 1a, b. All of the diffraction peaks in Fig. 1a are well matched with the standard card of NH4TiOF3 (JCPDS no. 54-0239),16 indicating that a pure phase was formed during the hydrothermal reaction. After calcination in N2 or air, NH4TiOF3 nanocubes converted to anatase TiO2, which is confirmed by the XRD pattern in Fig. 1b. The three main diffraction peaks at 25.38, 37.88, and 48.18 can be indexed to the {101}, {004} and {200} prominent reflections of pure anatase TiO2 (JCPDS # 21-1272),17 indicating that different thermal treatment conditions would not alter the crystal phase. It is worth noting that the {101} diffraction peak of N/TiO2−x exhibits a larger line width than unreduced TiO2 and also shows a slight shift toward a higher diffraction angle, indicating the reduction of interplanar crystal spacing.18 This phenomenon may be due to the escape of oxygen atoms from the TiO2 crystal lattice in the reductive atmosphere. The introduction of OVs into anatase TiO2 is often associated with the formation of color center,19 just as shown in the digital images (insets of Fig. 1c, d); a N/TiO2−x sample with a blue-green color was obtained from the white NH4TiOF3. The morphology and particle size of the NH4TiOF3 mesocrystal were characterized by SEM and proved to be nanocubes with an average size of 200–300 nm (Fig. 1c, e). SEM images of the sintered samples are shown in Fig. 2d and S1.† After annealing in a N2 atmosphere, the N/TiO2−x sample retained the overall size and shape of the original NH4TiOF3 sample, although the previously smooth facets became rough. The high resolution SEM (Fig. 1f) demonstrates that N/TiO2−x nanocubes consist of an ordered alignment of numerous TiO2 nanoparticles with an average size of about 30 nm. However, when heating in air, the self-assembled ordered structure cannot be maintained and the tiny grains were dispersed or aggregated irregularly (Fig. S1†). This phenomenon can be explained as follows: during the process of thermal phase transformation, HF and NH3 released from NH4TiOF3 and reacted with NaBH4 immediately. So, less inner stress existed in the nanocubes, which is helpful for maintaining the morphology. Then, the volume of grains decreased gradually, and small pores or gaps formed between these nanoparticles, leading to the formation of porous TiO2 materials.20 However, without NaBH4, the produced gas would stay in the crystal lattice for a longer time, causing large internal stress and destroying the mesocrystal structure.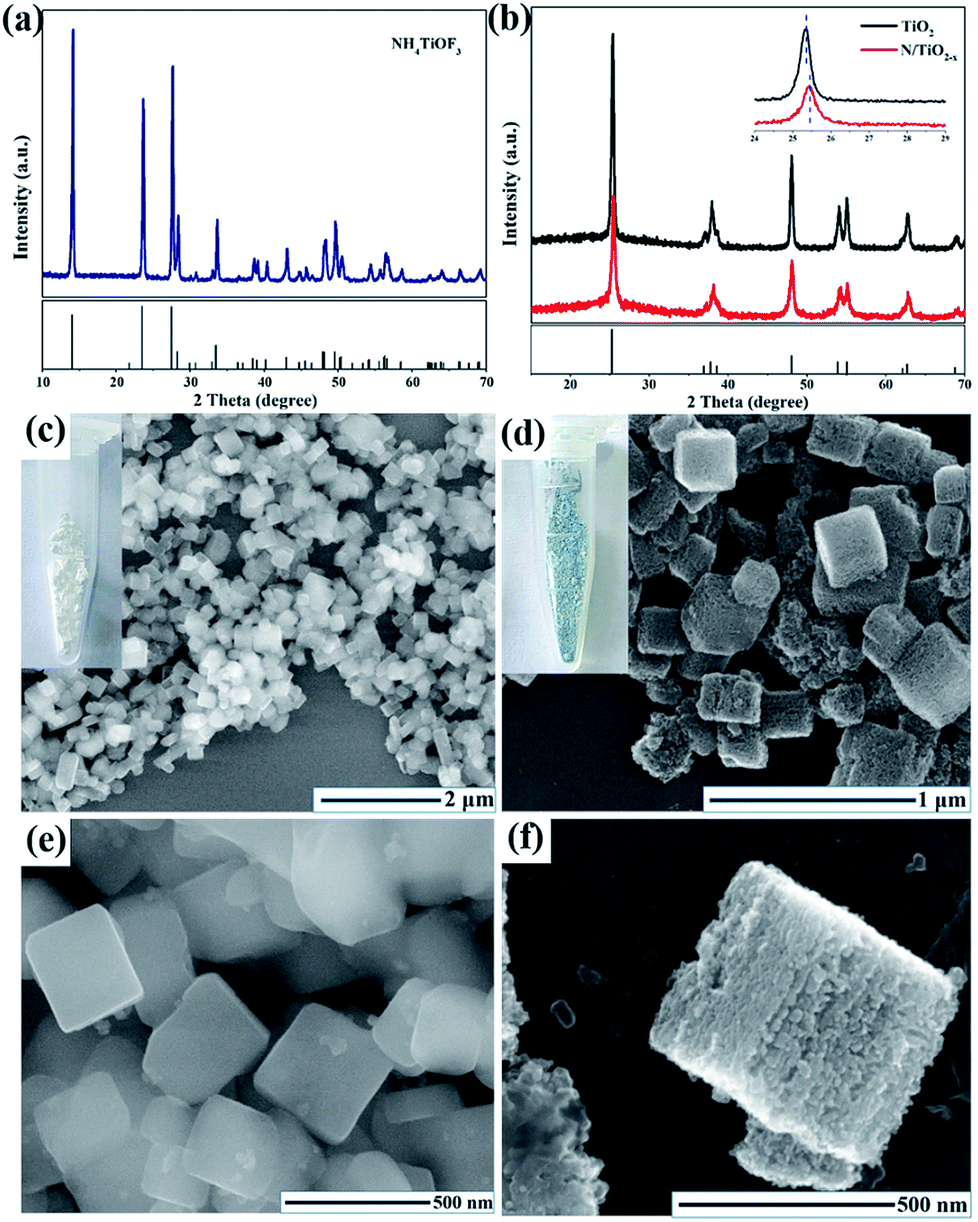 | ||
| Fig. 1 Schematic representation for the synthesis of TiOx nanosheets. XRD pattern of (a) NH4TiOF3 and (b) N/TiO2−x, SEM images of (c, e) NH4TiOF3 and (d, f) N/TiO2−x. | ||
 | ||
| Fig. 2 (a) TEM, (b) HRTEM and (c) SAED patterns of N/TiO2−x, respectively, (d) Raman spectra of N/TiO2−x and unreduced TiO2. | ||
TEM images in Fig. 2a further confirm the porous structure of N/TiO2−x. The selected-area electron diffraction (SAED) pattern (Fig. 2c) recorded on the crystal shows a “single-crystal-like” diffraction pattern along the {001} zone axis of anatase.21 The minor distortions are mainly derived from small mismatches between the boundaries of these tiny nanocrystals, typical of mesocrystals. HRTEM of N/TiO2−x (Fig. 2b) clearly demonstrates the coexistence of {101} and {001} facets. The two sets of lattice fringes of 0.35 nm and 0.23 nm can be ascribed to the {101} and {001} planes of anatase, respectively.22 However, the SAED pattern (Fig. S2b†) of unreduced TiO2 shows concentric diffraction rings, demonstrating the polycrystalline character when heating NH4TiOF3 in air. Besides, only one kind lattice fringe of 0.35 nm presented in unreduced TiO2 (Fig. S2c†). These results imply that the reduction thermal conditions not only help retain the shape of TiO2, but also promote the coexistence of different facets.
Raman scattering experiments were also carried out to monitor the structural properties of N/TiO2−x and unreduced TiO2, as shown in Fig. 2d. The five vibration peak lines at 144 cm−1, 198 cm−1, 639 cm−1, 398 cm−1 and 520 cm−1 can be assigned to Eg, B1g, A1g or B1g of anatase TiO2, respectively.18 From the enlarged view in the inset of Fig. 2d, we can find the obvious weakening and re-shift of N/TiO2−x, compared with unreduced TiO2. Since Raman scattering is very sensitive to microstructure and crystallinity, the broadening and shift of Raman spectra indicate the increase of OV defects in N/TiO2−x,23 which correspond to the results of XRD.
N2 adsorption–desorption experiments were performed to estimate the specific surface area and porosity of the as-prepared TiO2 samples. The results are shown in Fig. S2.† Both unreduced TiO2 and N/TiO2−x materials exhibit a clear hysteresis loop, and the pore size distribution shows average sizes of 16 nm and 12 nm, respectively, typical of mesoporous materials.24 The BET specific area for the N/TiO2−x sample is 60.3 m2 g−1, which is larger than that of the unreduced one (50.0 m2 g−1). From the above analysis, we can find the nanocube structure of N/TiO2−x with innumerable tiny pores, while small particles aggregated in a disordered manner to form unreduced TiO2. Therefore, the BET specific area of pure TiO2 is smaller, and the pore size is larger. The optical response of N/TiO2−x compared to that of untreated TiO2 is depicted in Fig. S3.† The absorption spectra of the N/TiO2−x sample clearly show a stronger absorption in the visible (VIS) region compared with pure TiO2. A redshift absorption edge at around 400 nm is also observed, which indicates the achievement of narrowed band-gap for N/TiO2−x.25 The bandgap of N/TiO2−x, estimated from the edge of the Tauc spectra, is 2.75 eV, significantly narrowed compared to that of pristine anatase. All of these could be linked to the deepening color of the sample thanks to the use of solar light, bringing about more photogenerated carriers for the subsequent degradation reactions.
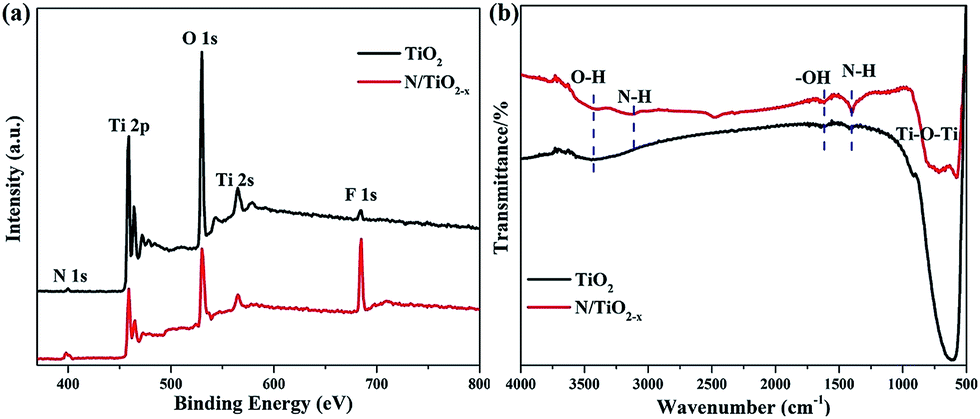
The survey XPS spectrum in Fig. 3a demonstrates the coexistence of Ti, O, N, and F elements in both N/TiO2−x and unreduced TiO2 samples. Apparently, the content of N and F chemical species in N/TiO2−x is much more considerable than in unreduced TiO2. FTIR spectra (Fig. 3b) of N/TiO2−x and unreduced TiO2 were recorded to provide more information on the structures. The wide peaks seen at around 500 cm−1 in both spectra can be ascribed to O–Ti–O stretching frequencies, and a remarkable shift to high energy may be due to the presence of oxygen vacancies in the N/TiO2−x material. The band centered at 1400 cm−1 is attributed to the N–H asymmetric bending mode, while the IR peak at 3112 cm−1 corresponds to N–H stretching vibration. The bands at 1620 cm−1 and 3420 cm−1 are typically attributed to the bending and stretching vibrations of –OH groups,26 respectively.
 | ||
| Fig. 3 (a) XPS spectra and (b) FTIR spectra of N/TiO2−x and unreduced TiO2. | ||
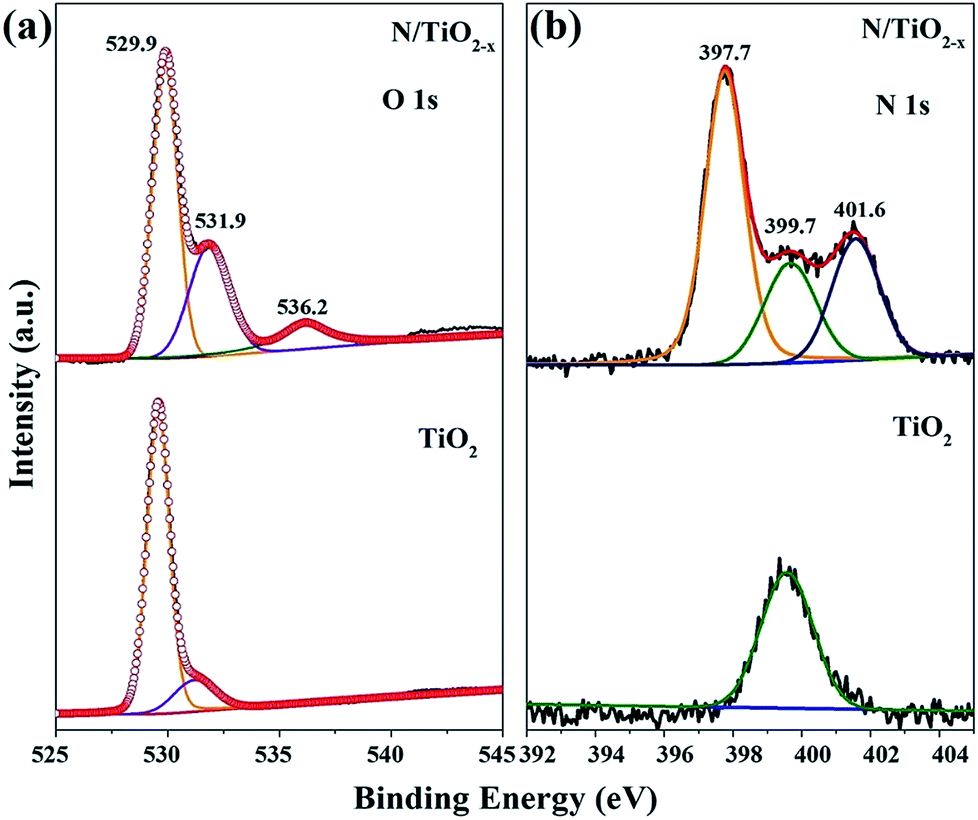
High-resolution XPS spectra were recorded to further investigate the chemical states and surface compositions of the as-obtained samples. All the binding energies in the XPS analysis were corrected for specimen charging by reflecting them to the C 1s peak. The O 1s spectra of N/TiO2−x and unreduced TiO2 display dramatic differences. The broad O 1s peak with a shoulder in both samples could be divided into two peaks located at around 529.9 eV and 531.9 eV, which could be ascribed to Ti–O–Ti and Ti–OH species. Another peak centered at 536.2 eV of N/TiO2−x can be attributed to physisorbed CO2.27 From the fitted results, we can find that the proportion of surface hydroxyl groups of N/TiO2−x is much higher than that of unreduced TiO2. As is well-known, oxygen defective sites tend to combine with H atoms and H2O to form surface Ti–OH groups.9 Therefore, oxygen vacancies were successfully induced in our system.
Fig. 4b shows the chemical binding state of N 1s with respect to N/TiO2−x and unreduced TiO2 samples. The N 1s pattern of the N/TiO2−x mesocrystal was successfully deconvoluted into three Gaussian components, which means the coexistence of N species in different chemical environments. The highest binding energy of 401.6 eV can be assigned to chemisorbed NH4+ and NOx or other contaminated N species, while the one centered at 399.7 eV fits very well to interstitial nitrogen in the form of Ti–O–N linkage.28 Based on the previous reports, the N 1s feature located at around 397.7 eV binding energy is assigned to Ti–N bonding because of the substitutional N dopants.29 This doping is always regarded to contribute to the enhancement of the visible light activity of TiO2 materials. Therefore, the N 1s XPS spectrum clearly demonstrates that calcining NH4TiOF3 mesocrystals in a reduced atmosphere is responsible for N doping.
 | ||
| Fig. 4 XPS spectra and fitted data of the as-obtained TiO2: (a) O 1s and (b) N 1s. | ||
The Ti 2p spectrum in Fig. S4† illustrates the presence of Ti4+ in both N/TiO2−x and TiO2 samples. The binding energies of ∼464.7 eV and∼458.6 eV correspond to Ti 2p1/2 and Ti 2p3/2 paramagnetic spins, respectively. The extra peak centered at around 459.9 eV could be associated with the Ti–N bond,30 which is consistent with the above analysis. It is worth noting that surface Ti3+, which is located at ∼457 eV and ∼463 eV is not visible,31 because the metastable Ti3+ can be rapidly consumed by a suitable oxidant, such as dissolved oxygen in water or O2 in air. Fig. S5† displays the high-resolution XPS spectrum of F 1s. The almost identical peak position at around 684.5 eV belongs to fluoride ions physically absorbed on the surface of TiO2. Obviously, the content of absorbed F− in unreduced TiO2 is much less than that in the N/TiO2−x mesocrystal. Previous studies have stressed that F− ions on the TiO2 surface are highly electronegative, which can attract photo-generated holes, migrating from bulk TiO2 to the surface. Hence, the introduction of surface F− by reduction treatment can facilitate the following photocatalytic reaction.
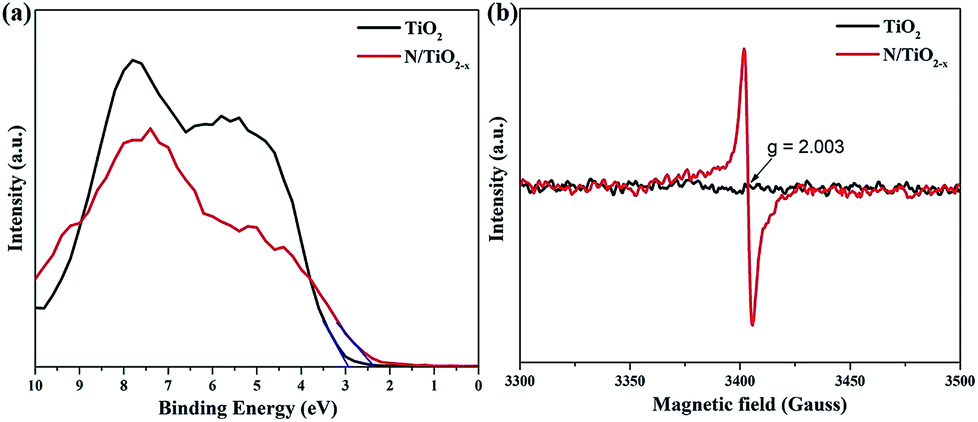
Valence band (VB) XPS spectra were also recorded to investigate the band structure of TiO2 samples treated under different conditions. As shown in Fig. 5a, the VB edge, which was estimated by linear extrapolation of the peak to the x-axis, is about 2.35 eV and 2.93 eV for N/TiO2−x and unreduced TiO2 samples, respectively. Asahi et al.11 have proved that N substitutionally doped into the TiO2 crystal lattice is helpful to modify the electronic structure of TiO2 by inducing impurity states on the top of the VB. Therefore, the adsorption threshold of the N/TiO2−x mesocrystal extends to the visible light region. ESR spectra were further obtained to gain more details about the type of defects of the as-prepared samples. It can be observed from Fig. 5b that a strong ESR signal was detected at g = 2.003 in N/TiO2−x, which is the characteristic feature of the oxygen vacancy trapped with one electron (Vo's).32 However, such a peak was not monitored in unreduced TiO2, implying that a large amount of OVs were formed in the TiO2 mescrystal lattice during the reduction heating process. Besides, the signal at g = 1.97, belonging to Ti3+ in TiO2,33 did not show up in our test system, which is in agreement with the above XPS results.
 | ||
| Fig. 5 (a) Valence band XPS spectra and (b) ESR spectra at room temperature of N/TiO2−x and unreduced TiO2 samples. | ||
It is well known that the migration and separation of photo-generated electrons and holes play an important role in photocatalytic reactions. High reactive performance depends on high carrier migration and separation efficiency. Since PL emission originates from the recombination of electrons and holes, we measured these spectra in our system to understand the behavior of charge carrier transfer, and their trapping and fate. As can be seen from Fig. 6, both samples display similar PL spectra shapes, but a slight blue shift with a new peak at around 370 nm for the N/TiO2−x mesocrystal was observed. Jin et al. assigned this phenomenon to surface oxygen vacancies that existed in TiO2.34 A strong peak at around 397 nm which is equivalent to 3.12 eV, can be ascribed to the emission of band gap transition with the energy of incident light approximately equal to anatase's bandgap energy (387.5 nm). The other PL emission peaks that appear at 450 and 470 nm mainly result from surface OVs and defects of the as-prepared materials, respectively. In comparison to the N/TiO2−x mesocrystal, a significantly strong peak of unreduced TiO2 suggests rapid recombination of photo-generated e−/h+ pairs.35 This is because N dopants and OVs can form traps which affect the distribution and transfer of photo-excited electron–hole pairs, impeding their recombination. Furthermore, the unique mesocrystal structure assembled with crystallographically oriented nanocrystals is helpful for the migration of electrons. Besides, it's worth mentioning that the coexistence of {001} and {101} facets in the oxygen defective N/TiO2−x mesocrystal effectively inhibits electron–hole pair recombination because of the energy difference in different facets.36
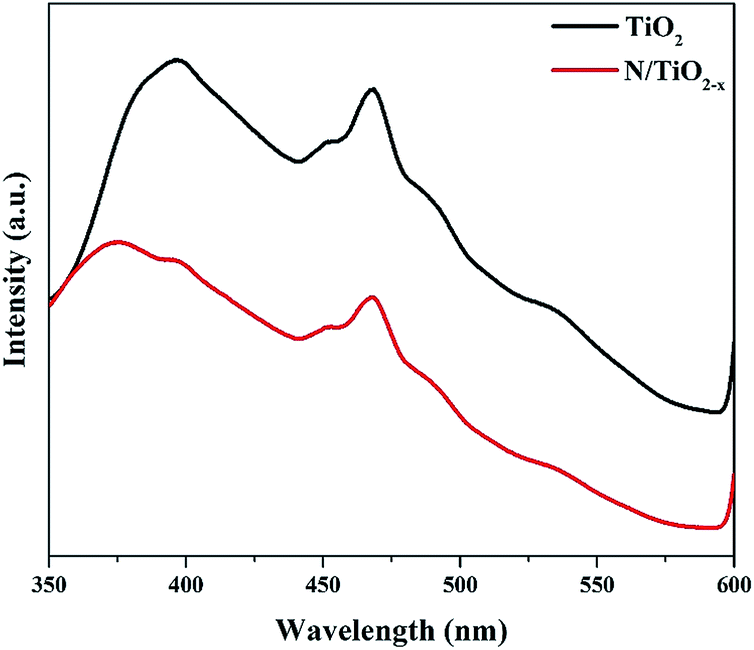 | ||
| Fig. 6 PL spectra of N/TiO2−x and unreduced TiO2 samples. | ||
In order to further confirm the above analysis, PEC measurement and photo-degradation of organic pollutants (RhB, phenol and Cr6+ solution) were conducted under visible light illumination (λ > 420 nm). Linear sweep voltammograms in Fig. 7a show the improvement in the photocurrent density of the N/TiO2−x mesocrystal. This considerable enhancement of photocurrent mainly results from the improved visible light adsorption of the N/TiO2−x sample, benefiting the overall PEC performance. Transient chronoamperometry curves with several on–off cycles were also collected as shown in Fig. 7b; all of the samples exhibit good reproducibility. The N/TiO2−x mesocrystal exhibits obviously higher current density than unreduced TiO2 nanoparticles, indicating the effective separation of photo-excited electron–hole pairs in N/TiO2−x.37 Furthermore, the electrochemical impedance spectra (EIS) of the as-prepared samples are displayed in Fig. 7c. The EIS data have been fitted using the equivalent circuit (ZView) shown in Fig. 7c inset. There is one semicircle observed for both TiO2 and N/TiO2−x, according to previous reports. Rs represents the ohmic resistance of the charge transport resistance as well as the resistance of the semiconductor catalyst, ITO substrate, the electrolyte and the wire connections in the whole circuit (Fig. S6†). R1C1 and R2C2 correspond to the charge transfer at the interface of the photoelectrode/electrolyte. The smaller semicircle radius of N/TiO2−x suggests better charge transfer ability, i.e. faster surface reaction kinetics.38 This result demonstrates that the N/TiO2−x mesocrystal has higher charge mobility and is more resistant to charge recombination, corresponding to the above PL analysis in Fig. 6.
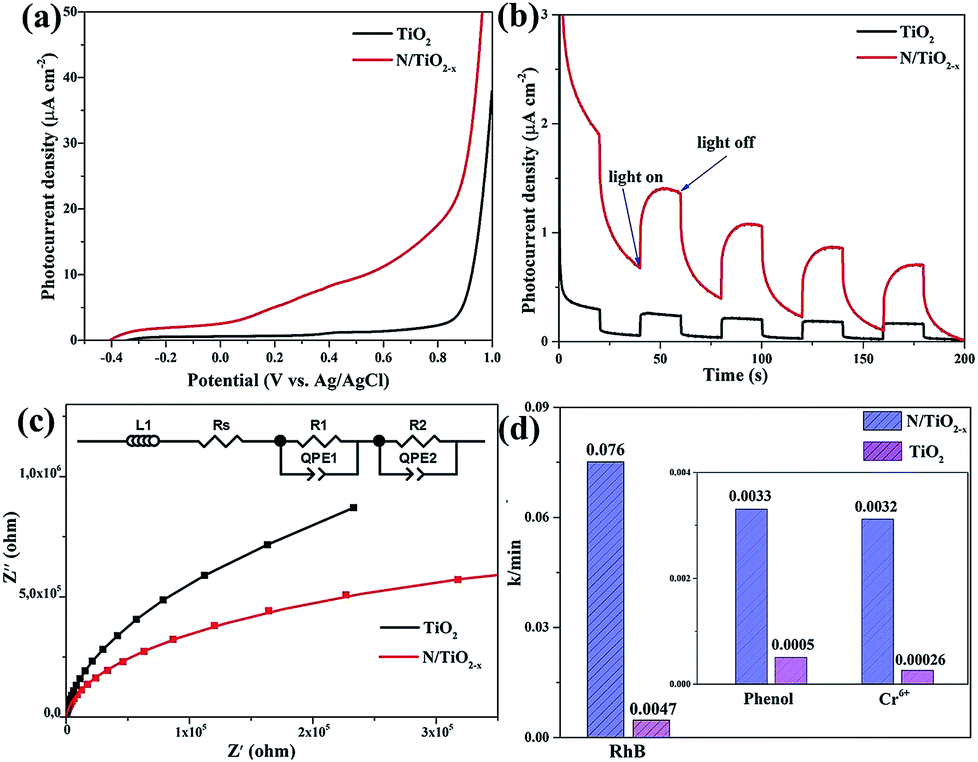 | ||
| Fig. 7 (a) Linear sweep voltammograms, (b) chronoamperometry tests, (c) Nyquist plots of electrochemical impedance and (d) the reaction kinetics constant of N/TiO2−x and unreduced TiO2 samples under visible light illumination. | ||
The time-dependent degradation of RhB, phenol and Cr6+ aqueous solution was studied in our system to evaluate the photocatalytic performance of the as-prepared samples under visible light illumination. Just as expected, the N/TiO2−x mesocrystal outperforms the unreduced TiO2 nanoparticles in all of the degradation reactions. It can be seen from Fig. S7† and S8† that almost 100% of RhB, 30% of phenol and 44% of Cr6+ were decomposed by the N/TiO2−x photocatalyst within 30, 100 and 180 min respectively, while the corresponding values were only 9%, 5.1% and 4.7% for unreduced TiO2. The reaction kinetics constant (k) is illustrated in Fig. 7d. The k values of the N/TiO2−x mesocrystal are 0.076, 0.0033, and 0.0032 min−1 in the decomposition reactions of RhB, phenol and Cr6+, approximately 16, 6.6, and 12.3 times higher than that of unreduced TiO2. Three consecutive cycles were also carried out to investigate the recyclability and stability of the N/TiO2−x photocatalyst. According to the results in Fig. S7b,† the similar decomposition efficiency in each cycle suggests the achievement of high stability and recyclability in N/TiO2−x. Loss of the catalyst during centrifugation and collection is responsible for the slightly decreased activity. It should be mentioned that about 85% of RhB was adsorbed on N/TiO2−x during 30 min of stirring in the dark, since both oxygen vacancies and surface adsorbed F− contribute to this process.39 In order to prove that the adsorbed RhB was degraded completely, FTIR test was conducted on N/TiO2−x after 30 min adsorption in the dark and another 30 min visible light illumination. From Fig. S9,† the characteristic peaks of RhB centered at 2930, 2853, 1458 and 1520 cm−1, emerged after dark adsorption, while they disappeared again after photocatalytic reaction. This result is consistent with the color change of N/TiO2−x.
This outstanding activity of the N/TiO2−x mesocrystal mainly correlated with the extended visible light absorption. Previous research studies have manifested that embedding N atom into the TiO2 lattice (substitutional doping) can cause overlap between O 2p states and N 2p states on the top of the TiO2 valence band (VB),10 as illustrated in Fig. 8. In contrast, the induced OVs in TiO2, via reduction thermal treatment, are more likely to create a series of defect energy levels below the conduction band (CB) of TiO2. These two modification methods play a synergistic role in effectively narrowing its band-gap. Moreover, a charming porous cubic structure with a larger surface area was formed during the topological transformation process. And the N/TiO2−x sample endowed with these merits is expected to provide more active sites, and suppress bulk recombination by shortening the bulk diffusion length of photo-generated charge carriers.14 In addition, the surface heterojunctions created between {001} and {101} facets can further enhance the mobility of electrons and holes.
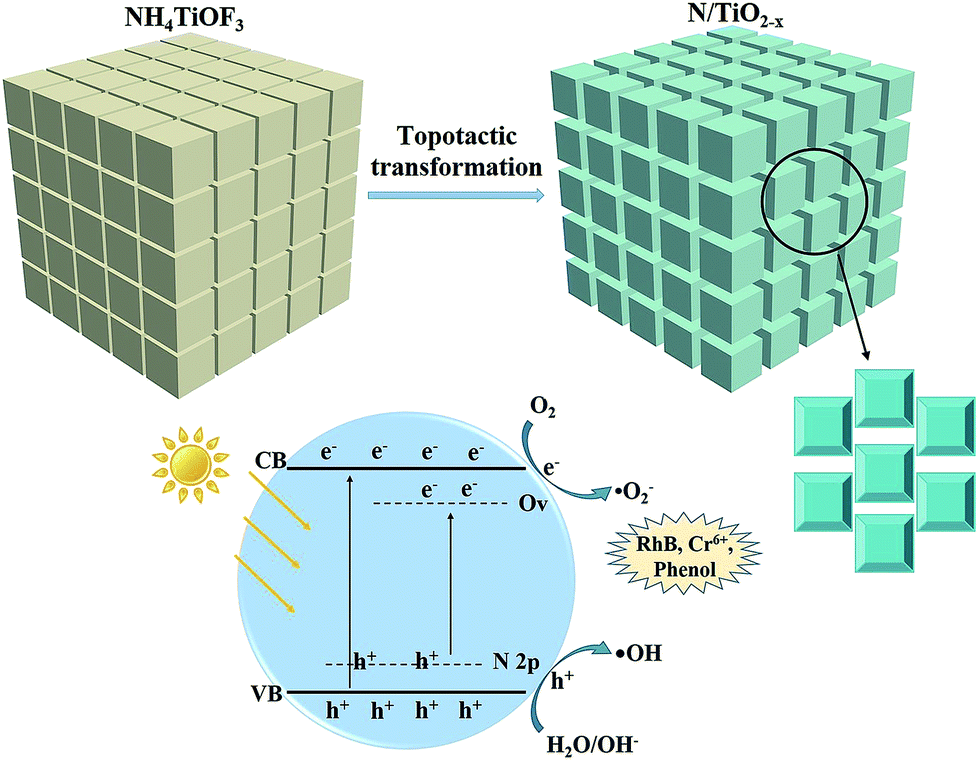 | ||
| Fig. 8 Schematic of the topological transformation process, and energy band diagrams of the N/TiO2−x sample. | ||
Conclusions
In summary, highly active N/TiO2−x mesocrystals were successfully fabricated by thermal annealing of NH4TiOF3 mesocrystals in a reduction atmosphere. The as-prepared sample has a unique porous structure consisting of assemblies of nanocrystals with crystallographic orientation. The presence of NaBH4 and a N2 atmosphere is necessary for maintaining this structure and facilitating the creation of N-doping and oxygen vacancies. PEC tests and photodegradation reactions proved the excellent catalytic performance of N/TiO2−x mesocrystals under visible light irradiation. This incredible activity is attributed to the synergistic effect of N-doping, intrinsic defects and porous mesocrystal structure, which can effectively enhance visible light adsorption and promote the separation of photo-generated charge carriers.Experimental
Materials and reagents
NaBH4 power and tetrabutyl titanate (TBOT, 98%) were purchased from Sigma-Aldrich Co. Ltd. Absolute ethyl alcohol (EtOH, 99.9%) and isopropanol (99.5%) were of analytical grade and obtained from Sinopharm Chemical Reagent Co. Ltd. NH4F and glacial acetic acid (HAc, 99.5%) were purchased from Shanghai Macklin Co. Ltd. All of these chemicals were used without further purification or treatment during the experimental process.Preparation of NH4TiOF3 solid nanocubes
Typically, 20 mL of isopropanol and 4 mL TBOT were blended in a plastic beaker (100 mL) with magnetic stirring for 10 min to form solution A; solution B contained deionized water (5 mL), NH4F (1.3065 g) and HAc (3 mL). Solution B was added dropwise to solution A to form mixture C, which was vigorously stirred for further 5 h at about 0 °C. Then, the mixture was transferred to a 50 mL Teflon autoclave and kept at 180 °C for 12 h. After cooling rapidly to room temperature, the white precipitate was collected and washed with deionized water and ethanol three times, respectively, followed by vacuum drying for 12 h at 60 °C to get the NH4TiOF3 sample.Synthesis of N/TiO2−x mesocrystal nanocubes
The well-mixed sample of NH4TiOF3 powder and NaBH4 was placed in a controlled atmosphere tube furnace and heated at 400 °C for 2 h in a flow of N2. After calcination, the as-prepared sample was submerged in 0.1 M HCl solution for 2 h, ensuring that the residual NaBH4 fully reacted. Then, it was washed with a sufficient amount of deionized water to remove the acid and dried in a vacuum for 12 h at 60 °C to obtain N/TiO2−x mesocrystals. Unreduced anatase TiO2 nanocrystals were also prepared for comparison as follows: NH4TiOF3 was annealed directly in an air atmosphere at 400 °C for 2 h in the absence of NaBH4, to study the effect of NaBH4 and N2 atmosphere.Material characterization
The morphologies and structure of the as-prepared samples were observed by means of a FET Nova NanoSEM 450 field-emission scanning electron microscope with an accelerating voltage of 18.00 kV. Transmission electron microscopy (TEM) and high-resolution transmission electron microscopy (HRTEM) were performed on an FEI Tecnai-G2F30 transmission electron microscope at 200 kV. Energy dispersive X-ray spectrometry (EDS) mapping was achieved by attachment on the SEM microscope. Powder X-ray diffraction (XRD) patterns were recorded on a SHIMADZU XRD-7000S diffractometer using Cu Kα1 radiation (λ = 1.5406 Å) in the 2θ range of 10°–70° and the speed was 2°/min. X-ray photoelectron spectroscopy (XPS) was performed with ThermoFisher ESCALAB™ 250Xi equipment. Electron spin resonance (ESR) spectra were recorded at room temperature with a Bruker A200-SRC. The specific surface area was estimated using the Brunauer–Emmett–Teller (BET) equation on the basis of nitrogen adsorption isotherms measured using a JW-BK132F at 77 K. The pore volumes and pore diameter distributions were calculated using the Barrett–Joyner–Halenda (BJH) model. UV-vis diffuse reflectance spectra (UV-vis DRS) were recorded using a Perkin-Elmer Lambda 950 spectrophotometer in the region of 200–800 nm with BaSO4 as the reference.Photoelectrochemical (PEC) analysis
PEC measurements were carried out in a standard three-electrode configuration with a quartz window on an electrochemical workstation (CHI660E Instruments Inc., Shanghai). 0.2 M Na2SO4 solution was used as the electrolyte, and Ag/AgCl electrode and Pt foil as the reference electrode and counter electrode, respectively. A 300 W xenon lamp (Beijing Perfectlight Technology Co. Ltd) equipped with a 420 nm cut-off filter was used as the visible light source. The working electrode was prepared by dispersing 3 mg of samples in a mixture of 20 μL Nafion, 0.4 mL deionized water and 0.1 mL ethanol to form a homogeneous slurry. Then, 0.2 mL of the slurry was dip-coated onto 25 mm2 indium-tin oxide (ITO) glass, and dried at 150 °C for 2 h. The average thickness of the titania layer was about 2.5 μm. Linear sweep voltammetry scans were performed under visible light illumination; the scan rate was 20 mV s−1 and the potential range was −0.6 V to +1.0 V versus Ag/AgCl. Electrochemical impedance spectra (EIS) were obtained in the frequency range of 0.01 to 105 Hz. The transient response of photocurrent was recorded at an operation voltage of 0.7 V vs. Ag/AgCl. The incident light source during the whole process was visible light (λ > 420 nm) having an output illumination intensity of 100 mW cm−2.Photocatalytic performance test
The visible light photocatalytic degradation performance of the as-prepared samples was evaluated from the decomposition of phenol and RhB, as well as the reduction of Cr(VI) solution. K2Cr2O7 was used to provide Cr(VI). A 300 W xenon lamp (Beijing Perfectlight Technology Co. Ltd) was used as the illumination source and a cut-off filter was inserted to filter out incident light with a wavelength less than 420 nm. For comparison, the photodegradation reaction with unreduced TiO2 was also conducted. In a typical procedure, each photocatalytic system contained 100 mL of simulated pollutant solution and 50 mg of the as-prepared TiO2 photocatalyst. Before illumination, the system was kept in the dark with magnetic stirring for 60 min to establish the surface adsorption–desorption equilibrium between the pollutants and photocatalyst. During the process of degradation, 2 mL of the suspension was taken out of the reactor at regular intervals and filtered using a membrane filter to remove the photocatalyst immediately. Then, a UV-vis spectrophotometer (UV-1800PC, AOE, Shanghai) was employed to analyze the concentration of residual RhB solution and Cr(VI) based on the diphenylcarbazide photometric method. Phenol concentration was monitored using a Thermo Fisher UltiMate3000 HPLC. The photocatalytic degradation kinetics can be characterized using an apparent first-order rate constant k, which could be calculated using eqn (1):ln(C0/C) = kt or C = C0![[thin space (1/6-em)]](https://www.rsc.org/images/entities/char_2009.gif) exp(−kt) exp(−kt) | (1) |
Conflicts of interest
There are no conflicts to declare.Acknowledgements
This work was supported by the National Natural Science Foundation of China (No. 21571028, No. 21601027), the Fundamental Research Funds for the Central Universities (No. DUT16TD19, No. DUT17LK33, No. DUT18LK28), and the Education Department of the Liaoning Province of China (LT2015007).Notes and references
- (a) A. Fujishima and K. Honda, Nature, 1972, 238, 37 CrossRef CAS PubMed; (b) R. Asahi, T. Morikawa, T. Ohwaki, K. Aoki and Y. Taga, Science, 2001, 293, 269 CrossRef CAS PubMed.
- (a) S. Weng, Z. Pei, Z. Zheng, J. Hu and P. Liu, ACS Appl. Mater. Interfaces, 2013, 5, 12380 CrossRef CAS PubMed; (b) Z. Dai, F. Qin, H. Zhao, J. Ding, Y. Liu and R. Chen, ACS Catal., 2016, 6, 3180 CrossRef CAS.
- Y. Ma, X. Wang, Y. Jia, X. Chen, H. Han and C. Li, Chem. Rev., 2014, 114, 9987 CrossRef CAS PubMed.
- S. G. Kumar and L. G. Devi, J. Phys. Chem. A, 2011, 115, 13211 CrossRef CAS PubMed.
- (a) X. Zhou, N. Liu and P. Schmuki, ACS Catal., 2017, 7, 3210 CrossRef CAS; (b) L. Liu and X. Chen, Chem. Rev., 2014, 114, 9890 CrossRef CAS PubMed.
- X. Chen, L. Liu, P. Yu and S. S. Mao, Science, 2011, 331, 746 CrossRef CAS PubMed.
- (a) X. Liu, G. Zhu, X. Wang, X. Yuan, T. Lin and F. Huang, Adv. Energy Mater., 2016, 6, 1600452 CrossRef; (b) X. Kang, X. Song, Y. Han, J. Cao and Z. Tan, Sci. Rep., 2018, 8, 5904 CrossRef PubMed.
- Z. Zhang, X. Tan, T. Yu, L. Jia and X. Huang, Int. J. Hydrogen Energy, 2016, 41, 11634 CrossRef CAS.
- A. Sinhamahapatra, J. Jeon and J. Yu, Energy Environ. Sci., 2015, 8, 3539 RSC.
- S. Hoang, S. P. Berglund, N. T. Hahn, A. J. Bard and C. B. Mullins, J. Am. Chem. Soc., 2012, 134, 3659 CrossRef CAS PubMed.
- R. Asahi, T. Morikawa, H. Irie and T. Ohwaki, Chem. Rev., 2014, 114, 9824 CrossRef CAS PubMed.
- (a) P. Zhang, S. Kim, M. Fujitsuka and T. Majima, Chem. Commun., 2017, 53, 5306 RSC; (b) P. Zhang, T. Tachikawa, M. Fujitsuka and T. Majima, Chemistry, 2018, 24, 6295 CrossRef CAS PubMed.
- H. Colfen and M. Antonietti, Angew. Chem., Int. Ed., 2005, 44, 5576 CrossRef PubMed.
- (a) J. Yu, W. Wang, B. Cheng and B. Su, J. Phys. Chem. C, 2009, 113, 6743 CrossRef CAS; (b) P. Zhang, M. Fujitsuka and T. Majima, J. Energy Chem., 2016, 25, 917 CrossRef.
- J. Cai and L. Qi, Sci. China Chem., 2012, 55, 2318 CrossRef CAS.
- X. Li, J. Wang, Y. Men and Z. Bian, Appl. Catal. B: Environ., 2016, 187, 115 CrossRef CAS.
- T. R. Gordon, M. Cargnello, T. Paik, F. Mangolini, R. T. Weber, P. Fornasiero and C. B. Murray, J. Am. Chem. Soc., 2012, 134, 6751 CrossRef CAS PubMed.
- W. Hu, W. Zhou, K. Zhang, X. Zhang, L. Wang, B. Jiang, G. Tian, D. Zhao and H. Fu, J. Mater. Chem. A, 2016, 4, 7495 RSC.
- (a) K. Yuan, Q. Cao, H. Lu, M. Zhong, X. Zheng, H. Chen, T. Wang, J. Delaunay, W. Luo, L. Zhang, Y. Wang, Y. Deng, S. Ding and D. W. Zhang, J. Mater. Chem. A, 2017, 5, 14697 RSC; (b) A. Petala, D. Tsikritzis, M. Kollia, S. Ladas, S. Kennou and D. I. Kondarides, Appl. Surf. Sci., 2014, 305, 281 CrossRef CAS.
- P. Zhang, M. Fujitsuka and T. Majima, Appl. Catal. B: Environ., 2016, 185, 181 CrossRef CAS.
- C. Tang, L. Liu, Y. Li and Z. Bian, Appl. Catal. B: Environ., 2017, 201, 41 CrossRef CAS.
- B. Zhang, F. Wei, Q. Wu, L. Piao, M. Liu and Z. Jin, J. Phys. Chem. C, 2015, 119, 6094 CrossRef CAS.
- A. Naldoni, M. Allieta, S. Santangelo, M. Marelli, F. Fabbri, S. Cappelli, C. L. Bianchi, R. Psaro and V. Dal Santo, J. Am. Chem. Soc., 2012, 134, 7600 CrossRef CAS PubMed.
- E. M. Samsudin, S. B. Abd Hamid, J. C. Juan, W. J. Basirun and G. Centi, Appl. Surf. Sci., 2016, 370, 380 CrossRef CAS.
- (a) Y. Wang, J. Cai, M. Wu, H. Zhang, M. Meng, Y. Tian, T. Ding, J. Gong, Z. Jiang and X. Li, ACS Appl. Mater. Interfaces, 2016, 8, 23006 CrossRef CAS PubMed; (b) K. Zhang, W. Zhou, L. Chi, X. Zhang, W. Hu, B. Jiang, K. Pan, G. Tian and Z. Jiang, ChemSusChem, 2016, 9, 2841 CrossRef CAS PubMed.
- R. Fagan, D. W. Synnott, D. E. McCormack and S. C. Pillai, Appl. Surf. Sci., 2016, 371, 447 CrossRef CAS.
- S. Chen, Y. Wang, J. Li, Z. Hu, H. Zhao, W. Xie and Z. Wei, Mater. Res. Bull., 2018, 98, 280 CrossRef CAS.
- X. Kang, Y. Han, X. Song and Z. Tan, Appl. Surf. Sci., 2018, 434, 725 CrossRef CAS.
- K. Batalovic, N. Bundaleski, J. Radakovic, N. Abazovic, M. Mitric, R. A. Silva, M. Savic, J. Belosevic-Cavor, Z. Rakocevic and C. M. Rangel, Phys. Chem. Chem. Phys., 2017, 19, 7062 RSC.
- I. Z. Torres, J. J. P. Bueno, C. Y. T. López, L. L. Rojas, M. L. M. López and Y. M. Vong, RSC Adv., 2016, 6, 41637 RSC.
- T. Billo, F. Y. Fu, P. Raghunath, I. Shown, W. F. Chen, H. T. Lien, T. H. Shen, J. F. Lee, T. S. Chan, K. Y. Huang, C. I. Wu, M. C. Lin, J. S. Hwang, C. H. Lee, L. C. Chen and K. H. Chen, Small, 2018, 14, 1702928 CrossRef PubMed.
- L. Kong, Z. Jiang, C. Wang, F. Wan, Y. Li, L. Wu, J. F. Zhi, X. Zhang, S. Chen and Y. Liu, ACS Appl. Mater. Interfaces, 2015, 7, 7752 CrossRef CAS PubMed.
- B. Li, Z. Zhao, Q. Zhou, B. Meng, X. Meng and J. Qiu, Chemistry, 2014, 20, 14763 CrossRef CAS PubMed.
- L. Jing, Y. Qu, B. Wang, S. Li, B. Jiang, L. Yang, W. Fu, H. Fu and J. Sun, Sol. Energ. Mat. Sol. C., 2006, 90, 1773 CrossRef CAS.
- Q. Xiang, K. Lv and J. Yu, Appl. Catal. B: Environ., 2010, 96, 557 CrossRef CAS.
- Q. Li, T. Li, S. Chang, Q. Tao, B. Tian and J. Zhang, Enlarging {110} exposed facets of anatase TiO2 by the synergistic action of capping agents, CrystEngComm, 2016, 18, 5074 RSC.
- K. Pan, Y. Dong, W. Zhou, Q. Pan, Y. Xie, T. Xie, G. Tian and G. Wang, ACS Appl. Mater. Interfaces, 2013, 5, 8314 CrossRef CAS PubMed.
- B. Klahr, S. Gimenez, F. Fabregat-Santiago, T. Hamann and J. Bisquert, J. Am. Chem. Soc., 2012, 134, 4294 CrossRef CAS PubMed.
- A. Luna-Flores, J. L. Sosa-Sanchez, M. A. Morales-Sanchez, R. Agustin-Serrano and J. A. Luna-Lopez, Materials, 2017, 10, 1447 CrossRef PubMed.
Footnote |
| † Electronic supplementary information (ESI) available. See DOI: 10.1039/c8na00193f |
| This journal is © The Royal Society of Chemistry 2019 |