 Open Access Article
Sensitive and selective colorimetric nitrite ion assay using silver nanoparticles easily synthesized and stabilized by AHNDMS and functionalized with PABA†
Mohammed Hassan
Ibrahim
 ab,
Zhonghua
Xue
*a,
Hassan Idris
Abdu
a,
Mahgoub Ibrahim
Shinger
c,
Ahmed Mahmoud
Idris
a,
Murtada Mohamed
Edris
a,
Duoliang
Shan
a and
Xiaoquan
Lu
 *a
*a
aKey Laboratory of Bioelectrochemistry & Analysis of Gansu Province, College of Chemistry & Chemical Engineering, Northwest Normal University, Lanzhou, 730070, P. R. China. E-mail: xzhlab@hotmail.com; luxq@nwnu.edu.cn
bDepartment of Chemical Engineering, Faculty of Engineering and Technical Studies, University of Kordofan, El-Obeid, Sudan
cDepartment of Chemistry, International University of Africa, Khartoum, Sudan
First published on 24th December 2018
Abstract
Nitrite ions (NO2−), as one of the important inorganic anions, exhibit considerable effects towards the environment and human health. Moreover, over intake of this anion may cause dangerous diseases. Herein, we successfully fabricated silver nanoparticles (AgNPs) using 4-amino-5-hydroxynaphthalene-2, 7-disulphonic acid monosodium salt (AHNDMS) and functionalized them with p-aminobenzoic acid (PABA), and used the functionalised AgNPs as a sensitive and selective colorimetric sensor for nitrite ions. The structure of the as-prepared pure AgNPs was experimentally characterized by different characterizations methods, namely, UV-vis, FT-IR, CV, DPVs, SEM, TEM, and XRD. Additionally, the nitrite ion sensitively and selectively changes the brownish yellow color of the dispersed AgNPs to pinkish red, indicating aggregation of AgNPs, with a detection limit of 0.016 ppm (0.348 μM) and 0.0069 ppm (0.149 μM) by the naked-eye and by UV-vis spectroscopy, respectively. The color change suggested that the aggregation of AgNPs was induced by nitrite-selective diazo-coupling. UV-vis spectra show the disappearance of the absorbance at 474 nm and appearance of a new peak at 532 nm, presumably due to the conversion of AgNPs to silver ions. Moreover, the studies of interference in the proposed sensor confirm its selectivity in the presence of anions as well as cations. Furthermore, linearity was observed between the absorption and the concentration of nitrite ions. More importantly, the proposed sensor was practicably applied for the determination of nitrite in different water samples, such as distilled water, river water, and tap water.
1 Introduction
Nitrite (NO2−) ion, as one of the important inorganic anions and a nitrogen-containing nutrient, has been extensively used along with NO3− and NH4+ in fertilizers for the improvement of plant growth.1–5 NO3− also exists in the environment systems, food products, and in the biological nitrogen cycle as a significant mediator.6 Additionally, NO2− is often used in meat and fish product preservation, and can interact with amines to produce nitrosamines, which have been distinguished as carcinogenic compounds, subsequently increasing the chances of cancer and malformation.7–10 Moreover, excess intake of NO2− will cause several medical problems, such as methemoglobinemia, which is commonly known as “blue baby syndrome”, and esophageal cancer.11,12 The U.S. Environmental Protection Agency (EPA) recommended that the maximum limit for NO2− in drinking water should be ca. 21.74 μM or 1 ppm.13 Thus, the qualitative and quantitative analysis of NO2− in water, food and agricultural products is of vital importance.Numerous analytical approaches, such as chromatography,14,15 spectroscopy,16,17 Raman spectroscopy,18,19 fluorescence,9,20 flow injection system analysis,21,22 chemiluminescence analysis,23,24 and electrochemistry,6,25,26 have been developed for NO2− testing and monitoring, using which the nitrite ion sensitively and selectively can be detected. Unfortunately, the use of these techniques requires expensive and complicated instruments with highly trained operators that need experience in dealing with them. Therefore, their application in routine detection is limited. Recently, rapid detection methods for NO2− are being preferred, particularly for the visual on-site analysis because NO2− is known to be chemically unstable.5
Colorimetric sensors are particularly fascinating due to their low-cost, simplicity, sensitivity, and rapidity in analysis of ions.27–37 NO2− optical sensors generally utilize selective diazo-coupling reaction, in which NO2− can react with an aromatic amine in acidic medium to produce a diazonium salt that consequently couples with another aromatic compound to form a highly colored azo dye.38 Unluckily, there are some disadvantages: many methods based on this special reaction are not sensitive enough for NO2− at low concentrations, use hazardous reagents at a high concentration in the reaction and consume a lot of time for adjusting to a particular pH solution and temperature for the coupling reaction, hence resulting in a complicated method. However, developing high-performance sensing systems and highly stable, environmentally friendly, simple, facile and economical methods with superior properties still remain a great challenge for researchers. Very recently, silver and gold nanoparticles (NPs) have been found to be particularly appealing for fabricating and constructing colorimetric sensors due to their attractive properties, such as powerful surface plasmon resonance, and distance-dependent optical properties, as their performance events can be easily observed by the naked-eye as visible color changes.39–42 In this way, there is no need of complicated instruments and tedious detection methods. Moreover, NPs have been used successfully for the selective colorimetric detection of many species with excellent absorption coefficients and low detection limits.43,44 Therefore, a variety of metal cation colorimetric sensing methods involving NPs have been widely explored.45–49
The sensing of anions, particularly NO2−, is rarely reported using noble NPs-based colorimetric sensors. Mirkin et al.50 fabricated an AuNPs sensor for colorimetric NO2− detection, in which nitrite ion induced the aggregation of the AuNPs and caused a color change through the diazo-coupling reaction, with a detection limit 21.74 μM. However, this method included designing two types of functionalized AuNPs, which was time consuming. Xiao et al.51 designed 4-aminothiophenol gold nanorods (AuNRs) modified as a colorimetric NO2− sensor based on the reduction of the AuNRs surface charges, followed by aggregation of the AuNRs in the presence of nitrite ion, with detection limit below 21.74 μM. However, in this strategy, heating is necessary. Chen et al.52 developed a colorimetric method for NO2− detection based on the etching of AuNRs, the detection limit using this method is 4.0 μM. Heating is also needed here and moreover, there is interference from ferric ions (Fe3+). Kumar et al.53 reported a colorimetric sensor based on AgNPs stabilized by the phenolic chelating ligand, in which the addition of the NO2− caused the decolorization of brownish yellow color of the as-synthesized AgNPs with a good detection limit of 0.1 μM. Yet, the addition process is needed here to synthesize the phenolic chelating ligand, which results in large time consumption. The disadvantages mentioned with the above systems may limit their application in routine real sample analysis.
Motivated by the appealing properties of the NPs, in this study, we designed a facile and improved system based on AgNPs, which were synthesized and stabilized by AHNDMS and functionalized with PABA for colorimetric NO2− sensing for the first time. Herein, the addition of nitrite ions to the as-prepared AgNPs in alkaline media results in a color change from brownish yellow to pinkish red, which is suggested to indicate the NO2−-induced aggregation of the AgNPs by selective diazo-coupling strategy without heat treatment. There is also no need to synthesize two types of functionalized NPs, and no additional processes are required to prepare functionalization agents. The detection limit by the naked-eye is 0.016 ppm (0.348 μM) and 0.0069 ppm (0.149 μM) by UV-vis spectroscopy, with no interferences observed from the presence of other ions. Thus, this present system is simpler and more sensitive and selective than the formerly reported methods. On top of this, we have introduced a multifunctional compound (AHNDMS) as a novel reducing and stabilizing agent, which could electrostatically interact with silver ions through –OH,45,54, –NH2,55 and –S![[double bond, length as m-dash]](https://www.rsc.org/images/entities/char_e001.gif) O56 groups to form dispersed AgNPs.
O56 groups to form dispersed AgNPs.
2 Experimental section
2.1. Reagents
AHNDMS was obtained from Aladdin. A stock sodium nitrite solution with concentration of 1000 μg mL−1 was purchased from Guobiao (Beijing) Testing & Certification Co., Ltd. PABA was purchased from Sinopharm Chemical Reagent Co., Ltd. All other chemicals used were of analytical grade and their solutions were prepared using double distilled water (>18.25 MΩ cm). Working solutions were prepared by diluting the standard solution of nitrite ion to an appropriate volume with double distilled water, whenever required. All experiments were performed at room temperature.2.2. Synthesis and functionalization of AgNPs
AgNPs were synthesized using a modified previously reported method.53 In addition, AHNDMS, which we used for the first time as a new reducing-capping agent, easily converted silver ions to silver nanoparticles. Silver nitrate solution (500 μM) was added into an aqueous solution of AHNDMS (500 μM), and the total volume of the final reaction solution was 40 mL. The contents were stirred vigorously at 70 °C. After a few minutes, brownish yellow color appeared, suggesting the reduction of silver ions into AgNPs. The solution was allowed to stir at the same conditions for more than 2 h and for 1 h at room temperature. The synthesis procedure was repeated several times to verify and confirm the reproducibility of the AgNPs. Characterization, functionalization, and other measurements of the obtained AgNPs were performed after allowing the solution to stand at room temperature for 24 h. Functionalization of the as-synthesized AgNPs with PABA was performed by the addition of acidified PABA solution to an appropriate amount of the as-prepared AgNPs, such that the final concentration of PABA in the reaction container was 7 mM, followed by strong stirring for 2 h at room temperature.2.3. Recommended procedure
To an aliquot containing 0.016–1.00 μg mL−1 of NO2− in a 3 mL calibration tube, 0.5 mL of the AgNPs solution and 0.5 mL of buffer solution (pH = 9.4) were added, upon which the color of the solution immediately changed to pinkish red. The contents of each tube were diluted to the mark with double distilled water, shaken thoroughly, and kept aside for 35 min at room temperature before the absorbance of the pinkish red colored solution was measured at 532 nm against reagent blank. Beer's law graph was constructed by plotting absorbance against NO2− concentrations.2.4. Selectivity of proposed sensor
To verify the selectivity of the proposed detection system, other ions (anions and cations), namely, nitrate (NO3−), chloride (Cl−), fluoride (F−), thiocyanide (SCN−), carbonate (CO3−), bicarbonate (HCO3−), oxalate (C2O42−), sulphate (SO42−), dihydrogen phosphate (H2PO4−), hydrogen phosphate (HPO42−), manganese (Mn2+), iron(II) (Fe2+), iron(III) (Fe3+), cobalt (Co2+), nickel (Ni2+), copper (Cu2+), zinc (Zn2+), calcium (Ca2+), magnesium (Mg2+), and lead (Pb2+), were tested with the recommended method. The concentration of other ions (1000 μM) used in this investigation was 50-fold higher than that of NO2−, except that of Mn2+, Fe2+, and Fe3+, which were 200 μM (10-fold higher than that of NO2−).2.5. Real samples analysis
Different water samples such as deionized water, yellow river water, and tap water were investigated using the recommended method after spiking with NO2− at different concentrations for the measurement of recovery. Yellow river (China-Lanzhou) water sample was collected in a polyethylene container, filtered and assayed directly. Deionized water and tap water samples were collected from the lab at Northwest Normal University in Lanzhou, and immediately analyzed without any additional treatment.2.6. Characterization
UV-vis experiments were performed using an Agilent UV-8453 spectrophotometer (Agilent Inc., Japan). The Fourier transform infrared (FTIR) spectra were recorded on a Bruker Vertex 70 FT-IR spectrophotometer using the KBr method. Electrochemical measurements were performed on a CHI660 electrochemical station (CHI Instruments Inc., USA) with a conventional three-electrode system, where bare and/or modified glassy carbon electrodes (GCE, 3 mm in diameter) were used as the working electrodes and Pt wire and Ag/AgCl (saturated KCl) were used as the auxiliary and reference electrodes, respectively. Transmission electron micrographs were taken using a FEI Teena G2 F20 transmission electron microscope (TEM). X-ray diffraction (XRD) was detected on an X-ray diffractometer (Bruker AXS). A dried powder of AgNPs was used for XRD measurements. Scanning electron microscopy (SEM) was conducted using a Zeiss electron microscope (Zeiss, Oberkochen, Germany).3 Results and discussion
Phenolic compounds have the ability to reduce silver ions and stabilize AgNPs through electrostatic interactions of the phenolic oxygen atoms.53,54 It was reported that bifunctional compounds, such as melamine47,55 and Gallic acid,57 can reduce silver ions to AgNPs. Hence, mixing of AgNO3 solution with AHNDMS solution of certain concentration followed by vigorous stirring under 70 °C produced a brownish yellow solution of monodispersed AgNPs with maximum absorption at 474 nm, which may be due to the surface plasmon resonance (SPR) vibration of silver.58 Addition of PABA solution to the AgNPs at certain amounts followed by stirring retained the solution color (brownish yellow) with the same absorption peak of the pure formed AgNPs, indicating no aggregation of AgNPs. In the presence of NO2− under acidic conditions, the amine group of the PABA or AHNDMS converted to a diazonium salt, which then coupled with the aromatic group on the same compounds to form an azo group in alkaline medium. Subsequently, aggregation of the AgNPs took place, shortening the interparticle distance, which caused a drastic color change from brownish yellow to pinkish red, as illustrated in Scheme 1.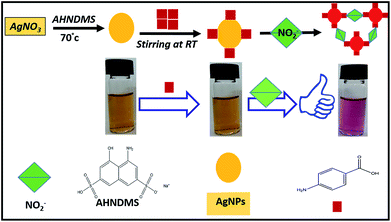 | ||
| Scheme 1 Schematic for colorimetric sensing of NO2− using AgNPs synthesized by AHNDMS and functionalized with PABA. | ||
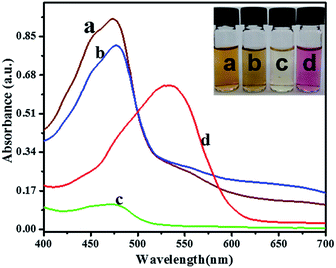
In order to support and confirm the mechanism suggested above, UV-visible investigations were performed and depicted in Fig. 1. The pure AgNPs prepared by AHNDMS show an absorption peak at 474 nm, which agrees well with AgNPs SPR (curve (a) and inset image (a)). Curve (b) and inset image (b) show that the addition of PABA for functionalization cannot change the absorbance peak position (434 nm) and brownish yellow solution color; instead, it just caused a small decrease in the absorption value, suggesting an interaction between AgNPs and PABA via –COOH, and –NH2 groups, as reported earlier.59,60 On mixing 0.5 mL of the as-formed AgNPs with 0.5 mL buffer solution (pH = 9.4) in a 3 mL calibration tube followed by diluting the solution with double distilled water to the mark, the absorption peak decreased sharply, while its position remained at 474 nm, and the color of the solution changed to pale-yellow due to the dilution of the AgNPs solution (curve (c) and inset image (c)). Addition of the NO2− solution of a certain concentration to 0.5 mL of AgNPs was studied in the same manner as explained in the recommended procedure. A new absorption peak appeared at 532 nm (curve (b)), corresponding to the pinkish red color change for the solution (inset image (b)). This response is attributed to the AgNPs aggregation induced by NO2− due to the reasons discussed above and reported previously,50 and was further confirmed by SEM and TEM in Fig. 4 and by CV and DPVs in Fig. S2.†
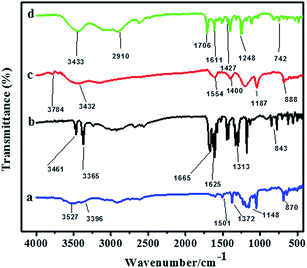
The infrared spectra of the pure AHNDMS (curve (a)), pure PABA (curve (b)), as-prepared AgNPs (curve (c)), and functionalized AgNPs (curve (d)) are comparatively assembled and depicted in Fig. 2, where characteristic features are observed. After reaction of AHNDMS with AgNO3, the peaks shifted to either higher or lower wave number. The peaks at 870 cm−1 (N–H bending), 1148 cm−1 (S![[double bond, length as m-dash]](https://www.rsc.org/images/entities/char_e001.gif) O stretching), 1372 cm−1 (C–N stretching), 1501 cm−1 (N–H bending) 3396 cm−1 (N–H stretching), and 3527 cm−1 (O–H stretching) in the AHNDMS spectrum shifted to 888 cm−1, 1187 cm−1, 1400 cm−1, 1530 cm−1, 3432 cm−1 and 3784 cm−1, respectively in the AgNPs spectrum. After introducing PABA to the AgNPs solution, IR spectrum of the functionalized AgNPs shows peaks at 742 cm−1, 1174 cm−1, 1427 cm−1, 1554 cm−1, 3011 cm−1 and 3433 cm−1 due to the shifting of 843 cm−1 (aromatic N–H bending), 1313 cm−1 (C–N stretching), 1573 cm−1 (N–H bending), 1625 cm−1 (aromatic rings), 1665 cm−1 (C
O stretching), 1372 cm−1 (C–N stretching), 1501 cm−1 (N–H bending) 3396 cm−1 (N–H stretching), and 3527 cm−1 (O–H stretching) in the AHNDMS spectrum shifted to 888 cm−1, 1187 cm−1, 1400 cm−1, 1530 cm−1, 3432 cm−1 and 3784 cm−1, respectively in the AgNPs spectrum. After introducing PABA to the AgNPs solution, IR spectrum of the functionalized AgNPs shows peaks at 742 cm−1, 1174 cm−1, 1427 cm−1, 1554 cm−1, 3011 cm−1 and 3433 cm−1 due to the shifting of 843 cm−1 (aromatic N–H bending), 1313 cm−1 (C–N stretching), 1573 cm−1 (N–H bending), 1625 cm−1 (aromatic rings), 1665 cm−1 (C![[double bond, length as m-dash]](https://www.rsc.org/images/entities/char_e001.gif) O stretching), 3365 cm−1 (N–H stretching), and 3461 cm−1 (O–H stretching) peaks of the PABA spectrum. All the above peak shifts were due to the binding of N–H, S
O stretching), 3365 cm−1 (N–H stretching), and 3461 cm−1 (O–H stretching) peaks of the PABA spectrum. All the above peak shifts were due to the binding of N–H, S![[double bond, length as m-dash]](https://www.rsc.org/images/entities/char_e001.gif) O, C–N, N–H, and O–H groups of PABA with the as-formed AgNPs, indicating the successful reduction of Ag+ to AgNPs, capping with AHNDMS, and subsequent functionalization with PABA through –NH2 group and –COOH group of p-aminobenzoic acid. To clarify the sensing mechanism of NO2−, the IR spectra of the as-prepared AgNPs, AgNPs functionalized with PABA (AgNPs/PABA), and AgNPs/PABA in the presence of nitrite ions in alkaline medium (AgNPs/PABA + NO2−) were collected, as shown in Fig. S1.† The IR spectra of the as-prepared pure AgNPs and AgNPs/PABA are already revealed in Fig. 2. The AgNPs/PABA + NO2− spectrum shows new peaks at 1143 cm−1, 1395 cm−1 and 1456 cm−1, corresponding to the N
O, C–N, N–H, and O–H groups of PABA with the as-formed AgNPs, indicating the successful reduction of Ag+ to AgNPs, capping with AHNDMS, and subsequent functionalization with PABA through –NH2 group and –COOH group of p-aminobenzoic acid. To clarify the sensing mechanism of NO2−, the IR spectra of the as-prepared AgNPs, AgNPs functionalized with PABA (AgNPs/PABA), and AgNPs/PABA in the presence of nitrite ions in alkaline medium (AgNPs/PABA + NO2−) were collected, as shown in Fig. S1.† The IR spectra of the as-prepared pure AgNPs and AgNPs/PABA are already revealed in Fig. 2. The AgNPs/PABA + NO2− spectrum shows new peaks at 1143 cm−1, 1395 cm−1 and 1456 cm−1, corresponding to the N![[double bond, length as m-dash]](https://www.rsc.org/images/entities/char_e001.gif) N bond stretching,1,61 indicating that the nitrite ions have undergone diazo-coupling reaction, as we have suggested previously.
N bond stretching,1,61 indicating that the nitrite ions have undergone diazo-coupling reaction, as we have suggested previously.
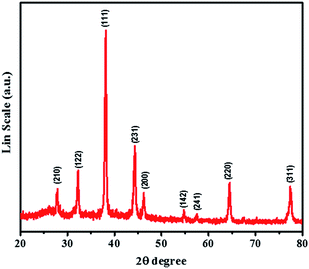
The crystalline phase and the structural purity of AgNPs were investigated by XRD technique. The distinct and characteristics peaks obtained in the XRD pattern of AgNPs (Fig. 3) further confirmed the existence of the nanocrystalline structure of AgNPs. The Bragg reflection peaks at 2θ values of 27.849°, 32.278°, 38.149°, 44.372°, 46.245°, 54.770°, 57.481°, 64.387°, and 77.418° were assigned to the corresponding (210), (122), (111), (231), (200), (142), (241), (220), and (311) planes for AgNPs based on the face-centered cubic structure (JCPDS file no. 04-0783). This result suggests that the as-formed AgNPs are biphasic and crystalline in nature. XRD analysis results are displayed in Fig. S2† to support the sensing mechanism of the sensor; the XRD pattern of AgNPs (green curve) is already revealed in Fig. 3. The XRD pattern of AgNPs/PABA (blue curve) represents the functionalized AgNPs pattern, which contains majority of the AgNPs peaks besides the undefined peaks due to the presence of PABA, indicating that the AgNPs have been successfully functionalized with PABA. The XRD pattern of AgNPs/PABA + NO2− (red curve) shows how the existence of nitrite ions in the sensor changes the crystalline phase of AgNPs/PABA and produces a new XRD pattern for silver. The red curve shows peaks at 2θ values of 27.849°, 32.278°, 38.149°, 46.245°, 57.481°, 68.387°, and 77.418°, corresponding to the (210), (122), (111), (200), (142), (220), and (311) planes for silver.62 However, these peaks in comparison with those of AgNPs are different in terms of intensity values, with shifts occurring for many of them. This investigation confirmed the formation of silver ions, which occurred by NO2− inducing the aggregation of AgNPs by a diazo-coupling reaction. These results agree well with the results reported in the UV-visible investigation and with the mechanism suggested in Scheme 1. The XRD measurements for AgNPs characterization are in good agreement with the previous reports.63–67
For nanostructural studies, surface morphology of the obtained AgNPs was characterized by using Scanning Electron Microscopy (SEM). The results are summarized and depicted in Fig. 4. As shown in the figure, the AgNPs have a spherical shape (Fig. 4A). No significant change is observed in the shape of the AgNPs even after functionalization with PABA (Fig. 4B). Interestingly, when nitrite ions were introduced at a certain concentration to the functionalized AgNPs under the optimum conditions, the spherical AgNPs changed to aggregated particles (Fig. 4C), indicating that the presence of NO2− in the sensor induced the aggregation of the functionalized AgNPs by selective diazotization coupling reactions in the nanoparticle system.
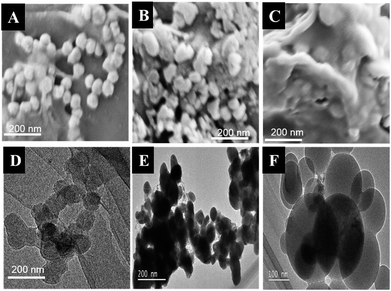 | ||
| Fig. 4 SEM images of the as-synthesized AgNPs (A), functionalized AgNPs (B), and aggregated AgNPs (C). TEM images of the synthesized AgNPs (D), functionalized AgNPs (E), and aggregated AgNPs (F). | ||
For further confirmation of the sensing mechanism, the as-synthesized AgNPs were characterized using Transmission Electron Microscopy technique (TEM). TEM revealed that the AgNPs formed by AHNDMS were predominately oval and spherical (Fig. 4D). There is no change in the nanoparticles even after treatment with PABA as the functionalization compound (Fig. 4E). Significant aggregation of AgNPs was observed when NO2− was introduced into the senor system under optimum conditions, as shown in Fig. 4F. The as-synthesized AgNPs form regular spheres with an average diameter of 53.85 nm (Fig. S3A†). After functionalization with PABA (Fig. S3B†) and introduction of NO2− to the sensor system (Fig. S3C†), the average size increased to 57.62 nm and 132.83 nm, respectively. All these investigations confirmed the formation of AgNPs, the subsequent functionalizing with PABA, and the aggregation by NO2− through the mechanism under discussion. The SEM and TEM results agree well with the suggestion in Scheme 1 and the UV-vis spectroscopy indicating color change in Fig. 1.
Cyclic voltammetry (CV) investigations of the proposed AgNPs were achieved and depicted in Fig. S4A.† The CV response of pure AHNDMS solution in pH 9.4 (curve (a)) shows a clear anodic peak at 0.315 V. The reaction solution of AHNDMS with AgNO3 at pH 9.4 (curve (b)) exhibits a CV response with two anodic and cathodic peaks at 0.365 V and −0.103 V, respectively, which may be due to the formation of AgNPs by AHNDMS, corresponding to the change from colorless AgNO3 to a yellow brownish solution in Fig. 1. CV response of AgNPs/PABA at pH = 9.4 (curve (c)) reveals a distinct cathodic peak at 0.048 V, possibly because of the functionalization of capped AgNPs with PABA by ligand exchange interaction. On introducing NO2− to the proposed sensor at pH 9.4, the color of the solution changed to pinkish red, and its CV response (curve (d)) shows two peaks, viz., anodic and cathodic at 0.820 V and −0.42 V, respectively, which are expected to be due to the aggregation of AgNPs by the same reasons we have suggested before, corresponding to the solution color change from brownish yellow to pinkish red in Fig. 1 and agreeing with the suggested mechanism in Scheme 1.
A Differential Pulse Voltammetry measurement was performed for further confirmation of the proposed sensor. As illustrated in Fig. S4B,† the curve of pure AHNDMS exhibits no visible current-sensitive peaks, indicating a shortage of species for a redox reaction (curve (a)). After reduction of AgNO3 to AgNPs by AHNDMS (curve (b)), five current-sensitive wavy peaks appeared due to an increase in the species by redox reaction, which corresponds to the change of the colorless AgNO3 solution to the brownish yellow color of AgNPs, as shown in Fig. 1. These five wave currents drastically increased after AgNPs were functionalized with PABA (curve (c)). Moreover, two of these peaks disappeared, while another two remained without a change in current, and the remaining peak's current increased drastically, which indicates the aggregation of AgNPs when the target NO2− ion was introduced to the sensor (curve (d)), which corresponded to the color change from brownish yellow to pinkish red in Fig. 1. This result also supports the mechanism we suggested in Scheme 1.
Effects of different conditions leading to inappreciable sensing and detection of nitrite ions by the proposed colorimetric sensor were investigated. As displayed in Fig. S5,† in the pH range of 7.2 to 13, 0.5 mL volume of buffer solution was added to a series of fixed nitrite concentrations in the sensor, with final volume of 3 mL in the calibrated tubes. The maximum absorption with good linearity was obtained at pH 9.4 when the absorption at 532 nm was plotted against the pH value in Fig. S5A.† Variation in the absorption value of color was observed between 2 min and 45 min with the addition of buffer solution to a series of fixed nitrite amounts and 0.5 mL of synthesized AgNPs in a 3 mL volumetric tube. The maximum absorption value at 532 nm with good linearity was observed after 35 minutes, as shown in Fig. S5B.† The concentration effect of PABA functionalization with AgNPs on the absorption value was studied by changing the PABA concentrations from 1.5 mM to 22 mM, as shown in Fig. S5C,† by plotting absorption values at 532 nm against PABA concentrations. It was demonstrated that the maximum absorption with good linearity was with 7 mM of PABA. Finally, the effect of hydrochloric acid used for dissolving PABA for functionalization of AgNPs was studied by using different concentrations of hydrochloric acid ranging from 16 mM to 160 mM; it was observed that the maximum absorption at 532 nm with good linearity was with 80 mM HCl (Fig. S5D†).
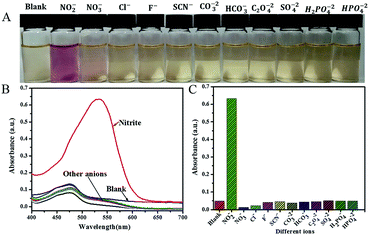
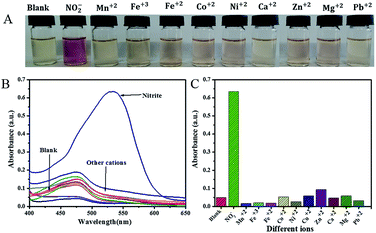
The selective colorimetric investigation of the proposed method towards NO2− (1 ppm equal 2.17 × 10⁻⁵ M) was studied by the addition of metal and other ions (anions and cations) at concentrations of 1000 μM (except for manganese (Mn2+), iron(II) (Fe2+), and iron(III) (Fe3+), which were at 200 μM) to the detection solution under optimized conditions. As seen in Fig. 5A, for anions after their addition to the sensing solution, no change was observed in the color of the sensing solution, while there was a distinct change from brownish yellow to pinkish red observed after addition of NO2−. Additionally, no change in the intensity of the peak of the precursor AgNPs in the presence of other anions was observed, while the addition of nitrite ion resulted in the appearance of a new peak with maximum absorption value at 532 nm (Fig. 5B). These color changes are confirmed in Fig. 5C as a histogram curve by plotting the absorption values at 532 nm against the anions added. Moreover, when some cation additions were investigated, no visible color changes (Fig. 6A), no shifts in the position of the original peak of AgNPs (Fig. 6B) and no significant changes in the absorption (Fig. 6C) were observed with any ions except with nitrite ions. For the ions with concentration of 1000 μM and higher, there is no change during sensing with the proposed sensor, and the color remains clear brownish yellow. However, on addition of ions Mn2+, Fe2+, and Fe3+ at concentrations more than 200 μM to the sensing solution, the color intensity of the sensing solution increased. These results indicate that our proposed sensor has good selectivity for nitrite ions among many common ions.
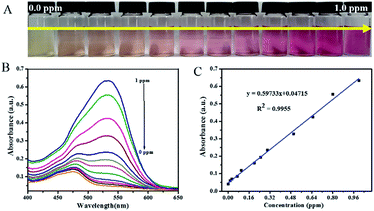
UV-vis absorption spectrum of the functionalized AgNPs in the presence of nitrite ions with different concentrations under the optimized conditions was recorded. The proposed sensor displayed a good analytical performance for nitrite analysis. The color changes of the present system in the absence and the presence of varying amounts of nitrite ions were carefully studied. As depicted in Fig. 7A, a distinct color change from dark to light pinkish red color with the increase in nitrite ion concentration from 0 to 1 ppm is observed. More importantly, the obtained optical change can be sensitively visualized by the naked-eye and is sufficient for analysis purpose. Fig. 7B illustrates that the absorbance at 532 nm gradually increased with the increase in concentration of the nitrite ions. The absorption values exhibited a good linear correlation with the concentration of nitrite ions in the range of 0.016–1 ppm (Fig. 7C). The regression equation is A = 0.59733 (ppm) + 0.04715 with a correlation coefficient of 0.9955. The detection limit of nitrite ion was calculated to be 0.0069 ppm or 0.149 μM (three measurements for each concentration) by UV-vis spectroscopy and 0.016 ppm or 0.348 μM by the naked-eye. Such performance characteristics suggested the potential use of the as-proposed colorimetric method for nitrite ion sensing.
In order to evaluate the appropriateness and unique properties of the proposed method, including rapid response, good selectivity, and sensitivity for nitrite ions, it was applied for the detection of nitrite ions in deionized water, tap water, and yellow river water. Different known amounts of nitrite ion solutions were directly spiked into the three real samples. The analyses results are summarized in Table 1. The average recoveries of the nitrite ion were in the range of 82.67–104.05% for all spiked samples with low relative standard deviations (0.13–3.26%). This result indicates that such a method is applicable to the quantification of nitrite ions in various aqueous solutions.
| Sample | Nitrite added/ppm | Nitrite found/ppm | Recovery % | RSD % n = 3 |
|---|---|---|---|---|
| Deionized water | 0.5 | 0.46 | 92.30 | 0.74 |
| 1 | 0.96 | 95.70 | 0.14 | |
| 2 | 1.81 | 90.63 | 0.13 | |
| Tap water | 0.5 | 0.41 | 82.67 | 1.14 |
| 1 | 0.91 | 90.50 | 0.32 | |
| 2 | 1.88 | 99.50 | 3.26 | |
| Yellow river water | 0.5 | 0.52 | 104.05 | 0.24 |
| 1 | 0.93 | 93.10 | 0.46 | |
| 2 | 1.87 | 93.63 | 0.22 |
4 Conclusions
In summary, a simple and rapid colorimetric sensor, with good selectivity and sensitivity, based on aggregation of AgNPs was synthesized and stabilized by AHNDSM for the first time. Following functionalization with PABA, the aggregation of brownish yellow AgNPs caused the appearance of pinkish red color with a maximum absorption at 532 nm. The color change happened only when a specific concentration of the nitrite ions was added into the AgNPs solution at optimized conditions. The proposed method has been successfully applied for the colorimetric determination of nitrite ions, and it has been shown to be potentially useful for nitrite ion detection in real aqueous samples. The reagents are cheap and easily available. The developed color is stable for several days.Conflicts of interest
There are no conflicts to declare.Acknowledgements
We gratefully acknowledge the financial support from National Natural Science Foundation of China (Grants: 21665023, 21575115, 21327005, 21565021) and program for Chang Jiang Scholars, Ministry of Education, China (Grant No. IRT-16R61, 2017D-01) the Program of Innovation and Entrepreneurial for Talent, Lanzhou, Gansu province, China (Grant No. 2014-RC-39).Notes and references
- Y. Xiong, M. Li, H. Liu, Z. Xuan, J. Yang and D. Liu, Nanoscale, 2017, 9, 1811–1815 RSC.
- V. J. Sieben, C. F. Floquet, I. R. Ogilvie, M. C. Mowlem and H. Morgan, Anal. Methods, 2010, 2, 484–491 RSC.
- J. A. Camargo and Á. Alonso, Environ. Int., 2006, 32, 831–849 CrossRef CAS PubMed.
- R. Michalski and I. Kurzyca, Pol. J. Environ. Stud., 2006, 15, 1230–1485 Search PubMed.
- A. Hatamie, M. Nassiri, M. D. Alivand and A. Bhatnagar, Talanta, 2018, 176, 156–164 CrossRef CAS PubMed.
- Z. Yilong, Z. Dean and L. Daoliang, Int. J. Electrochem. Sci., 2015, 10, 1144–1168 Search PubMed.
- S. M. Mali, P. P. Chavan, Y. H. Navale, V. B. Patil and B. R. Sathe, RSC Adv., 2018, 8, 11177–11185 RSC.
- Y. Ye, Y. Guo, Y. Yue and Y. Zhang, Anal. Methods, 2015, 7, 4090–4096 RSC.
- Y.-H. Zhan, R. Sun, W.-J. Zhu, Y.-J. Xu and J.-F. Ge, Sens. Actuators, B, 2017, 240, 1283–1290 CrossRef CAS.
- M. F. Salama, A. Abbas, M. M. Darweish, A. A. El-Hawwary and M. M. Al-Gayyar, Pharm. Biol., 2013, 51, 1435–1443 CrossRef PubMed.
- T. A. Stueckle, D. C. Davidson, R. Derk, P. Wang, S. Friend, D. Schwegler-Berry, P. Zheng, N. Wu, V. Castranova and Y. Rojanasakul, Nanotoxicology, 2017, 11, 613–624 CrossRef CAS PubMed.
- H. Zhang, S. Qi, Y. Dong, X. Chen, Y. Xu, Y. Ma and X. Chen, Food Chem., 2014, 151, 429–434 CrossRef CAS PubMed.
- H. Yang and H. Cheng, Sep. Purif. Technol., 2007, 56, 392–396 CrossRef CAS.
- M. Aristoy, M. Reig and F. Toldrá, Adv. Food Diagn., 2017, 229–251 Search PubMed.
- S. Chamandust, M. R. Mehrasebi, K. Kamali, R. Solgi, J. Taran, F. Nazari and M.-J. Hosseini, Int. J. Food Prop., 2016, 19, 1983–1993 CrossRef CAS.
- K. D. Bahadur and D. Anjeeta, Int. Res. J. Environ. Sci., 2014, 3, 64–69 CAS.
- K. D. Bahadur and B. Badri, Res. J. Chem. Sci., 2014, 2231, 606X Search PubMed.
- K. Zhang, Y. Hu and G. Li, Talanta, 2013, 116, 712–718 CrossRef CAS PubMed.
- J. Chen, S. Pang, L. He and S. R. Nugen, Biosens. Bioelectron., 2016, 85, 726–733 CrossRef CAS PubMed.
- G.-P. Cao, R.-Y. Yang, Y.-F. Zhuang, D. Zuo and Y.-H. Wang, Anal. Bioanal. Chem., 2017, 409, 4637–4646 CrossRef CAS PubMed.
- A. A. Chetty and S. Prasad, Food Chem., 2016, 197, 503–508 CrossRef CAS PubMed.
- S. Wang, K. Lin, N. Chen, D. Yuan and J. Ma, Talanta, 2016, 146, 744–748 CrossRef CAS PubMed.
- H. Abdolmohammad-Zadeh and E. Rahimpour, Talanta, 2015, 144, 769–777 CrossRef CAS PubMed.
- Z. Lin, W. Xue, H. Chen and J.-M. Lin, Anal. Chem., 2011, 83, 8245–8251 CrossRef CAS PubMed.
- S. Yang and M. E. Meyerhoff, Electroanalysis, 2013, 25, 2579–2585 CrossRef CAS PubMed.
- J. Davis, M. J. Moorcroft, S. J. Wilkins, R. G. Compton and M. F. Cardosi, Analyst, 2000, 125, 737–742 RSC.
- W. Liu, Z. Du, Y. Qian and F. Li, Sens. Actuators, B, 2013, 176, 927–931 CrossRef CAS.
- W. He, L. Luo, Q. Liu and Z. Chen, Anal. Chem., 2018, 90, 4770–4775 CrossRef CAS PubMed.
- I. Abdulazeez, C. Basheer and A. A. Al-Saadi, J. Mol. Liq., 2018, 264, 58–65 CrossRef CAS.
- F. Salimi, M. Kiani, C. Karami and M. A. Taher, Optik, 2018, 158, 813–825 CrossRef CAS.
- B. Kaur, N. Kaur and S. Kumar, Coord. Chem. Rev., 2018, 358, 13–69 CrossRef CAS.
- N. Adarsh, M. Shanmugasundaram and D. Ramaiah, Anal. Chem., 2013, 85, 10008–10012 CrossRef CAS PubMed.
- X. Chen, S. Yu, L. Yang, J. Wang and C. Jiang, Nanoscale, 2016, 8, 13669–13677 RSC.
- M. H. Ibrahim, Z. Xue, M. I. Shinger, H. I. Abdu, L. Xiong, D. Shan and X. Lu, Spectrochim. Acta, Part A, 2018, 1386–1425 Search PubMed.
- Y. Wang, C. Zhang, X. Chen, B. Yang, L. Yang, C. Jiang and Z. Zhang, Nanoscale, 2016, 8, 5977–5984 RSC.
- Z. Xue, X. Fu, H. Rao, M. H. Ibrahim, L. Xiong, X. Liu and X. Lu, Talanta, 2017, 174, 667–672 CrossRef CAS PubMed.
- J. Zhang, L. He, P. Chen, C. Tian, J. Wang, B. Liu, C. Jiang and Z. Zhang, Nanoscale, 2017, 9, 1599–1606 RSC.
- Q.-H. Wang, L.-J. Yu, Y. Liu, L. Lin, R.-g. Lu, J.-p. Zhu, L. He and Z.-L. Lu, Talanta, 2017, 165, 709–720 CrossRef CAS PubMed.
- S. S. Ravi, L. R. Christena, N. SaiSubramanian and S. P. Anthony, Analyst, 2013, 138, 4370–4377 RSC.
- H. Li, Z. Cui and C. Han, Sens. Actuators, B, 2009, 143, 87–92 CrossRef.
- N. Nath and A. Chilkoti, Anal. Chem., 2002, 74, 504–509 CrossRef CAS PubMed.
- A. M. Idris, M. I. Shinger, S. Barkaoui, K. Khan, H. I. Abdu, M. M. Edris and X. Lu, Mater. Res. Bull., 2018, 102, 100–107 CrossRef CAS.
- V. V. Kumar and S. P. Anthony, RSC Adv., 2014, 4, 64717–64724 RSC.
- P. Vasileva, T. Alexandrova and I. Karadjova, J. Chem., 2017, 2017, 2090–9063 CrossRef.
- B. Roy, P. Bairi and A. K. Nandi, Analyst, 2011, 136, 3605–3607 RSC.
- V. V. Kumar and S. P. Anthony, Sens. Actuators, B, 2014, 191, 31–36 CrossRef.
- Y.-r. Ma, H.-y. Niu and Y.-q. Cai, Chem. Commun., 2011, 47, 12643–12645 RSC.
- G. Wu, C. Dong, Y. Li, Z. Wang, Y. Gao, Z. Shen and A. Wu, RSC Adv., 2015, 5, 20595–20602 RSC.
- U. B. Patel, V. N. Mehta, M. A. Kumar and S. K. Kailasa, Res. Chem. Intermed., 2013, 39, 771–779 CrossRef CAS.
- W. L. Daniel, M. S. Han, J.-S. Lee and C. A. Mirkin, J. Am. Chem. Soc., 2009, 131, 6362–6363 CrossRef CAS PubMed.
- N. Xiao and C. Yu, Anal. Chem., 2010, 82, 3659–3663 CrossRef CAS PubMed.
- Z. Chen, Z. Zhang, C. Qu, D. Pan and L. Chen, Analyst, 2012, 137, 5197–5200 RSC.
- V. V. Kumar and S. P. Anthony, Anal. Chim. Acta, 2014, 842, 57–62 CrossRef CAS PubMed.
- J. A. Jacob, H. S. Mahal, N. Biswas, T. Mukherjee and S. Kapoor, Langmuir, 2008, 24, 528–533 CrossRef CAS PubMed.
- Y. Ma, H. Niu, X. Zhang and Y. Cai, Analyst, 2011, 136, 4192–4196 RSC.
- Y. Shang, D. Gao, F. Wu and X. Wan, Microchim. Acta, 2013, 180, 1317–1324 CrossRef CAS.
- S. S. Gowda, S. Rajasowmiya, V. Vadivel, S. B. Devi, A. C. Jerald, S. Marimuthu and N. Devipriya, Toxicol. In Vitro, 2018, 52, 170–177 CrossRef PubMed.
- P. Mulvaney, Langmuir, 1996, 12, 788–800 CrossRef CAS.
- S. Annur, S. J. Santosa, N. H. Aprilita, N. T. Phuong and N. Van Phuocs, Asian J. Microbiol. Biotechnol. Environ. Sci., 2018, 1, 76–83 Search PubMed.
- Y. Zhou, H. Zhao, C. Li, P. He, W. Peng, L. Yuan, L. Zeng and Y. He, Talanta, 2012, 97, 331–335 CrossRef CAS PubMed.
- Y.-F. Huang, H.-P. Zhu, G.-K. Liu, D.-Y. Wu, B. Ren and Z.-Q. Tian, J. Am. Chem. Soc., 2010, 132, 9244–9246 CrossRef CAS PubMed.
- H.-J. Jeon, S.-C. Yi and S.-G. Oh, Biomaterials, 2003, 24, 4921–4928 CrossRef CAS PubMed.
- C. Jayaseelan and A. A. Rahuman, Parasitol. Res., 2012, 111, 1369–1378 CrossRef PubMed.
- P. Velmurugan, J. Shim, S. Kamala-Kannan, K. J. Lee, B. T. Oh, V. Balachandar and B. T. Oh, Biotechnol. Prog., 2011, 27, 273–279 CrossRef CAS PubMed.
- H. M. Ibrahim, J. Radiat. Res. Appl. Sci., 2015, 8, 265–275 CrossRef.
- C.-P. Gong, S.-C. Li and R.-Y. Wang, J. Photochem. Photobiol., B, 2018, 183, 137–141 CrossRef CAS PubMed.
- M. Govarthanan, T. Selvankumar, K. Manoharan, R. Rathika, K. Shanthi, K.-J. Lee, M. Cho, S. Kamala-Kannan and B.-T. Oh, Int. J. Nanomed., 2014, 9, 1593 CrossRef PubMed.
Footnote |
| † Electronic supplementary information (ESI) available: From Fig. S1 to S5. See DOI: 10.1039/c8na00146d |
| This journal is © The Royal Society of Chemistry 2019 |

