 Open Access Article
Creative Commons Attribution 3.0 Unported Licence
Polycrystalline to preferred-(100) single crystal texture phase transformation of yttrium iron garnet nanoparticles†
Rameshwar B.
Borade
 a,
Sagar E.
Shirsath
 *b,
Gaurav
Vats
 b,
Anil S.
Gaikwad
c,
S. M.
Patange
d,
S. B.
Kadam
e,
R. H.
Kadam
*d and
A. B.
Kadam
a
aDepartment of Physics, Jawahar Art Science and Commerce College, Andur, Osmanabad, 413601, MS, India
bSchool of Materials Science and Engineering, University of New South Wales, Kensington, Sydney, NSW 2052, Australia. E-mail: shirsathsagar@hotmail.com; Tel: +61 469029171
cDepartment of Physics, Vivekanand College, Aurangabad 431001, MS, India
dDepartment of Physics, Materials Science Research Laboratory, Shrikrishna Mahavidyalaya, Gunjoti, Osmanabad 413613, MS, India. E-mail: ram111612@yahoo.co.in; Tel: +91 9423450152
eDepartment of Physics, L.B.S. College, Partur, Jalna, 431501, MS, India
First published on 17th September 2018
Abstract
Nanocrystalline Ce-substituted yttrium iron garnet (YIG) powders of different compositions, Y3−xCexFe5O12 (0 ≤ x ≤ 2.0), were synthesized by a combination of sol–gel auto-combustion and solid-state synthesis techniques. The as-obtained powder samples were sintered at 1150 °C for 10 h. The garnet structure formation is confirmed by the X-ray diffraction pattern, which shows that the calculated lattice parameter increased for x = 1.0 and shows a decreasing trend for x ≥ 1.0 with the addition of cerium ions. The lattice parameter increased from 12.38 Å to 12.41 Å for x ≤ 1.0 whereas it decreased from 12.412 Å to 12.405 Å with the cerium composition for x > 1.0. The average particle size determined by high resolution transmission electron microscopy is in the range of 50 to 90 nm and found to increase with the substitution of cerium ions in YIG. The room temperature magnetic parameters such as saturation magnetization, coercivity and remanence magnetization are greatly affected by the substitution of cerium ions. The values of saturation magnetization decrease from 25.5 to 15 emu g−1 whereas coercivity increases from 1 to 28 Oe with the substitution of cerium ions. The pure YIG sample shows polycrystalline nature that changed towards a single-crystal structure leading to a preferred-(100) orientation with the Ce substitution. The change from a ring to a spotty pattern observed in SAED confirmed the crystalline phase transformation and is well supported by HRTEM and magnetic measurements. The behavior of magnetic and electrical properties is well supported by the poly- and single-crystalline nature of YIG and Ce-YIG, respectively. The crystal structure transformation in YIG brought about by Ce substitution could unveil enormous opportunities in the preparation of single-crystal materials from their polycrystalline counterparts.
1. Introduction
The unique properties of single crystals are often different compared to their polycrystalline counterpart. These properties provide numerous opportunities for a variety of applications; however, manufacturing cost often precludes their widespread application. For many unique applications, such as optical lasers and X-ray scintillators, the growth of single crystals is highly complicated owing to the requirement of optimized concentrations and uniform distribution of “active” chemical dopants. It would be revolutionary and highly advantageous if single crystals of a specific compound could be cost-effectively synthesized from their polycrystalline counterpart. The crystal growth method is a common method to fabricate single crystals through solidification known as Bridgman–Czochralski processes.1,2 Controlled abnormal grain growth at one or several sites in the polycrystalline sample at high temperatures is also a promising methodology to grow large-sized single crystals.3–5 Further, the polycrystalline to single crystal growth can be achieved without passing the material through a melting stage denoted as solid-state crystal conversion.6 Though these methods are highly sophisticated and produce good quality single crystal materials, they are time consuming. The present work presents early attempts, results and observations on converting polycrystalline yttrium iron garnet (YIG) into preferred (100)-oriented single crystals with the combination of sol–gel autocombustion and solid-state reaction methods.Polycrystalline YIG is a well-known ferromagnetic material that shows magneto-optic properties and is applicable in different devices, ranging from optical communications to microwave absorbers. Pure and substituted YIG are mainly applicable in microwave devices including circulators, isolators, and phase shifters because of their microwave properties such as relatively low magnetization, low dielectric loss, and narrow line width at GHz frequencies.7,8 YIG crystallizes in the cubic crystal system (space group Oh10la![[3 with combining macron]](https://www.rsc.org/images/entities/char_0033_0304.gif) d) with an edge length of a = 1.24 nm.9 In the crystal structure, tetrahedral 24(d) and octahedral 16(a) sites are occupied by Fe3+ ions (3d5 electronic configuration) in the ratio of 3
d) with an edge length of a = 1.24 nm.9 In the crystal structure, tetrahedral 24(d) and octahedral 16(a) sites are occupied by Fe3+ ions (3d5 electronic configuration) in the ratio of 3![[thin space (1/6-em)]](https://www.rsc.org/images/entities/char_2009.gif) :
:![[thin space (1/6-em)]](https://www.rsc.org/images/entities/char_2009.gif) 2. The dodecahedral 24(c) site is occupied by non-magnetic rare earth Y3+ ions whereas oxygen ions occupy 96(h) sites, and therefore, the chemical equation is [Y33+]c[Fe23+]a(Fe33+)dO12. The fundamental magnetic properties of YIG originate from the orientation of magnetic moments of iron ions. The magnetic moment of two octahedrally situated Fe3+ ions is aligned anti-parallel to that of three tetrahedrally situated Fe3+ ions. On the other hand, non-magnetic Y3+ ions are preferably situated at the dodecahedral site. Hence, the effective magnetic moment is mainly a contribution from the Fe3+ ions of the octahedral (a) and tetrahedral (d) sites with the association of surrounding oxygen (O2−) ions. In the three sites present, various ions can be substituted, and hence, the magnetic properties of YIG can be changed on a large scale. The substitution of Al or Ga ions at tetrahedral sites decreases the saturation magnetization because of the weak ferromagnetic exchange interaction developed between the octahedral a-sites and tetrahedral d-sites. The substitution of Sc or In at octahedral sites increases the magnetization, and the anisotropy can be increased by dodecahedral substitution.10–15 Nevertheless, limited literature has been published on trivalent ion substitution in place of Y3+ ions in YIG systems.16,17
2. The dodecahedral 24(c) site is occupied by non-magnetic rare earth Y3+ ions whereas oxygen ions occupy 96(h) sites, and therefore, the chemical equation is [Y33+]c[Fe23+]a(Fe33+)dO12. The fundamental magnetic properties of YIG originate from the orientation of magnetic moments of iron ions. The magnetic moment of two octahedrally situated Fe3+ ions is aligned anti-parallel to that of three tetrahedrally situated Fe3+ ions. On the other hand, non-magnetic Y3+ ions are preferably situated at the dodecahedral site. Hence, the effective magnetic moment is mainly a contribution from the Fe3+ ions of the octahedral (a) and tetrahedral (d) sites with the association of surrounding oxygen (O2−) ions. In the three sites present, various ions can be substituted, and hence, the magnetic properties of YIG can be changed on a large scale. The substitution of Al or Ga ions at tetrahedral sites decreases the saturation magnetization because of the weak ferromagnetic exchange interaction developed between the octahedral a-sites and tetrahedral d-sites. The substitution of Sc or In at octahedral sites increases the magnetization, and the anisotropy can be increased by dodecahedral substitution.10–15 Nevertheless, limited literature has been published on trivalent ion substitution in place of Y3+ ions in YIG systems.16,17
In the present study, we replaced non-magnetic Y3+ ions with the non-magnetic rare earth Ce3+ ions in YIG and fabricated Y3−xCexFe5O12 (0 ≤ x ≤ 2.0) nanoparticles using a combination of sol–gel auto-combustion and solid-state reaction technique. The effect of Ce3+ substitution on the microstructure and morphological, stoichiometric, magnetic, electrical and dielectric properties of YIG was investigated. An attempt was made to correlate the obtained properties with the polycrystalline and single crystal structure of YIG.
2. Experimental procedure
2.1 Materials
Ce-Substituted YIG (Y3−xCexFe5O12; x = 0.0, 0.5, 1.0, 1.5, 2.0) materials were synthesized from yttrium(III) nitrate hexahydrate [Y(NO3)3·6H2O] (Sigma-Aldrich, 99.9%), cerium(III) nitrate hexahydrate [Ce(NO3)3·6H2O] (Acros, 99.9%), ferric(III) nitrate nonahydrate [Fe(NO3)3·9H2O] (Acros, 99.9%), and citric acid monohydrate (Acros, 99.9%). Aqueous ammonia (NH3) solution was used to maintain the pH of the stoichiometric mixture.2.2 Sample preparation
The precursor solution of pure YIG and Ce-substituted YIG was prepared by adding stoichiometric amounts of the nitrates and citric acid to 100 mL distilled water until 0.25 mol L−1 concentration. Citric acid as a fuel is used to chelate the ions in the aqueous solution. For making the sol neutral, ammonia in aqueous form was added dropwise continuously to the precursor solution to maintain the pH value at about 7. This solution was mixed comprehensively using a magnetic agitator until complete dissolution and heated at 90 °C for evaporation till the gel formation. The dissolution was complete in 2 h and the gel solution formed in 3 h. Again, this was dried at around 250 °C for the ignition of the gel and conversion into ash. The annealing temperature confirmed by thermogravimetric analysis/differential thermal analysis (TG/DTA) of the middle sample (x = 1.0) at room temperature using a thermal analyzer, model SDT Q600, was up to 1200 °C. All samples and pellets (x = 0.0, 0.5, 1.0, 1.5, 2.0) were annealed at 1150 °C for 10 h which were used for further study. The temperature was ramped from room temperature to 1150 °C at a heating rate of 5 °C min−1. In this work high temperature post-annealing is used for solid-state synthesis.The chemical reactions of these mixtures forming YIG and Ce-substituted YIG are as follows:
| 3Y(NO3)3·6H2O + 5Fe(NO3)3·9H2O + 8C6H8O7·H2O → 3YC6H5O7 + 5FeC6H5O7 + 24HNO3 + 71H2O | (1) |
| 3YC6H5O7 + 5FeC6H5O7 + O2 → Y3Fe5O12 + 20H2O + 48CO2↑ | (2) |
| (3 − x)Y(NO3)3·6H2O + xCe(NO3)3·6H2O + 5Fe(NO3)3·9H2O + 8C6H8O7·H2O → Y3−xCexFe5O12 | (3) |
2.3 Characterization
The phase identification and crystallographic properties of YIG and Ce-substituted YIG powders were investigated using an Ultima-IV Rigaku X-ray diffractometer (XRD) with CuKα radiation, λ = 1.5404. Field emission scanning electron microscopy (FE-SEM; JEOL JSM-6360, MIRA-3 LMH) was employed to investigate the microstructures of the sintered samples. Elemental compositions were estimated using (x-act with INCA and AZtec EDS analysis software) X-ray electron diffraction analysis (EDAX). The particle size of the prepared nanoparticles was estimated by transmission electron microscopy (TEM; Philips CM-200). The magnetic measurements of the prepared samples were carried out using a vibrating sample magnetometer (VSM) at room temperature with the application of 0–2 T magnetic fields. Dielectric properties with an applied frequency were measured using an LCR-Q meter. The temperature dependent DC resistivity was studied by using a two-probe technique.3. Result and discussion
3.1 Thermal analysis
Thermogravimetric and differential thermal analysis (TG/DTA) of the as-combusted composition Y3−xCexFe5O12 (x = 1.0) from room temperature to 1200 °C was carried out in air atmosphere with a heating rate of 10 °C min−1. To investigate the probable temperature of decomposition and the phase, a combined, TG/DTA, plot of the Y2Ce1Fe5O12 composition is shown in Fig. 1. The TGA plot of the as-combusted powder synthesized by the sol–gel auto-combustion technique is classified into three steps from room temperature to 1200 °C. The first step ranging from room temperature to 250 °C corresponds to the dehydration of absorbed water. The weight loss observed in TGA in the temperature range of 250–600 °C is related to the evaporation of the residual carbon-containing compound and citric acid. The weight loss observed in the temperature range of 600–1200 °C is attributed to the decomposition of residual nitrates of [Y(NO3)3·6H2O], [Ce(NO3)3·6H2O] and [Fe(NO3)3·9H2O] starting materials. A total weight loss of 6% is observed in the investigated temperature range of 25–1200 °C. There are no endothermic and exothermic peaks in the temperature range from 30 °C to 1200 °C as observed from the DTA plot. The decomposition was complete at around 1100 °C, and therefore we selected 1150 °C as the sintering temperature for the Y3−xCexFe5O12 (x = 0.0, 0.5, 1.0, 1.5, 2.0) system. The XRD analysis confirmed the synthesis of highly crystalline Ce-substituted YIG at 1150 °C.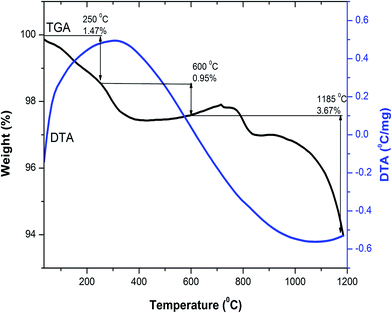 | ||
| Fig. 1 Combined differential thermal analysis (DTA) and thermogravimetric analysis (TGA) curves of Y2Ce1Fe5O12 composition. | ||
3.2 Structural analysis
Rietveld refinement of the XRD pattern was carried out to investigate the structural changes in YIG brought about by Ce substitution. Rietveld-refined XRD patterns of the three samples are presented in Fig. 2 and the as-obtained XRD patterns of all the samples are given in the ESI (Fig. S1†). The Rietveld refinement parameters such as discrepancy factor (Rwp), expected values (Rexp) and goodness-of-fit factor (χ2) are presented in Table 1. The obtained peaks (400), (420), (332), (422), (521), (532), (444), (640), (642), (800), (840), (842) and (644) are in good agreement with the standard JCPDS #43-0507 data of YIG. The obtained XRD patterns exhibit single phase cubic YIG and the nanoparticles crystallize in the bcc structure. The main peak (420) of pure YIG is located at 2θ = 32.31° and it shifts slightly towards lower diffraction angles as Ce3+ content increases. Importantly, it has been observed that the intensity of the (400) peak increased whereas the intensity of the (420) peak decreased with the Ce3+ substitution. This variation in the peak intensity is an indication of phase changeover from polycrystalline (420) to preferred-(100) texture (400). This preferred-(100) texture phase transformation is also supported by the gradual peaking behavior of the (800) peak at 59.12° with the increase of Ce composition in YIG. The increase in (400) and (800) peak intensity is related to Ce substitution that could affect the degree of crystallization of YIG. The transformation of YIG from polycrystalline to preferred-(100) orientation may be related to the decrease in crystal plane energy or surface energy of the YIG cubic lattice with the substitution of Ce ions.18,19 Therefore, this transformation may be driven by a reduction in the system’s total anisotropy energy, i.e., Etotal = [(γs + γi)/h] + Mhklε2, where γs, γi and h are the surface energy, interfacial energy and size of particle, respectively.18 The term Mhklε2 is the elastic strain energy density, where ε and Mhkl are the intrinsic residual strain and the biaxial modulus, respectively, which is closely related to the crystallographic direction. However, an in-depth study needs to be carried out in the future to understand this phase transformation. The lattice parameter (a) was calculated by using the following equation:20 | (4) |
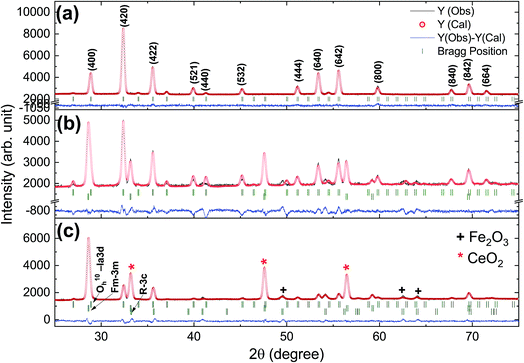 | ||
| Fig. 2 Rietveld-refined XRD patterns of typical samples of Y3−xCexFe5O12 powders annealed at 1150 °C for 10 h; (a) x = 0.0, (b) x = 1.0 and (c) x = 2.0. | ||
| Composition (x) | a ‘Å’ (±0.002) | d xrd ‘nm’ (±3) | d x ‘g cm−3’ (±0.1) | d B ‘g cm−3’ (±0.1) | R exp | R wp | χ 2 |
|---|---|---|---|---|---|---|---|
| 0.0 | 12.376 | 42.69 | 5.1598 | 3.077 | 2.79 | 2.13 | 1.29 |
| 0.5 | 12.391 | 49.51 | 5.3335 | 3.089 | 2.74 | 2.09 | 1.23 |
| 1.0 | 12.412 | 57.63 | 5.5169 | 3.182 | 3.34 | 2.51 | 1.91 |
| 1.5 | 12.409 | 65.58 | 5.6954 | 3.293 | 3.57 | 2.68 | 1.58 |
| 2.0 | 12.405 | 74.34 | 5.8749 | 3.405 | 3.36 | 2.54 | 1.34 |
The diffraction lines shift towards lower diffraction angles indicating that the lattice parameter increases with the substitution of the Ce3+ in YIG. The ionic radii of Ce3+ and Y3+ are 1.02 Å and 0.90 Å, respectively.15 Due to this, an enlargement of the lattice parameter would be expected with the substitution of Ce3+ in place of Y3+. The calculated values for the lattice parameter with Ce content are tabulated in Table 1. The lattice parameter increases for x = 1.0 but after that when x ≥ 1.0, the Ce3+ ions were hardly substituted in place of Y3+ ions at the dodecahedral site and hence the lattice parameter decreases. At higher levels of Ce substitution (x ≥ 0.5), the YIG lattice cannot accommodate Ce ions and therefore secondary phases of CeO2 are observed in the XRD pattern. Apart from CeO2 phases, the Fe2O3 phase also appeared in XRD for x ≥ 1.0, which is an indication of solubility limit of CeO2 in YIG. Also, there is lattice distortion in the structure because of the Ce4+ ions with higher ionic radius occupying the Y3+ ion sites. The values are between 12.37 Å and 12.41 Å, comparable with standard JCPDS data. The grain sizes of the YIG and Ce-substituted YIG nanoparticles were measured from the most intense peaks (400) and (420) of XRD data by the Debye–Scherrer eqn (5).21
 | (5) |
 , where M is the molecular weight of the composition, V is the volume of a unit cell and NA is the Avogadro's number. The bulk density (dB) was calculated using the Archimedes method. Calculated values of X-ray density and bulk density are listed in Table 1, which shows that the X-ray density is directly proportional to the composition of Ce in YIG. The X-ray density is also proportional to the molecular weight of the prepared samples, and the molecular weight of Y3−xCexFe5O12 (x = 0.0, 0.5, 1.0, 1.5, 2.0) was found to increase from 737.93 g mol−1 to 840.35 g mol−1. The existence of the CeO2 phase also promotes the densification of YIG as Ce4+ ions possess high atomic mobility.22–24 It is assumed that the Ce-YIG forms a solid solution throughout the substitution range of Ce ions. The increase in 〈100〉 texture with the Ce substitution increases the possibility of lattice diffusion leading to an increase in the rate of cation inter-diffusion in the solid solution. The particles with a similar orientation try to diffuse together, particularly with the coinciding 〈400〉 lattice facet. Further, grain boundary diffusion is more pronounced in the grain growth as the activation energy for lattice diffusion is higher compared to that for grain boundary diffusion.22 The densification is further confirmed by FE-SEM.
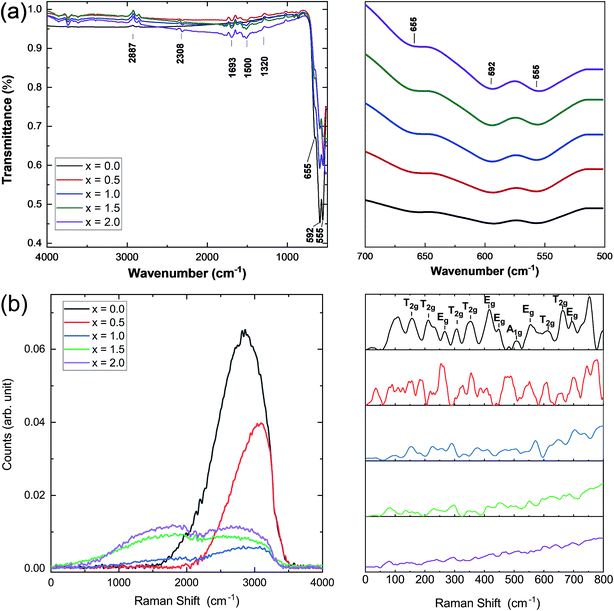
Infrared and Raman spectroscopies were carried out on the prepared samples and the results are presented in Fig. 3. IR spectra were used to identify the band positions (Fig. 3a). It is known that the appearance of the ν1 (≈600 cm−1) band is attributed to the intrinsic vibrations of the octahedral group which are highly influenced by Fe–O distances.25 It has been observed that the bands that appeared at ν1 = 595 cm−1 and 558 cm−1 are slightly shifted to lower band frequencies at 592 cm−1 and 555 cm−1. In this study, the band frequency ν1 slightly decreases with increasing Ce concentration, whereas ν2 remains almost constant. This decrease in ν1 may be attributed to the cerium substitution of yttrium on octahedral sites. Fig. 3b shows the Raman spectra of all the samples under investigation. Well-defined peaks were observed in the Raman spectra which are in good agreement with the cubic YIG phase. (T2g, Eg, and A1g) bands appearing in the range of 300–750 cm−1 are correlated with the internal modes of the free FeO4 tetrahedron.26–28 Raman bands indexed below 300 cm−1 were assigned to the external modes or lattice of polyhedral units; they are called as translations of tetrahedral (24d) and dodecahedral units (24c) and vibration oscillations of FeO4 tetrahedron. They also correspond to internal modes of the Fe3+ polyhedral units characterized by displacements of lighter oxygen ions.29 A marked difference in the Raman spectra of YIG is observed upon Ce substitution and can be related to transformation of YIG from the polycrystalline to single crystalline structure.
3.3 Morphological analysis
The morphology of the prepared Y3−xCexFe5O12 (x = 0.0, 1.0, 2.0) nano-crystalline powder was observed by FE-SEM, and the images of the sintered samples are given in Fig. 4. The average grain sizes are in the range of 200–300 nm. The molecular structural disorder affects the grain size and due to this a larger grain size was observed in the FE-SEM micrograph. Micrographs of the prepared samples show that most of the grains are uniform and due to the magnetic interactions some grains are agglomerated. As the Ce3+ substitution increases, the average grain size decreases. The decrease in grain size could be related to the compression in garnet samples because of the deformation of Fe2+–O2−–Y3+ and Fe2+–O2−–Fe3+. Also, high interfacial surface tension due to a larger surface-to-volume ratio on the nano-scale is observed. The agglomeration is the evidence of high reactivity of the composition, resulting from the magnetic interactions between the nanoparticles. As the Ce3+ substitution increases the percentage of agglomeration of grains also increases i.e. a greater number of particles are agglomerated. It is worth mentioning here that though the grain size decreased with the Ce3+ substitution, these small grains tend to fuse with other grains resulting in an increase in densification.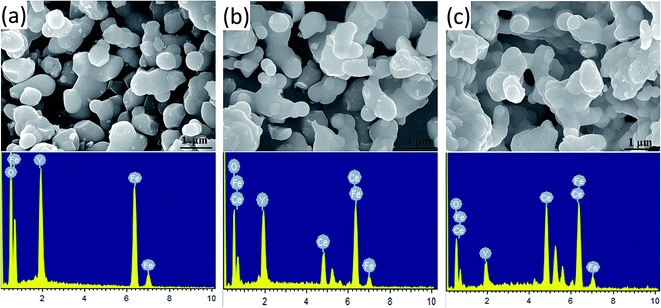 | ||
| Fig. 4 FE-SEM micrographs and the energy dispersive X-ray spectroscopy spectra of Y3−xCexFe5O12, where (a) x = 0.0, (b) x = 1.0 and (c) x = 2.0. | ||
Energy-dispersive analysis of X-ray (EDAX) was employed to confirm the stoichiometric proportions and chemical composition of the selected samples of Y3−xCexFe5O12 garnet nanoparticles. The selected EDAX spectra for x = 0.0, 1.0, 2.0 are presented in Fig. 4. The peaks of the elements Y, Ce, Fe, and O present in the EDAX pattern are evidence that the desired amount of Ce has been substituted in the YIG garnet. The compositional percentages of various elements (Y, Ce, Fe, and O) in the samples were analyzed from the EDAX pattern. The EDAX pattern shows that there is no impurity in pure and Ce-substituted YIG. The pattern indicates that the elements present in Y3−xCexFe5O12 (x = 0.0, 1.0, 2.0) are in good stoichiometric ratios with an error of 3–4%.
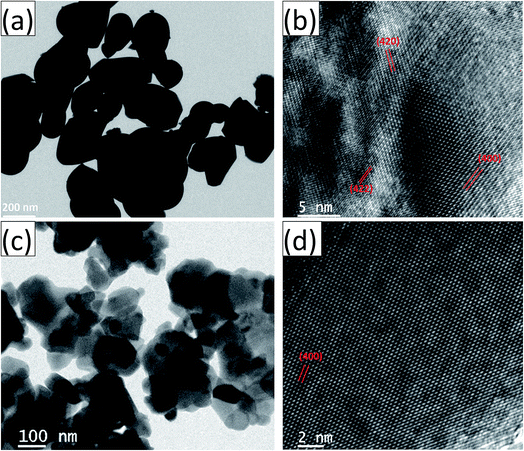
The HRTEM images and the corresponding high magnification images of the undoped and Ce-doped YIG are given in Fig. 5. The determination of the nanoparticles size is difficult due to overlapping of the particles. However, the average particle size of pure YIG and Ce-substituted YIG is estimated to be within the range of 50–90 nm. Fig. 5a and c indicate that the particles are not spherical in shape. This is due to the agglomeration of nanoparticles. The agglomeration occurs due to the magnetic interaction between nanoparticles during the sintering. Well-defined crystalline planes observed in the high magnification images (Fig. 5b and d) confirm the high crystallinity of the prepared sample. The crystalline planes were indexed using the d-spacing between them. It is obvious from Fig. 5b that there is a mixture of various planes, (400), (420) and (422), resulting from the polycrystalline nature of the sample. In contrast, Fig. 5d shows that most of the regions in the image correspond to the (400) plane confirming the preferred single-crystal structure of the sample. Fig. 6a and b show the SAED patterns of the end compositions of Y3−xCexFe5O12 nanoparticles. The SAED patterns are indexed using the d-values and they well support the planes indexed in the XRD pattern. The obtained SAED patterns of pure and substituted YIG are remarkably different from each other. It is a known fact that polycrystalline materials show a ring pattern whereas single crystal materials show a spotty diffraction pattern in SAED. Therefore, the observed SAED patterns analogous with those of the XRD analysis confirm the transformation of pure YIG from polycrystalline nature to preferred (100)-oriented single crystals with the substitution of Ce ions.
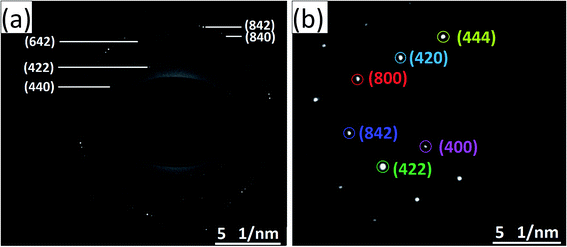 | ||
| Fig. 6 SAED patterns of (a) polycrystalline YIG, x = 0.0, and (b) preferred 〈100〉 oriented single-crystalline Ce-YIG, x = 2.0. | ||
3.4 Magnetic properties
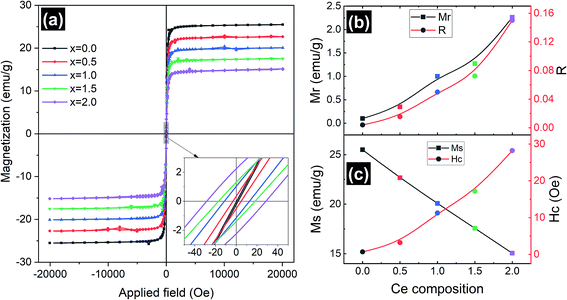
Magnetic measurements of the synthesized Y3−xCexFe5O12 garnet samples were performed by employing a vibrating sample magnetometer by applying a magnetic field up to 2 T at room temperature and the hysteresis loops of all the compositions are presented in Fig. 7. Hysteresis graphs show narrow ‘s’ shaped loops for all the samples which indicate the soft ferromagnetic nature of the samples. Saturation magnetization (Ms) decreased from 25.5 to 15 emu g−1 with the increase of Ce composition. This is due to the substitution of Ce3+ ions in place of Y3+ ions at the dodecahedral site. The Ce3+ ions are known to be paramagnetic and Y3+ is non-magnetic at the c-sites at room temperature, which gives rise to the canted magnetic moment of Fe3+ ions situated at the d-sites. Further, the appearance of the CeO2 phase in the XRD indicates the existence of Ce4+ ions which are non-magnetic in nature compared to paramagnetic Ce3+ ions. Further, excessive concentration of cerium results in the formation of diamagnetic Ce4+ ions. Electrons are absent in the 4f shell of Ce4+ ions and hence CeO2 is formed, which is non-magnetic in nature. The oxygen ions are reduced and Fe3+ is converted into Fe2+. Hence, magnetic properties decrease with increasing cerium composition. The grain size, cation substitution, and super-exchange interactions collectively determine the magnetic properties of garnet materials. In all iron garnets, Fe3+(a)–O2−–Fe3+(d) gives the strongest super-exchange interactions. The microscopic structure distortion of a- and d-sites is due to the large ionic radius of doped Ce3+ ions, which decreases super-exchange interaction and Ms. The magnetic parameters such as coercivity (Hc), remanence magnetization (Mr) and remanence/squareness ratio (Mr/Ms = R) extracted from the MH loops are presented in Fig. 7b and c. It is observed that remanence magnetization and coercivity of samples are very low confirming the soft magnetic nature of the Ce-YIG samples. It can be observed from Fig. 7c and the inset of Fig. 7a that Hc increases with the substitution of Ce and can be correlated with the increase in densification. The substitution of Ce in the YIG structure could also increase the magnetocrystalline, shape and magnetoelastic anisotropies causing an increase in coercivity. The values of Hc increased as cerium concentration increased because the grain size of the samples decreased. Importantly, Mr and R increased considerably with the increase in Ce3+ substitution and can be related to the preferred 〈100〉 texture orientation i.e. the transformation from poly- to single-crystalline nature of YIG. The increase in R with the transformation of YIG is an indication that 〈100〉 is the direction of magnetic easy axis of Ce-YIG.3.5 Electrical properties
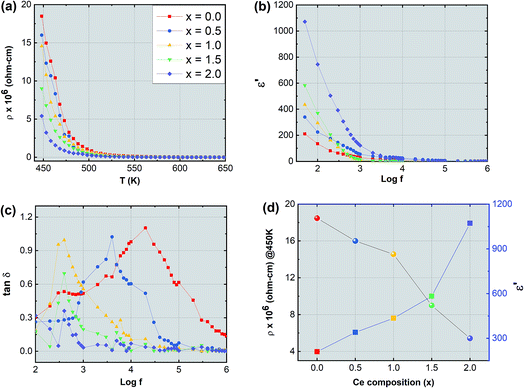
The synthesized nanoparticles of the Y3−xCexFe5O12 garnet were compacted into a circular disc pellet form using a hydraulic press of dimensions ∼10 mm × 3 mm for the measurement of electrical properties by applying silver paste on both sides of the pellet for good electrical contact. Measurement of DC resistivity for all samples was carried out with a heating rate of 2 °C min−1 in the temperature range from 300 to 700 K. Fig. 8a reflects the variation of electrical DC resistivity as a function of temperature of all samples under investigation. Logarithm of resistivity vs. temperature plots for all the samples are presented in ESI Fig. S2.† The electrical DC resistivity decreases with the increase in temperature, which indicates that the Ce3+-substituted YIG systems possess a semiconductor-type behavior. This is in accordance with the hopping conduction mechanism where the drift mobility of electron and hole charge carriers increases with temperature. The resistivity of the garnet exhibits a Arrhenius-type temperature dependence and is given by the equation , where k is the Boltzmann constant and Eg is the activation energy. The variation of electrical resistivity with Ce composition is shown in Fig. 8d. DC resistivity shows a linear-type behavior with the substitution of Ce3+ ions in YIG, and decreased with the increase in Ce3+ substitution. Increase in bulk density and grain diffusion led to increased possibilities of higher mobility of electrons and vice versa for DC resistivity.
The complex dielectric permittivity of a dielectric substance depends on various aspects such as preparation methods, sintering temperature, microstructure and cation substitutions. Fig. 8b and c show the dielectric permittivity and dielectric loss tangent with applied frequency (50 Hz to 5 MHz) at room temperature for all samples. The dielectric permittivity decreased with applied frequency and indicates dispersion at lower frequency related to the fact that the polarization mechanism process in garnet is similar to the conducting process. Maxwell–Wagner's two-layer model explains this dispersion mechanism at low frequency30,31 in accordance with Koop's phenomenological theory.32 As the frequency increases polarization decreases and remains constant at a particular higher frequency. This can be explained as follows: at higher frequency the alternating electric field does not have any effect on electron exchange between the ferrous (Fe2+) ion and ferric (Fe3+) ion. Further, the dielectric behavior with frequency can be interpreted by using the space charge polarization which occurs because of the existence of larger conducting grains at the insulating grain boundaries.33–38 The conducting grains which are isolated by insulating grain boundaries give rise to space charge polarization. The variation of dielectric permittivity with Ce composition is presented in Fig. 8d. It is observed that the dielectric permittivity increases almost linearly with the increment of Ce composition. This increase in dielectric permittivity in YIG at low frequency and with Ce substitution can be a cumulative effect resulting from various factors such as ferrous (Fe2+) ions, oxygen vacancies, grain boundary defects etc. which give higher value of dielectric constant at lower frequency. In the present study the formation of the CeO2 phase is obvious particularly at higher substitution levels of Ce3+ ions in YIG. This transforms the Ce3+ ions into Ce4+ at the expense of oxygen leading to the creation of many oxygen vacancies in Ce-YIG. Such oxygen vacancies lead to two major possibilities: (i) increase in the electrical conductivity and consequently the dielectric constant and (ii) the transformation of some Fe3+ ions into Fe2+ ions to maintain the charge neutrality. It is a known fact that a material consisting of a higher percentage of Fe2+ ions exhibits a higher dielectric constant. The exchange of electrons among the Fe2+ and Fe3+ gives the local transportation of electrons along the external applied alternating electric field direction that gives the polarization:
| Fe2+ = Fe3+ + e− | (6) |
Further, in the absence of resistive grain boundaries in the Ce-YIG single crystalline type material, the high dielectric constant cannot be attributed to an internal barrier layer capacitor. Therefore, the increase in dielectric constant could be attributed to the (i) electron-pinned defect-dipoles theory, where electron hopping driven by thermal activation in defect clusters leads to high electronic conductivity, polarization and dielectric constant,39,40 and (ii) surface barrier layer capacitor mode that can exist in single crystals.41,42
Fig. 8c illustrates the variation of the dielectric loss tangent (tan![[thin space (1/6-em)]](https://www.rsc.org/images/entities/char_2009.gif) δ) with applied frequency (log
δ) with applied frequency (log![[thin space (1/6-em)]](https://www.rsc.org/images/entities/char_2009.gif) f) of Y3−xCexFe5O12 at room temperature. The graph of frequency-dependent dielectric loss tangent versus frequency shows a maximum for all the compositions under investigation. These maxima appear due to resonance, when the frequency of the external applied alternating electric field coincides with the natural frequency of jumping ions. The maxima can only be observed if the dielectric loss tangent of the material is ωτ = 1 where ω = 2πfmax and τ is the relaxation time. It is observed that as Ce3+ content increases in YIG the maxima shift towards lower frequency and disappear at higher frequency. The maxima height decreases with increasing cerium composition in YIG. The shift of these relaxation maxima with Ce3+ content could be associated with the hopping of charge carriers.43 An increase in the number of Ce3+ ions increases the number of holes that may further contribute as charge carriers in Ce-YIG, and the maxima shift towards lower frequency.
f) of Y3−xCexFe5O12 at room temperature. The graph of frequency-dependent dielectric loss tangent versus frequency shows a maximum for all the compositions under investigation. These maxima appear due to resonance, when the frequency of the external applied alternating electric field coincides with the natural frequency of jumping ions. The maxima can only be observed if the dielectric loss tangent of the material is ωτ = 1 where ω = 2πfmax and τ is the relaxation time. It is observed that as Ce3+ content increases in YIG the maxima shift towards lower frequency and disappear at higher frequency. The maxima height decreases with increasing cerium composition in YIG. The shift of these relaxation maxima with Ce3+ content could be associated with the hopping of charge carriers.43 An increase in the number of Ce3+ ions increases the number of holes that may further contribute as charge carriers in Ce-YIG, and the maxima shift towards lower frequency.
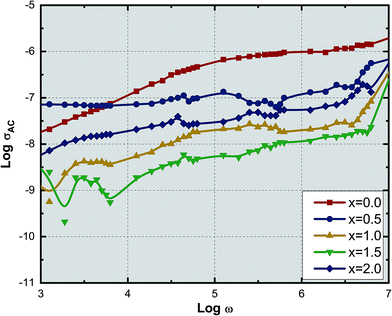
Fig. 9 shows the variation of AC conductivity with frequency as a function of Ce3+ ion substitution in YIG at room temperature. Room temperature AC conductivity was measured with the help of dielectric data using the relation:44
| σAC = ωε0ε′′ | (7) |
4. Conclusions
Ce-Substituted yttrium iron garnet nanoparticles at different concentrations have been obtained from mixed nitrate solutions by a sol–gel auto-combustion technique. The lattice parameter was found to increase with the composition of Ce until x = 1.0 after that it decreases with the further increase of Ce concentration. This is because of the formation of the CeO2 phase for the x > 1.0 composition. The polycrystalline random nature of YIG is slightly shifted towards the preferred-(100) texture with the increase in Ce3+ ions in YIG, which is observed from the change in the intensity ratio between (400) and (420) XRD peaks. The particles with a similar orientation try to diffuse together, particularly with the coinciding 〈400〉 lattice facet, leading to an increase in densification in the Ce-YIG single-crystalline material compared to its polycrystalline counterpart. The transformation from poly- to single-crystalline nature is well supported by the HR-TEM and SAED pattern, where the pure YIG shows a mixture of various planes in contrast to single-crystalline Ce-YIG where most of the regions correspond to the (400) plane confirming the preferred single-crystal structure. Pure YIG shows a ring SAED pattern whereas Ce-YIG shows a spotty diffraction pattern in SAED. Surprisingly the saturation magnetization of single-crystalline Ce-YIG is lower than that of polycrystalline YIG due to the weak ferromagnetic exchange interaction that takes place among the a–d sites and also due to the existence of nonmagnetic CeO2. Importantly, Mr and R increased considerably with the increase in Ce3+ substitution and can be related to the preferred 〈100〉 texture orientation i.e. the transformation from poly- to single-crystalline nature of YIG. The increase in R with the transformation of YIG is an indication that 〈100〉 is the direction of magnetic easy axis of Ce-YIG. DC resistivity decreased whereas dielectric constant increased in single-crystalline Ce-YIG and is attributed to (i) increase in densification, (ii) creation of oxygen vacancies, (iii) transformation of some Fe3+ ions into Fe2+ ions to maintain the charge neutrality, (iv) electron-pinned defect-dipoles, where electron hopping driven surface barrier layer capacitor mode can exist in Ce-YIG single crystals. The transformation of YIG from poly- to single-crystalline nature with the substitution of Ce3+ ions is evidenced by various characterization techniques; however, it is difficult to draw a conclusion on the major driving force behind this transformation and therefore could be a part of future studies.Conflicts of interest
There are no conflicts to declare.References
- S. Mahajan, The role of materials science in microelectronics: past, present and future, Prog. Mater. Sci., 2004, 49, 487–509 CrossRef CAS.
- J. Llorca and V. M. Orera, Directionally solidified eutectic ceramic oxides, Prog. Mater. Sci., 2006, 51, 711–809 CrossRef CAS.
- T. Kusama, T. Omori, T. Saito, S. Kise, T. Tanaka, Y. Araki and R. Kainuma, Ultra-large single crystals by abnormal grain growth, Nat. Commun., 2017, 8, 354 CrossRef PubMed.
- F. J. Humphreys, Recrystallization and Related Annealing Phenomena, Elsevier, 2nd edn, 2004 Search PubMed.
- C.-W. Ahn, A. Rahman, J. Ryu, J.-J. Choi, J.-W. Kim, W.-H. Yoon, J.-H. Choi, D.-S. Park and B.-D. Hahn, Composition design for growth of single crystal by abnormal grain growth in modified potassium sodium niobate ceramics, Cryst. Growth Des., 2016, 16, 6586–6592 CrossRef CAS.
- C. Scott, M. Kaliszewski, C. Greskovich and L. Levinson, Conversion of polycrystalline Al2O3 into single-crystal sapphire by abnormal grain growth, J. Am. Ceram. Soc., 2002, 85, 1275–1280 CrossRef CAS.
- V. G. Harris, Modern microwave ferrites, IEEE Trans. Magn., 2012, 48, 1075–1104 CAS.
- H. Kojima and E. Wohlfarth, in Fundamental Properties of Hexagonal Ferrites, Ferromagnetic Materials', North Holland Publishing Co., Amsterdam, 1982 Search PubMed.
- D. Rodic, M. Mitric, R. Tellgren, H. Rundlof and A. Kremenovic, True magnetic structure of the ferrimagnetic garnet Y3Fe5O12 and magnetic moments of iron ions, J. Magn. Magn. Mater., 1999, 191, 137–145 CrossRef CAS.
- M. Pardavi-Horvath, Microwave applications of soft ferrites, J. Magn. Magn. Mater., 2000, 215, 171–183 CrossRef.
- G. F. Dionne, Magnetic oxides, Springer, New York, 2009 Search PubMed.
- J. H. Han, Y. Y. Wang, Q. H. Yang, G. Y. Wang, F. Pan and C. Song, Spin Hall magnetoresistance in Nb/Y3Fe5O12 hybrids, Phys. Status Solidi RRL, 2015, 9, 371–374 CrossRef CAS.
- D. Song, L. Ma, S. Zhou and J. Zhu, Oxygen deficiency induced deterioration in microstructure and magnetic properties at Y3Fe5O12/Pt interface, Appl. Phys. Lett., 2015, 107, 042401 CrossRef.
- A. Krysztofik, H. Głowiński, P. Kuświk, S. Ziętek, L. E. Coy, J. N. Rychły, S. Jurga, T. W. Stobiecki and J. Dubowik, Characterization of spin wave propagation in (111) YIG thin films with large anisotropy, J. Phys. D: Appl. Phys., 2017, 50, 235004 CrossRef.
- F. Chen, X. Wang, Y. Nie, Q. Li, J. Ouyang, Z. Feng, Y. Chen and V. G. Harris, Ferromagnetic resonance induced large microwave magnetodielectric effect in cerium doped Y3Fe5O12 ferrites, Sci. Rep., 2016, 6, 28206, DOI:10.1038/srep28206.
- A. Arsad and N. Ibrahim, The effect of Ce doping on the structure, surface morphology and magnetic properties of Dy doped-yttrium iron garnet films prepared by a sol–gel method, J. Magn. Magn. Mater., 2016, 410, 128–136 CrossRef CAS.
- I. Yarici, M. Erol, E. Celik and Y. Ozturk, Effect of pH and annealing temperature on the structural and magnetic properties of cerium-substituted yttrium iron garnet powders produced by the sol–gel method, Mater. Sci.-Pol., 2016, 34, 362–367 CAS.
- C. V. Thompson, Structure evolution during processing of polycrystalline film, Annu. Rev. Mater. Sci., 2000, 30, 159–190 CrossRef CAS.
- S. E. Shirsath, X. Liu, Y. Yasukawa, S. Li and A. Morisako, Switching of magnetic easy-axis using crystal orientation for large perpendicular coercivity in CoFe2O4 thin film, Sci. Rep., 2016, 6, 30074, DOI:10.1038/srep30074.
- F. W. Aldbea, N. Ibrahim and M. Yahya, Effect of adding aluminum ion on the structural, optical, electrical and magnetic properties of terbium doped yttrium iron garnet nanoparticles films prepared by sol–gel method, Appl. Surf. Sci., 2014, 321, 150–157 CrossRef CAS.
- R. Kadam, A. Birajdar, S. T. Alone and S. E. Shirsath, Fabrication of Co0.5Ni0.5CrxFe2−xO4 materials via sol–gel method and their characterizations, J. Magn. Magn. Mater., 2013, 327, 167–171 CrossRef CAS.
- S. E. Shirsath, S. S. Jadhav, B. G. Toksha, S. Patange and K. M. Jadhav, Influence of Ce4+ ions on the structural and magnetic properties of NiFe2O4, J. Appl. Phys., 2011, 110, 013914 CrossRef.
- R. L. Coble and T. K. Gupta, in Sintering and Related Phenomena, ed. G. C. Kucznski, N. A. Hroton and C. F. Gibbon, Gordon and Breach, New York, 1967, p. 423 Search PubMed.
- D. Hoeffgen, H. Hopper and I. Monch, Ber. Dtsch. Keram. Ges., 1978, 55, 216 CAS.
- S. E. Shirsath, S. S. Jadhav, B. G. Toksha, S. M. Patange and K. M. Jadhav, Remarkable influence of Ce4+ ions on the electronic conduction of Ni1−2xCexFe2O4, Scr. Mater., 2011, 64, 773–776 CrossRef CAS.
- J.-M. Costantini, S. Miro, F. Beuneu and M. Toulemonde, Swift heavy ion-beam induced amorphization and recrystallization of yttrium iron garnet, J. Phys.: Condens. Matter, 2015, 27, 496001 CrossRef PubMed.
- P. B. A. Fechine, E. N. Silva, A. S. de Menezes, J. Derov, J. W. Stewart, A. J. Drehman, I. F. Vasconcelos, A. P. Ayala, L. P. Cardoso and A. S. B. Sombra, Synthesis, structure and vibrational properties of GdIGX:YIG1−x ferrimagnetic ceramic composite, J. Phys. Chem. Solids, 2009, 70, 202–209 CrossRef CAS.
- L. Fernandez-Garcia, M. Suarez and J. L. Menendez, Synthesis of mono and multidomain YIG particles by chemical coprecipitation or ceramic procedure, J. Alloys Compd., 2010, 495, 196–199 CrossRef CAS.
- J. F. Barron, H. Montiel, V. Gomez-Vidales, A. Conde-Gallardo and G. Alvarez, YIG films through synthesis by means of the polymeric precursor method: correlation between the structural and vibrational properties with magnetic behavior, J. Supercond. Novel Magn., 2017, 30, 2515–2522 CrossRef CAS.
- D. Wood and J. Remeika, Optical absorption of tetrahedral Co3+ and Co2+ in garnets, J. Chem. Phys., 1967, 46, 3595–3602 CrossRef CAS.
- L. Sirdeshmukh, K. K. Kumar, S. B. Laxman, A. R. Krishna and G. Sathaiah, Dielectric properties and electrical conduction in yttrium iron garnet (YIG), Bull. Mater. Sci., 1998, 21, 219–226 CrossRef CAS.
- R. H. Godoi, M. Jafelicci Jr, R. F. Marques, L. C. Varanda and R. C. Lima, Nanometric particles of yttrium ferrite, Quim. Nova, 1999, 22, 783–786 CrossRef CAS.
- D. Ravinder and P. V. B. Reddy, High-frequency dielectric behaviour of Li–Mg ferrites, Mater. Lett., 2003, 57, 4344–4350 CrossRef CAS.
- N. Rezlescu and E. Rezlescu, Abnormal dielectric behaviour of copper containing ferrites, Solid State Commun., 1974, 14, 69–72 CrossRef CAS.
- V. Murthy and J. Sobhanadri, Dielectric properties of some nickel–zinc ferrites at radio frequency, Phys. Status Solidi A, 1976, 36, K133–K135 CrossRef CAS.
- S. Olofa, Oscillographic study of the dielectric polarization of Cu-doped NiZn ferrite, J. Magn. Magn. Mater., 1994, 131, 103–106 CrossRef CAS.
- A. Thakur, P. Mathur and M. Singh, Study of dielectric behaviour of Mn–Zn nano ferrites, J. Phys. Chem. Solids, 2007, 68, 378–381 CrossRef CAS.
- R. Kharabe, R. Devan, C. Kanamadi and B. Chougule, Dielectric properties of mixed Li–Ni–Cd ferrites, Smart Mater. Struct., 2006, 15, N36 CrossRef CAS.
- W. Hu, Y. Liu, R. L. Withers, T. J. Frankcombe, L. Norén, A. Snashall, M. Kitchin, P. Smith, B. Gong, H. Chen, J. Schiemer, F. Brink and J. Wong-Leung, Electron-pinned defect-dipoles for high-performance colossal permittivity materials, Nat. Mater., 2013, 12, 821–827 CrossRef CAS PubMed.
- W. Hu, K. Lau, Y. Liu, R. L. Withers, H. Chen, L. Fu, B. Gong and W. Hutchison, Colossal dielectric permittivity in (Nb + Al) Co doped rutile TiO2 ceramics: compositional gradient and local structure, Chem. Mater., 2015, 27, 4934–4942 CrossRef CAS.
- M. Li, Z. Shen, M. Nygren, A. Feteira, D. C. Sinclair and A. R. West, Origin(s) of the apparent high permittivity in CaCu3Ti4O12 ceramics: clarification on the contributions from internal barrier layer capacitor and sample-electrode contact effects, J. Appl. Phys., 2009, 106, 104106 CrossRef.
- S. Krohns, P. Lunkenheimer, S. G. Ebbinghaus and A. Loidl, Colossal dielectric constants in single-crystalline and ceramic CaCu3Ti4O12 investigated by broadband dielectric spectroscopy, J. Appl. Phys., 2008, 103, 084107 CrossRef.
- N. Rezlescu and E. Rezlescu, Dielectric properties of copper containing ferrites, Phys. Status Solidi A, 1974, 23, 575–582 CrossRef CAS.
- P. Jadhav, M. Shelar and B. Chougule, Synthesis and property measurement of three-phase ME composites, J. Appl. Phys. Res., 2010, 1, 92–99 CAS.
Footnote |
| † Electronic supplementary information (ESI) available. See DOI: 10.1039/c8na00123e |
| This journal is © The Royal Society of Chemistry 2019 |

