
Exploratory metabolomic study to identify blood-based biomarkers as a potential screen for colorectal cancer†
Isaac
Asante
 a,
Hua
Pei
a,
Eugene
Zhou
a,
Siyu
Liu
a,
Darryl
Chui
a,
EunJeong
Yoo
a,
David V.
Conti
b and
Stan G.
Louie
*a
a,
Hua
Pei
a,
Eugene
Zhou
a,
Siyu
Liu
a,
Darryl
Chui
a,
EunJeong
Yoo
a,
David V.
Conti
b and
Stan G.
Louie
*a
aDepartment of Clinical Pharmacy, School of Pharmacy, University of Southern California, CA, USA. E-mail: slouie@usc.edu
bDepartment of Preventive Medicine, Keck School of Medicine, University of Southern California, CA, USA
First published on 5th December 2018
Abstract
Introduction: colorectal cancer (CRC) continues to be difficult to diagnose due to the lack of reliable and predictive biomarkers. Objective: to identify blood-based biomarkers that can be used to distinguish CRC cases from controls. Methods: a workflow for untargeted followed by targeted metabolic profiling was conducted on the plasma samples of 26 CRC cases and ten healthy volunteers (controls) using liquid chromatography-mass spectrometry (LCMS). The data acquired in the untargeted scan was processed and analyzed using MarkerView™ software. The significantly different ions that distinguish CRC cases from the controls were identified using a mass-based human metabolome search. The result was further used to inform the targeted scan workflow. Results: the untargeted scan yielded putative biomarkers some of which were related to the folate-dependent one-carbon metabolism (FOCM). Analysis of the targeted scan found the plasma levels of nine FOCM metabolites to be significantly different between cases and controls. The classification models of the cases and controls, in both the targeted and untargeted approaches, each yielded a 97.2% success rate after cross-validation. Conclusion: we have identified plasma metabolites with screening potential to discriminate between CRC cases and controls.
1 Introduction
Colorectal cancer (CRC) is the third leading cause of cancer-related death in the industrialized world.1 In the United States, CRC is the third most commonly diagnosed cancer, accounting for approximately 50![[thin space (1/6-em)]](https://www.rsc.org/images/entities/char_2009.gif) 000 deaths annually. The annual expenditure for CRC treatment is estimated to be $5.5–$6.5 billion, where inpatient hospital care accounts for about 80% of the total cost.2
000 deaths annually. The annual expenditure for CRC treatment is estimated to be $5.5–$6.5 billion, where inpatient hospital care accounts for about 80% of the total cost.2
CRC evolves as a consequence of uncontrolled intestinal cell proliferation. Early diagnosis of CRC requires highly sensitive and precise detection of the cellular transformational process or while the disease is still in the initial stages exhibiting only local spread. Immediate effective treatment of localized disease is most likely to lead to curative modality.3 Unfortunately, most CRC cases are diagnosed when they are in the late stages of the disease with metastasis, making it harder to achieve complete remission. Furthermore, metastatic disease is associated with low five-year survival despite aggressive treatment strategies.4,5 The development of reliable and predictive biomarkers would be a critical tool to identify individuals with evolving CRC or presence of early disease.
The ability to detect evolving tumorigenesis while transitioning from anaplasia to neoplasia may open the door for preemptive interventions. Also, the capacity to identify early stages of the disease can significantly improve clinical outcomes after immediate and aggressive therapy. Colonoscopy is currently the choice for screening and detecting CRC; however, this invasive procedure is not widely accepted and often avoided. The development of a blood-based molecular biomarker(s) that can reliably identify the potential of CRC development may significantly improve screening compliance. To facilitate the development of such a test, an understanding of the aberrant mechanisms underlining the disease can enable the biomarker development process.
Folates are pteroyl glutamates that serve as the primary methyl carriers essential for two paths of methyl trafficking in the cell, such as DNA replication or repair, and formation of S-adenosyl methionine (SAM) which serves as the primary methyl group donor for the transmethylation reactions in the cells.6 Specific folate metabolites are involved in genomic stability processes. Folate one-carbon metabolism (FOCM) cycle regulates oncogenes and tumor suppressors involved in cancers. This regulation is accomplished by controlling DNA synthesis and methylation. Critical enzymes found in the FOCM cycle have shown to be associated with increased risk for CRC, making this metabolic cycle a good target to probe for in the development of a CRC biomarker.
Some epidemiological studies have evaluated the association between folates and the risk of CRC. Most have found an association between increasing folates intake and decreasing risk of CRC.7–10 Unlike these studies, this study focuses on the metabolites of the FOCM cycle to determine whether their imbalance may be a consequence of metabolic or cellular transitioning. The most reflective measure for FOCM metabolites would be the cellular concentrations, but cellular samples are difficult to obtain and process. To address this challenge, cellular concentrations may be substituted with the extracellular (plasma) concentration as a surrogate for phenotyping the subjects involved and extrapolate any association because there is usually a homeostatic flux between the two systems.
Metabolomics is a powerful tool useful for exploring metabolites (with molecular weight <1800 Da) to characterize the metabolic phenotype of a biological system.11,12 It has extensive applications in biomarker discovery to facilitate disease diagnosis13 and mechanistic dissection of disease pathophysiology.14 Metabolomics approaches may be targeted, untargeted or both. Untargeted metabolomics is commonly considered to facilitate the measure of all endogenous metabolites in the biological samples. One advantage of untargeted analysis is that it offers the opportunity to identify novel targets that may be difficult to identify and characterize. However, the specificity of the metabolites that are detected is dependent on the analytical platform. The limitation of this approach is that analytes of high-abundance are more likely to be detected.15 In contrast, the targeted approach quantifies defined analytes of compatible chemical characteristics and biochemical annotation. This approach optimizes the quantification of analytes of interest thereby reducing any interference from predominant analytes found in the sample. With the emergence of liquid chromatography mass spectrometry (LCMS)-based metabolomics, it is possible to profile and even quantify the metabolites found in a pathway.
In this study, we used untargeted metabolomics followed by the targeted approach to identify biomarkers that may be predictive for the identification of the absence or presence of CRC in the plasma of CRC cases and controls. These biomarkers will facilitate early detection, intervention and decrease CRC-related deaths.
2 Materials and methods
2.1 Ethics, consent and permissions
The research was conducted in compliance with the Declaration of Helsinki. The study protocol was ethically reviewed and approved by the Western and Schulman Institutional Review Boards (United States). Signed informed consent was obtained from all participants in this research.2.2 Study samples
Plasma samples from known CRC cases (26) were compared to that of healthy controls (10). Plasma samples were obtained from a vendor. Participants’ blood was drawn directly into K3EDTA lavender-top tubes and centrifuged at 3000g centrifugation to separate the plasma from the blood cells. The plasma samples were aliquoted into micro centrifuge tubes and frozen with liquid nitrogen. The samples were subsequently stored at −80 °C until analysis. The medication history and medical history of participants were collected. Participants for the healthy control group were excluded if they had any forms of cancer. The demographic characteristics of the patients in this study are summarized in Table 1.| Cases (n = 26) | Controls (n = 10) | p-value | |
|---|---|---|---|
| Age mean (SD) | 64 (13) | 41 (16) | 0.001 |
| Male | 50% | 50% | |
| Tumor stage | |||
| Polyp | 1 (4%) | ||
| Stage 1 | 2 (8%) | ||
| Stage 2 | 7 (27%) | ||
| Stage 3 | 6 (23%) | ||
| Stage 4 | 10 (38%) | ||
2.3 Chemicals and reagents
Analytical grade flavin mononucleotide (FMN), folic acid (FA), pyridoxine (B6), pyridoxal (PL) hydrochloride, pyridoxamine (PM) dihydrochloride, 4-pyridoxic acid (4PA), zinc sulphate, and tris(2-carboxyethyl)phosphine (TCEP) were purchased from Sigma (St Louis, MO, USA); riboflavin (B2) was purchased from Alfa Aesar, and 5-methyltetrahydrofolate (5MTHF), dihydrofolate (DHF) and tetrahydrofolate (THF) were purchased from Cayman Chemicals (Ann Arbor, MI, USA). Methotrexate (MTX), purchased from Enzo Life Sciences (Farmingdale, NY, USA), was used as an internal standard for the assay. The purity of each standard was above 97%, except DHF and THF which were 90% and 95% respectively. Ultrapure HPLC-grade water, LCMS-grade methanol, LCMS-grade acetonitrile and formic acid were purchased from Fisher Scientific (Pittsburg, PA, USA) and were used for sample processing and mobile phase systems. In addition, homocysteine (HCY), methionine (METH), S-adenosyl methionine (SAM), S-adenosyl homocysteine (SAH), deuterated SAH, cystathionine (CYSTH), methylmalonic acid (MMA), and tris(2-carbixyethyl)phosphine (TCEP) were bought from Sigma (St Louis, MO, USA). The deuterated MMA was bought from Medical Isotopes (Pelham, NH, USA).2.4 Sample preparation
To human plasma (50 μL), 50 μL of 30 ng mL−1 MTX was added and thoroughly mixed. The plasma proteins were precipitated with the addition of 400 μL of cold 20% 0.2 M ZnSO4 in methanol and kept at −20 °C for 30 min. The sample was then centrifuged at 9000g for 15 min at 4 °C, after which 400 μL of the supernatant solution was transferred into a new micro centrifuge tube and evaporated to dryness using a steady stream of dried and filtered nitrogen gas at room temperature. The residue was reconstituted using 50 μL of 1% ascorbic acid, where 20 μL was injected onto an LC-MS system linked to a reverse-phase column (Phenomenex Technologies Inc., Torrance, CA). The analytes were separated using gradient mobile phase system consisting of two components. Component A consisted of 0.1% formic acid in water, while component B was 100% acetonitrile.2.5 LCMS data acquisition for targeted and untargeted scan
Analytes of the FOCM (including their metabolites) – B2, FMN, B6, 4PA, PL, PM, FA, DHF, THF, and 5MTHF were targeted during this scan. The samples were analyzed with the targeted approach using a published assay.16The untargeted analysis was conducted with a modification of the targeted assay,16 but separation was achieved with a longer reverse phase Kinetex PFP 100A (75 × 3.0 mm, 2.6 μm) column (Phenomenex Technologies Inc., Torrance, CA) at an extended 33 min gradient. This longer version of the separation was preferred to facilitate better acquisitions of the features and lessen overlap of features acquired at a retention time.
2.6 Quantitation of plasma methylmalonic acid, homocysteine, and related metabolites
The plasma levels of MMA, HCY and its related metabolites in the FOCM were determined using modified procedures from published assays.17,18 The MMA, HCY, METH, SAM, SAH and CYSTH were quantified using these assays. To 50 μL of plasma, 50 μL of 30 ng mL−1 deuterated SAH solution, 25 μL of 200 ng mL−1 deuterated MMA and 25 μL of 0.1 M TCEP were added while working on ice. Ice-cold precipitation solution (350 μL) made up of 20% 0.2 M ZnSO4 in methanol was added, vortexed for 30 seconds and stored at −20 °C for 30 minutes. The sample was then centrifuged at 9000g for 15 minutes at 4 °C. HCY, METH, SAM, SAH and CYSTH were analyzed by transferring 50 μL of the solution transferred into HPLC vials for the injection of 30 μL unto a reverse phase Shimadzu C18 (50 × 4.6 mm, 3 μm) column for LC/MS/MS analysis. The mobile phase consisted of 0.1% formic acid in water as component A and 0.1% formic acid in methanol as component B running at the following gradient conditions: starting at 20% of component B, it was maintained for 1.2 min followed by a linear increase to 80% of component B within 1.3 min, and then it kept at the same condition for 1.5 min. It was followed by a declined to 20%B within 0.5 min. The condition of the column was recovered with a 1.5 min run of 20% of component B. The samples were analyzed using an LCMS system comprising of Shimadzu Prominence HPLC system linked to an API 4000 LC/MS/MS spectrometer (Applied Biosystems, Foster City, CA) operating in the positive mode. The mass spectrometer was set at a source temperature of 350° F; collision gas, 10 psi; curtain gas, 25 psi; ion source gas (1), 40 psi; ion source gas (2), 30 psi; and ion spray voltage, 5500 V.To quantify the plasma MMA levels, 300 μL of the remaining supernatant was transferred into a clean 1.5 mL Eppendorf tube and dried under nitrogen gas. The residue was reconstituted into 30 μL of 15% methanol in water and transferred into HPLC vials for injection of 20 μL unto Gemini C18 (150 × 4.6 mm, 3 μm) column (Phenomenex Technologies Inc., Torrance, CA). During analysis, the LCMS/MS operated in the negative mode with the following settings: source temperature, 350 °C; collision gas, 12 psi; curtain gas, 40 psi; ion source gas (1), 50 psi; ion source gas (2), 20 psi; and ion spray voltage, −3000 V. Chromatographic separation was achieved with an 18.5 min gradient mobile phase system consisting of 0.1% formic acid in water as component A and 0.1% formic acid and 10 mM ammonium formate in methanol as component B. The gradient was as follows: starting at 15% of component B, it was increased to 95% of component B within 6.2 min, and then it kept at the same condition for 3.1 min. It was followed by declining to 15% of component B within 0.2 min. The condition of the column was recovered with an 8 min run of 15%B.
2.7 Data acquisition and processing
000 counts per second and generating 5000 features which were present in at least five samples. Peak finding options were set as follows: subtraction offset, 10 scans; subtraction multiplication factor, 1.3; noise threshold, 100000; minimum spectral peak width, 0.4 Da, minimum retention time peak width, two scans and maximum retention time, 22 min. Peak alignment options were set as follows: retention time tolerance, 0.5 min; mass tolerance, 0.4 Da and maximum number of peaks, 5000. If peaks were found in fewer than five of the samples (17% of all samples), this feature was automatically discarded using a filter setting of MarkerView™. Using raw data, peak area integration was performed on each feature normalizing peak areas with that of the internal standard.
2.8 Statistical analysis
All analyses were performed using the MarkerView™ and SAS 9.4 (SAS Institute Inc., Cary, NC) software. The data was log transformed and further normalized using Pareto normalization settings found in the software. Supervised PCA-DA was conducted on the samples and a Wilcoxon rank sum test was performed on the acquired data at 5% level of significance.19 The kernel smoothing model was used to calculate the misclassification rate for the CRC cases and controls based on the assay.20 The features/ions obtained from the untargeted scan that were significantly different in CRC cases and controls and had more than a 100-fold change in mean intensity for the groups were extracted. These molecular weights of these features were matched with Human Metabolome Database (HMDB; http://www.hmdb.ca) for identification of features of interest. The mass error window for the search was set to 0.2 Da, and the search results manually screened for endogenous metabolites. Features which did not match any endogenous database entry were not considered for further investigation. The positive false discovery rate (FDR) method was used to evaluate the significant features that were obtained by the exploratory untargeted approach.21The plasma concentrations of FOCM analytes in the targeted scan were compared between the CRC cases and controls using a two-tailed Wilcoxon rank sum test. Further, clinically meaningful ratios of metabolites which may give an index of enzymatic activity were also generated and compared between the groups. The ratio of product to reactant metabolites was used to estimate the enzymatic function of some key enzymes in the FOCM. The polyp sample was added to the CRC cases to facilitate analysis. The analyte concentrations that were below the lower limit of quantitation (LLOQ) were substituted with the LLOQ for the analysis. Analyses were done with and without possible outlier sample analyte concentrations.
3 Results
3.1 Data reduction and exploratory analyses
Principal component analysis (PCA) was used for initial unsupervised data exploration using the annotated peaks from LCMS and PCA with discriminant analysis (PCA-DA) was used for supervised analysis. In the case of both targeted and untargeted datasets, there were obviously better clustering of the groups in the supervised compared to the unsupervised analysis. However, controls were clearly clustered from the cases even in the unsupervised PCA.Healthy controls (blue) were well clustered from the CRC cases (red) in the supervised analysis (PCA-DA) as shown in Fig. 1 (and Fig. S1, ESI†). In the unsupervised analysis of the targeted dataset, the first two principal components explained 41.6% of total variance while the first three principal components explained 51.1% of total variance showing how representative the PCA plot is of the original data. When a second stage DA produced plots with discriminants that explained 100% of the variation, for both targeted and untargeted.
 | ||
| Fig. 1 PCA-DA plots showing the clustering the CRC cases (red) from the controls (blue) using either (a and c) untargeted scan or (b and d) targeted scan. The left pane (a and b) shows the loadings of the plasma samples while the right (c and d) shows the loadings of the features/metabolites. | ||
Subsequently, a nonparametric discriminant analysis model was fitted to the principal components (PC) of the untargeted (first four PCs) and the targeted (first six PCs) using kernel smoothing to classify each data batch into CRC cases and controls. The models were validated by re-substitution and cross-validation approaches.20 Both batches of data (targeted and untargeted) produced similar misclassification rates (both total error rate and group error rates). The re-substitution approach yielded a misclassification error of 0% while that of cross-validation was 2.8%. Unlike the cross-validation approach, the re-substituted data are usually part of the model building in the re-substitution approach thereby decreasing the misclassification error.
Unlike the re-substitution, the leave-one-out cross-validation approach can be more reliable in evaluating the accuracy of predicting group membership of a sample by the classifying variables. The procedure is based on repeatedly withholding one sample at a time, and the complementary training set is used for the prediction error estimation. The misclassification or prediction error is calculated by the rate of misclassified samples when predicting for each sample using the training set. This procedure is repeated, leaving out each patient at a time until all patients have been classified and then averaging the prediction error rates over all the possible training sets.
3.2 Putative biomarkers from untargeted approach
We selected 1000 monoisotopic positive ion masses after running a Wilcoxon rank sum test on the 5000 extracted features. The log (p-values) and the log (fold change) of the all the extracted features are represented in the volcano plot (Fig. 2). Feature selection was conducted to select the best predictors for CRC screening and possibly, diagnosis. If a feature which is greater than 100 Da showed a significant difference between CRC patients and controls assessed by satisfactory p-value (p-values less than 0.05) and a fold change greater than 100, the feature was chosen for further identification through matching in the metabolome database annotation. The features that matched an endogenous compound were considered as a putative biomarker for pathway analysis. A total of 225 features fitted the selection criteria for identification in the database. Table 2 presents the 30 candidate features (putative biomarkers) that successfully matched endogenous human metabolome compounds in the database. Some of the putative biomarkers that differentiated between CRC patients and healthy controls were involved in one-carbon metabolism. Using the positive FDR of 5%, the likely biomarkers with strong signals were identified (Table 2). Due to the exploratory nature of this untargeted approach, the targeted approach was performed as a confirmatory analysis with guidance from the complementary untargeted approach. The metabolites for the targeted analysis were decided based on the fact that most of the significant features in the untargeted analysis were linked to the FOCM and scientific literature supports the links between FOCM and CRC.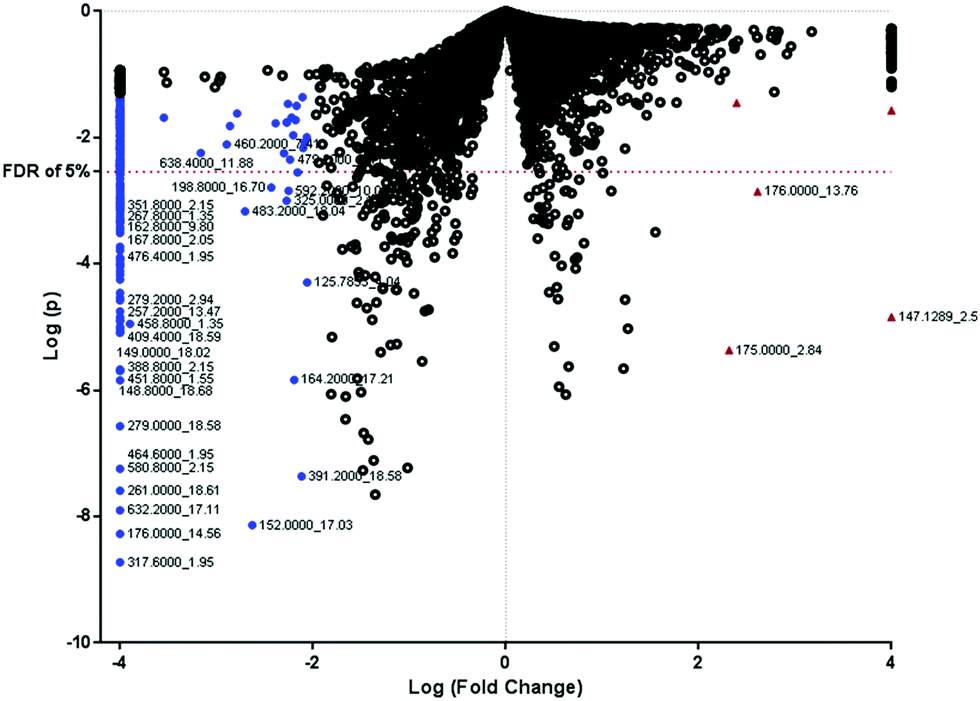 | ||
| Fig. 2 Volcano plot of controls versus CRC cases showing the log[p-values] against the log[fold change] of mean intensity of features in the two groups. All logarithms have the base of 10. The features that are significantly higher by at least 100-fold in CRC cases are shown in red triangles and those significantly higher by at least 100-fold in controls are shown in blue circles. | ||
| Observed m/z [MH+] | Theoretical m/z | Mass error (Da) | Delta (ppm) | Retention time (min) | p-valuea | FDR q-valuea | Variation of mean intensities of feature to controlb | Matched metabolites in database |
|---|---|---|---|---|---|---|---|---|
| a Student t-test was used to analyze the difference in means of cases and controls. The adjusted p-value was calculated with 5%FDR. p-values or q-values that are less than 0.05 are considered as significant. b The arrows ↑ and ↓ indicate increase and decrease of mean feature intensity in the plasma of CRC patients as compared to healthy controls, respectively. | ||||||||
| 106.00 | 106.04 | −0.04 | 470 | 3.04 | 0.025 | 0.077 | ↑ | Serine |
| 136.00 | 136.04 | −0.04 | 314 | 20.60 | 0.022 | 0.072 | ↑ | Homocysteine, methylcysteine |
| 136.05 | −0.05 | 454 | Adenine | |||||
| 147.00 | 147.06 | −0.06 | 443 | 13.96 | 0.015 | 0.059 | ↑ | Adipic Acid, dimethylsuccinic acid |
| 147.07 | −0.07 | 520 | Glutamine | |||||
| 147.21 | −0.21 | 436 | Acetylcholine | |||||
| 147.10 | 147.11 | −0.01 | 87 | 2.55 | <0.001 | <0.001 | ↓ | Lysine |
| 149.00 | 149.04 | −0.04 | 298 | 18.02 | <0.001 | <0.001 | ↑ | 3-Methylmalate |
| 161.00 | 161.08 | −0.08 | 502 | 12.67 | <0.001 | <0.001 | ↑ | Methacholine |
| 164.20 | 165.05 | −0.85 | 299 | 17.21 | <0.001 | <0.001 | ↑ | Dimethylaminopurine, pterin |
| 167.00 | 167.05 | −0.05 | 337 | 18.00 | 0.003 | 0.024 | ↑ | Methylxanthine |
| 168.00 | 168.03 | −0.03 | 193 | 18.00 | <0.001 | <0.001 | ↑ | Homocysteinesulfinic acid |
| 168.06 | −0.06 | 390 | Pyridoxal | |||||
| 169.00 | 169.09 | −0.09 | 575 | 12.45 | 0.046 | 0.111 | ↑ | Pyridoxamine |
| 169.03 | −0.03 | 211 | Uric acid | |||||
| 173.20 | 173.01 | 0.19 | 1035 | 4.33 | 0.003 | 0.024 | ↑ | Glycerol-3-phosphate |
| 194.00 | 194.07 | −0.07 | 418 | 14.70 | 0.001 | 0.013 | ↑ | Methylhippuric acid |
| 223.00 | 223.07 | −0.07 | 335 | 9.50 | 0.003 | 0.024 | ↑ | Cystathionine |
| 240.00 | 240.10 | −0.10 | 454 | 7.41 | 0.001 | 0.013 | ↑ | Dihydrobiopterin |
| 242.00 | 242.12 | −0.12 | 515 | 5.13 | 0.004 | 0.028 | ↑ | Tetrahydrobiopterin |
| 243.00 | 243.09 | −0.09 | 401 | 15.73 | 0.003 | 0.024 | ↑ | Thymidine |
| 261.00 | 261.03 | −0.03 | 142 | 18.61 | <0.001 | <0.001 | ↑ | Glucose-6-phosphate, glucose-1-phosphate |
| 266.00 | 266.11 | −0.11 | 415 | 18.28 | 0.042 | 0.104 | ↑ | Thiamine |
| 268.00 | 268.10 | −0.10 | 388 | 18.61 | 0.003 | 0.024 | ↑ | Adenosine or deoxyguanosine |
| 306.00 | 306.15 | −0.15 | 521 | 2.05 | 0.006 | 0.035 | ↑ | Methionyl-arginine or arginyl-methionine |
| 309.00 | 309.04 | −0.04 | 156 | 2.05 | 0.001 | 0.013 | ↑ | Deoxyuridine monophosphate |
| 345.20 | 345.07 | 0.13 | 353 | 2.15 | 0.002 | 0.019 | ↑ | Thiamine monophosphate, difluorodeoxyuridine monophosphate |
| 377.00 | 377.14 | −0.14 | 371 | 2.05 | <0.001 | <0.001 | ↑ | Riboflavin |
| 442.20 | 442.14 | 0.06 | 120 | 18.04 | 0.017 | 0.063 | ↓ | Folic acid |
| 456.20 | 456.16 | 0.04 | 82 | 7.71 | 0.04 | 0.101 | ↑ | 5,10-Methenyltetrahydrofolate |
| 457.20 | 457.10 | 0.10 | 193 | 6.02 | 0.006 | 0.035 | ↑ | Flavin mononucleotide |
| 460.20 | 460.19 | 0.01 | 13 | 1.35 | 0.007 | 0.038 | ↑ | 5-Methyltetrahydrofolate |
| 468.80 | 468.97 | −0.17 | 386 | 16.64 | 0.005 | 0.032 | ↑ | Deoxyuridine triphosphate |
| 538.60 | 538.51 | 0.09 | 150 | 11.70 | 0.029 | 0.082 | ↓ | Ceramide |
| 746.20 | 746.09 | 0.11 | 136 | 1.35 | 0.002 | 0.019 | ↓ | Reduced nicotinamide adenine dinucleotide phosphate |
3.3 Targeted metabolites
FOCM metabolites levels between the CRC cases and controls are summarized in Table 3. Analysis for statistical significance using a Wilcoxon rank sum test demonstrated that patients with CRC had significantly higher plasma concentrations of THF, 5MTHF, PA and PL compared to healthy controls (Fig. 3). However, the plasma concentrations of B2, FA, SAM as well as methylation capacity (defined by SAM/SAH ratio), FA/THF ratio and FA/5MTHF ratio were significantly higher in the controls instead. The trend in the distribution of plasma folate metabolites showed proportionally more reduced folates in cases but rather, more folic acid in controls (Fig. 4). These trends in results did not differ after excluding the possible outliers in the analysis.| Metabolite/ratio of metabolites | Controls (n = 10) | CRC cases (n = 26) | p-valuea | ||
|---|---|---|---|---|---|
| Median | IQR | Median | IQR | ||
| a Wilcoxon rank sum test was used to analyze the significant difference between the cases and controls. b Significant difference between median of cases and controls (p-value < 0.05). | |||||
| 5MTHF (nM) | 7.43 | 4.62 | 23.17 | 51.25 | 0.001b |
| B2 (nM) | 3.91 | 1.19 | 1.20 | — | 0.002b |
| CYSTH (nM) | 303.20 | 937.36 | 261.36 | 365.84 | 0.447 |
| FA (nM) | 12.74 | 5.07 | 9.71 | 2.77 | 0.009b |
| FMN (nM) | 1.97 | 2.14 | 1.00 | 7.43 | 0.575 |
| HCY (uM) | 9.58 | 3.40 | 8.62 | 5.25 | 0.621 |
| METH (uM) | 29.83 | 17.23 | 24.50 | 15.82 | 0.230 |
| MMA (nM) | 239.80 | 55.60 | 394.00 | 228.10 | <0.001b |
| PA (nM) | 3.30 | — | 12.33 | 48.23 | 0.002 |
| PL (nM) | 92.98 | 59.02 | 152.72 | 208.55 | 0.020b |
| SAH (nM) | 2.53 | 7.10 | 7.54 | 14.68 | 0.126 |
| SAM (nM) | 580.88 | 762.71 | 88.26 | 478.00 | 0.011b |
| THF (nM) | 1.44 | 0.88 | 5.53 | 7.11 | <0.001b |
| Total folates (nM) | 23.07 | 4.17 | 40.06 | 57.40 | <0.001b |
| 5MTHF/folates | 0.34 | 0.19 | 0.61 | 0.35 | 0.005b |
| 5MTHF/THF | 5.78 | 6.27 | 5.94 | 9.82 | 0.832 |
| FA/5MTHF | 1.61 | 1.39 | 0.35 | 0.45 | <0.001b |
| FA/folates | 0.55 | 0.19 | 0.21 | 0.16 | <0.001b |
| FA/THF | 9.59 | 5.22 | 1.54 | 1.62 | <0.001b |
| HCY/CYSTH | 29.98 | 54.36 | 38.73 | 80.92 | 0.289 |
| HCY/METH | 0.37 | 0.20 | 0.36 | 0.39 | 0.437 |
| SAM/SAH | 286.90 | 444.65 | 7.90 | 149.40 | 0.018b |
| THF/folates | 0.06 | 0.03 | 0.12 | 0.19 | 0.009b |
 | ||
| Fig. 3 Box plots showing the plasma concentrations of: (a) THF; (b) 5MTHF; (c) FA; (d) B2; (e) 4PA and (f) PL in CRC cases and controls. | ||
 | ||
| Fig. 4 Box plots showing: (a) plasma concentration of SAM; (b) methylation capacity; (c) plasma concentration of MMA; (d) ratio of FA to THF conversion [indicative of DHFR activity]; (e) folate distribution and (f) normalized folate distribution compared in CRC cases and controls. | ||
4 Discussion
CRC is the third leading cause of cancer deaths, causing about 150000 deaths annually. Most of these deaths are from patients who diagnosed with late stages of CRC. A blood-based biomarker will be a critical tool in identifying patients who are at risk or in the early stages of the disease. The ability to identify disease at early stages will reduce CRC-related deaths. This study presents an approach that has yielded some putative biomarkers that may be useful to screen for CRC.
The combined power of metabolomics and LCMS make it feasible to phenotype patients with CRC and healthy controls to compare their metabolites for biomarker exploration. The untargeted approach has shown the power to explore the metabolites that differentiate between CRC cases and controls. However, the approach presents another challenge with the identification of the differentiating metabolites as putative biomarkers. Although database matching can be used to make an informed guess on the metabolite's identity, the approach leaves an uncertainty gap that must be bridged subsequently with targeted identification approaches. The targeted metabolomics approach, however, focuses on the main metabolic pathway(s) that may have an underlying molecular mechanism to explain the development and progression of the disease. In this study, the differentiating metabolites for CRC obtained from the untargeted scan guided our focus on the FOCM pathway where we selected key metabolites for the targeted analysis.
The FOCM pathway is the primary biological cycle that controls transmethylation and DNA nucleotide synthesis. Both pathways are altered significantly in CRC.22,23 The use of the metabolomics approach to probe the FOCM pathway holds promise for the discovery of individual biomarkers24 and novel drug targets for drug development. In this pilot study using a limited number of samples, we have demonstrated that plasma metabolomics analysis has the capability of clustering CRC cases from controls.
The analysis of the data from the pilot study reveal differences in the plasma FOCM metabolite levels of CRC cases and controls. The trends in observation seem similar to the ‘methyl trapping’ phenomenon that occur during a defect, deficiency or downregulation of a required enzyme or metabolite which prevents the methyl groups being transferred in the transmethylation reaction process. FOCM is one of the critical homeostatic biochemical processes that modulates the transmethylation, transsulfuration, and nucleotide synthesis cycles. Whenever there is an alteration in any of these cycles, the cells respond in a way that reflects in the phenotypic metabolite concentration in plasma.
The methyl trapping hypothesis has existed for over four decades.25 Methyl trapping is a feedback mechanism in which low SAM levels stimulate MTHFR activity, thereby promoting 5MTHF formation to support the methylation reactions. However, if methionine synthase (MS) activity is low, due to cofactor deficiency or MS inhibition, this preferential 5MTHF formation is counterproductive, as 5MTHF becomes pooled metabolically. The 5MTHF can proceed only into the forward reaction with MS to produce more THF and its derivatives which are used for nucleotide synthesis. This same reaction generates METH in situ from HCY, which is toxic when it accumulates. During oxidative stress conditions like the microenvironment of cancer cells, redox enzymes like MS are easily inhibited26 because MS is locked up in the oxidized state awaiting re-activation by Methionine Synthase Reductase. Also, during oxidative stress, the need for glutathione to neutralize reactive oxidative species may activate the transsulfuration pathway by upregulating the expression of cystathionine beta-synthase.27 The transsulfuration pathway activation uses up the HCY at the expense of the transmethylation leading to methyl trapping.
In this study, the cases showed median plasma MMA concentrations higher than the upper reference limit of 290 nM, signifying vitamin B12 deficiency.18 The significantly higher 5MTHF levels (p = 0.002) and vitamin B12 deficiency observed in the plasma of CRC cases confirm this methyl trapping phenomenon in CRC. The trapped methyl donor consequentially affects the generation of SAM, thereby decreasing the methylation capacity of the system, leading possibly to global hypomethylation. In CRC samples, the results indicate significantly lower SAM (p = 0.011) and SAM/SAH ratio (methylation capacity, p = 0.018) but a significantly higher THF plasma levels (p < 0.0001) due to a better FA–THF conversion (p < 0.0001). Such a high conversion is also expected to compensate for the block in THF regeneration from the 5MTHF–MTR–THF route. Also, the significantly higher plasma levels of THF in CRC patients may be linked to the fast-replicating CRC cells requiring THF to transfer methyl groups into the nucleotide biosynthesis and cell division. The low SAM levels resulting from impaired methionine regeneration may upregulate the activity of methylene tetrahydrofolate reductase (MTHFR) resulting in increased utilization of cofactors like vitamin B2 which is significantly reduced in CRC cases.
The total folates, as well as the proportions of folate metabolite, also revealed an interesting trend in the two groups. Total folates and the proportions of reduced folates (THF and 5MTHF) were significantly higher in cases than controls. The reverse trend was observed for the level or proportion of folic acid. Folic acid is known to be one of the feedback regulatory metabolites of the FOCM inhibiting DHFR and MTHFR when it accumulates.28–31 This regulatory switch modulates how much of reduced folates join the cycle, but it seems to be less efficient in the CRC cases thereby shuttling more reduced folates for DNA synthesis or methylation. In the CRC cases, the DNA synthesis is the preferred pathway due to the block in the methylation of HCY due to the vitamin B12 deficiency. However, this may provide the needed DNA bases for the high proliferation of tumor cells but aberrant methylation to drive the disease to advance stages in the cases.
Converse to expectation is the plasma levels of HCY which is not significantly different in CRC cases and controls. HCY is expected to be higher in CRC samples because it is known to be associated with risk of cancer.32,33 However, the highly inflammatory environment associated with CRC may have driven excess HCY through the cysteine–glutathione pathway. Because B6 catalyzes HCY conversions, the significantly higher metabolites of B6 like PL and PA (p = 0.02 and 0.003 respectively) may be resulting from this biochemical conversion of HCY.
In the present study, we have identified sets of plasma metabolites including 5MTHF, THF, FA, B2, PA, PL, SAM, SAH and MMA that are altered in CRC and thus may be used as biomarkers for CRC screening. The misclassification error rate of models developed in this pilot study based on these metabolites is 2.8% which may present a reliable screening assay as an alternative to colonoscopy. The convenience and minimal invasion of blood-based assays make them highly needed in population-based CRC screening. Subsequent epidemiology study involving about 3000 participants (CRC cases and their sibling controls) is being conducted to validate the preliminary results of this research. This study will also map the metabolites to the various genes that are related to the CRC.
4.1 Limitations of the study
The study was limited by lack of information on the treatment regimens or supplementation status of the cases selection. These limitations affected the conclusions because: (1) difference could reflect a response to disease and not a precursor to diseases (e.g. reverse causation); (2) difference could reflect a response to treatment, because the cases may have initiated treatment; (3) difference could reflect an age difference (or any other difference in samples – i.e. unmeasured confounders). However, the samples from patients with ages at the extremities (age greater than 78 or less than 30) in the age distribution were excluded to make the median age of the two groups not significant. A total of six controls and three cases were excluded by this criterion. The clustering patterns in the supervised and the unsupervised analysis were not altered after repeating the analysis with groups whose median ages were not significantly different.5 Conclusions
In this study, a metabolomics approach was established and used for the first time to classify CRC cases and controls. Using exploratory pattern recognition and statistical analysis, we identified nine putative biomarkers that can be used to clearly separate CRC cases from controls. This study not only helps to reveal the alteration of FOCM to be related to the CRC development but also, putative biomarkers that may be further developed as an alternative screening approach, thereby reducing CRC-related deaths.Author contributions
I. A., S. G. L. and D. V. C. conceived the study; I. A., H. P., E. Z., S. L., D. C. and E. Y. analyzed the plasma samples and I. A. performed the data analyses. I. A., S. G. L. and D. V. C. drafted the manuscript. All authors reviewed the manuscript.Conflicts of interest
There are no conflicts of interest to declare.Acknowledgements
We would like to thank the National Institutes of Health for the support. This work was supported by grant NIH NCI R01CA140561.References
- R. L. Siegel, K. D. Miller and A. Jemal, Ca-Cancer J. Clin., 2016, 66, 7–30 CrossRef PubMed.
- R. Seifeldin and J. J. Hantsch, Clin. Ther., 1999, 21, 1370–1379 CrossRef CAS PubMed.
- A. K. Gupta, D. E. Brenner and D. K. Turgeon, Mol. Diagn. Ther., 2008, 12, 77–85 CrossRef PubMed.
- R. W. Burt, J. S. Barthel, K. B. Dunn, D. S. David, E. Drelichman, J. M. Ford, F. M. Giardiello, S. B. Gruber, A. L. Halverson and S. R. Hamilton, J. Natl. Compr. Cancer Network, 2010, 8, 8–61 CrossRef.
- J. B. O’Connell, M. A. Maggard and C. Y. Ko, J. Natl. Cancer Inst., 2004, 96, 1420–1425 CrossRef PubMed.
- S. de Vogel, J. Schneede, P. M. Ueland, S. E. Vollset, K. Meyer, Å. Fredriksen, Ø. Midttun, T. Bjørge, E. Kampman and M. Bretthauer, Cancer Epidemiol., Biomarkers Prev., 2011, 20, 1726–1735 CrossRef CAS PubMed.
- E. Giovannucci, M. J. Stampfer, G. A. Colditz, D. J. Hunter, C. Fuchs, B. A. Rosner, F. E. Speizer and W. C. Willett, Ann. Intern. Med., 1998, 129, 517–524 CrossRef CAS PubMed.
- M. Pufulete, R. Al-Ghnaniem, J. Rennie, P. Appleby, N. Harris, S. Gout, P. Emery and T. Sanders, Br. J. Cancer, 2005, 92, 838–842 CrossRef CAS PubMed.
- M. Pufulete, R. Al-Ghnaniem, A. J. Leather, P. Appleby, S. Gout, C. Terry, P. W. Emery and T. A. Sanders, Gastroenterology, 2003, 124, 1240–1248 CrossRef CAS.
- V. L. Stevens, M. L. McCullough, J. Sun, E. J. Jacobs, P. T. Campbell and S. M. Gapstur, Gastroenterology, 2011, 141(98–105), e101 Search PubMed.
- O. Fiehn, Plant Mol. Biol., 2002, 48, 155–171 CrossRef CAS PubMed.
- J. K. Nicholson, J. C. Lindon and E. Holmes, Xenobiotica, 1999, 29, 1181–1189 CrossRef CAS PubMed.
- R. Madsen, T. Lundstedt and J. Trygg, Anal. Chim. Acta, 2010, 659, 23–33 CrossRef CAS PubMed.
- M. Li, B. Wang, M. Zhang, M. Rantalainen, S. Wang, H. Zhou, Y. Zhang, J. Shen, X. Pang and M. Zhang, Proc. Natl. Acad. Sci. U. S. A., 2008, 105, 2117–2122 CrossRef CAS PubMed.
- L. D. Roberts, A. L. Souza, R. E. Gerszten and C. B. Clish, Curr. Protoc. Mol. Biol., 2012, 30–32 Search PubMed.
- I. Asante, H. Pei, E. Zhou, S. Liu, D. Chui, E. Yoo and S. G. Louie, J. Pharm. Biomed. Anal., 2018, 158, 66–73 CrossRef CAS.
- M. Kořínek, V. Šístek, J. Mládková, P. Mikeš, J. Jiráček and I. Selicharová, Biomed. Chromatogr., 2013, 27, 111–121 CrossRef PubMed.
- X. Fu, Y.-K. Xu, P. Chan and P. K. Pattengale, in JIMD Reports, Springer, 2013, vol. 10, pp. 69–78 Search PubMed.
- R. Hoogerbrugge, S. J. Willig and P. G. Kistemaker, Anal. Chem., 1983, 55, 1710–1712 CrossRef CAS.
- P. A. Lachenbruch and M. R. Mickey, Technometrics, 1968, 10, 1–11 CrossRef.
- J. D. Storey, Ann. Stat., 2003, 31, 2013–2035 CrossRef.
- M. P. Hanley and D. W. Rosenberg, Curr. Pharmacol. Rep., 2015, 1, 197–205 CrossRef CAS.
- Y.-I. Kim, Cancer Epidemiol., Biomarkers Prev., 2004, 13, 511–519 CAS.
- T. Kind, V. Tolstikov, O. Fiehn and R. H. Weiss, Anal. Biochem., 2007, 363, 185–195 CrossRef CAS.
- V. Herbert and R. Zalusky, J. Clin. Invest., 1962, 41, 1263 CrossRef CAS.
- C.-G. Zou and R. Banerjee, Antioxid. Redox Signaling, 2005, 7, 547–559 CrossRef CAS PubMed.
- E. Scherer, F. Schmitz, F. Vuaden, L. Savio, A. Ferreira, R. Tasca, E. Casali, M. Bogo, C. Bonan and A. Wyse, Neuroscience, 2012, 223, 28–34 CrossRef CAS.
- J. Jarabak and N. R. Bachur, Arch. Biochem. Biophys., 1971, 142, 417–425 CrossRef CAS.
- R. G. Matthews and S. C. Daubner, Adv. Enzyme Regul., 1982, 20, 123–131 CrossRef CAS.
- D. R. Morales and D. M. Greenberg, Biochim. Biophys. Acta, Spec. Sect. Enzymol. Subj., 1964, 85, 360–376 CAS.
- W. Xia, A. R. Hilgenbrink, E. L. Matteson, M. B. Lockwood, J.-X. Cheng and P. S. Low, Blood, 2009, 113, 438–446 CrossRef CAS PubMed.
- J. Ma, M. J. Stampfer, E. Giovannucci, C. Artigas, D. J. Hunter, C. Fuchs, W. C. Willett, J. Selhub, C. H. Hennekens and R. Rozen, Cancer Res., 1997, 57, 1098–1102 CAS.
- J. Chen, E. Giovannucci, K. Kelsey, E. B. Rimm, M. J. Stampfer, G. A. Colditz, D. Spiegelman, W. C. Willett and D. J. Hunter, Cancer Res., 1996, 56, 4862–4864 CAS.
Footnote |
| † Electronic supplementary information (ESI) available. See DOI: 10.1039/c8mo00158h |
| This journal is © The Royal Society of Chemistry 2019 |