
 Open Access Article
 This Open Access Article is licensed under a Creative Commons Attribution-Non Commercial 3.0 Unported Licence
Pattern recognition of solid materials by multiple probe gases†
Kosuke
Minami
 *ab,
Gaku
Imamura
ab,
Takahiro
Nemoto
a,
Kota
Shiba
ab and
Genki
Yoshikawa
abc
*ab,
Gaku
Imamura
ab,
Takahiro
Nemoto
a,
Kota
Shiba
ab and
Genki
Yoshikawa
abc
aCenter for Functional Sensor & Actuator (CFSN), National Institute for Materials Science (NIMS), 1-1 Namiki, Tsukuba, Ibaraki 305-0044, Japan. E-mail: MINAMI.Kosuke@nims.go.jp
bInternational Center for Materials Nanoarchitectonics (MANA), National Institute for Materials Science (NIMS), 1-1 Namiki, Tsukuba, Ibaraki 305-0044, Japan
cMaterials Science and Engineering, Graduate School of Pure and Applied Science, University of Tsukuba, Tennodai 1-1-1 Tsukuba, Ibaraki 305-8571, Japan
First published on 19th December 2018
Abstract
A pattern recognition-based chemical sensor array is an efficient approach to discriminating odours or a complex mixture of gaseous molecules. In such an approach, solid materials are coated on surfaces of sensors as probe receptors, and gaseous molecules are exposed to those sensors as targets. Here, we propose the reverse approach, that is, gaseous molecules as probes and solid materials as targets, leading to pattern recognition of solid materials. Using a nanomechanical sensor as an example of a sensing platform, we have demonstrated that this approach can discriminate polymers with different molecular weights as well as those having slightly different functional groups evaluated through detailed classification using a support vector machine in addition to principal component analysis and linear discriminant analysis. Classification of those target solid materials with 100% accuracy has been achieved with some specific combinations of probe gases. Since any kind of gaseous molecule and any kind of chemical sensor can be utilized as the probe and sensing platform, respectively, this study will open a new horizon for comprehensive analysis of solid materials through a pattern formed by the gas–solid interaction.
Conceptual insightsA conventional analysis of solid materials generally focuses on the specific physical/chemical parameters of the materials. Here, we demonstrate a novel concept – that is, analysis of solid materials through their “pattern” formed as a result of dynamic interaction between solid and multiple probe gases. Since gaseous molecules diffuse into solid materials while interacting with most atoms inside, resultant dynamic responses contain much information stemming from various physical/chemical interactions. Thus, the pattern provides a high-resolution fingerprint of the solid material, reflecting not only its intrinsic material properties but also its myriad properties (e.g. detailed surface/internal/interfacial structures and distribution of thickness/morphology-dependent physical properties), which are usually difficult to be fully covered by conventional approaches. Since any kind of gaseous molecule can be utilized as a probe, this approach possesses unlimited possibilities to differentiate solid materials and their properties. Moreover, the target is not limited to a simple material but includes a complex mixture of functional materials and various thin-film devices as long as gaseous molecules can interact. In contrast to conventional materials science, which usually focuses only on a certain aspect, this concept provides a novel insight in terms of a comprehensive “pattern”, which contains much information including properties inaccessible with existing approaches. |
Chemical sensor arrays have attracted significant attention as a powerful tool for detecting, discriminating and identifying target analytes, especially various odours composed of a complex mixture of gaseous specimens. A large variety of chemical sensor arrays have been utilized, including quartz crystal microbalances (QCM), conducting polymers (CP), field-effect transistors (FET) and nanomechanical sensors.1–5 In a chemical sensor array, sensing signals are obtained by measuring physicochemical interactions induced by the sorption of target analytes in sensing materials designed to respond to a wide range of chemical classes. Since such a multidimensional dataset obtained by the chemical sensor array contains much information, multivariate analyses and machine learning can be effectively applied to discriminate and identify each specimen. Although a wide range of applications have been demonstrated in various fields, such as food, agriculture, medicine and environmental science,5–11 these pattern recognition-based analyses are basically limited to gaseous analytes.
In this study, we propose a reverse approach, that is, pattern recognition of solid materials. As the sensing signals of chemical sensors are based on the interaction between gases and solids, a sensing element and a target analyte should be exchangeable (i.e. solid materials as target analytes and gaseous molecules as sensing probes), leading to the pattern recognition of solid materials. To demonstrate this new approach, we focus on a nanomechanical sensor as an example of a sensing platform. A nanomechanical sensor detects mechanical information derived from the interactions between gaseous molecules and solid materials with high sensitivity. Since it has been confirmed that almost all kinds of solid materials including organic small molecules, polymers and inorganic nanoparticles provide some signals as a result of the gas–solid interaction,12–20 a nanomechanical sensor is an ideal platform to examine various kinds of solid materials. We have demonstrated successful discrimination of polymers having different molecular weights as well as those composed of different monomers by means of pattern recognition. Furthermore, detailed analysis using support vector machine (SVM)-based classification models has revealed that only 2 or 3 selected probe gases can identify solid specimens with high classification accuracy. Since any gas species including the complex mixture can be utilized as a probe to increase the variety of signal patterns, this approach is expected to provide unlimited resolution of patterns of solid materials depending on each purpose.
As an initial proof-of-concept, we performed identification of 4 different polymers through pattern recognition using nanomechanical Membrane-type Surface stress Sensors (MSS).21,22 We selected polystyrene (PS) and poly(4-methylstyrene) (P4MS) as a set having similar chemical structures, and polycaprolactone (PCL) and poly(vinylidene fluoride) (PVF) as a set with a hydrophobic nature (Fig. S1; see also the Supplementary Text, ESI†). Each polymer was dissolved in DMF and deposited onto each channel of MSS by inkjet spotting. Twelve different vapours are used as probes to acquire signals for each gas–solid interaction (details are provided in the Experimental section). Upon exposure to each vapour, the polymers exhibited unique responses in terms of their intensity as well as their shape (Fig. 1a; see also Fig. S2, ESI,† for all signal responses), reflecting the differences in chemical and physical affinity between each polymer and vapour. For the obtained dataset, we conducted unsupervised and supervised analyses, namely principal component analysis (PCA) and linear discriminant analysis (LDA), respectively. Multiple parameters were extracted as feature sets from each decay curve of each normalized signal response (Fig. 1b; details can be found in the Experimental section).23,24 With all the features from the 12 vapours, the 4 different polymers can be clearly distinguished by forming well-separated clusters in the principal component space (Fig. 1c; see also Fig. S3, ESI,† for the PC1–3 and PC2–3 planes). On the PC 1–2 plane, PS and P4MS form clusters close to each other, reflecting their similarity in the chemical and physical affinity to each probe gas. With the LDA as shown in Fig. 1d, each polymer was clearly classified without any overlaps, demonstrating the feasibility of the present approach to discriminating solid materials by pattern recognition. It should be noted that several small sub-clusters can be found in each cluster (Fig. 1c). Since each small sub-cluster corresponds to each polymer layer coated onto each channel of the MSS (11 channels for each polymer species), the differences between these sub-clusters are regarded as the coating reproducibility of each polymer layer. Thus, this approach is proved to have enough resolution to discriminate such minute differences in the quality of coatings as well as the different materials.
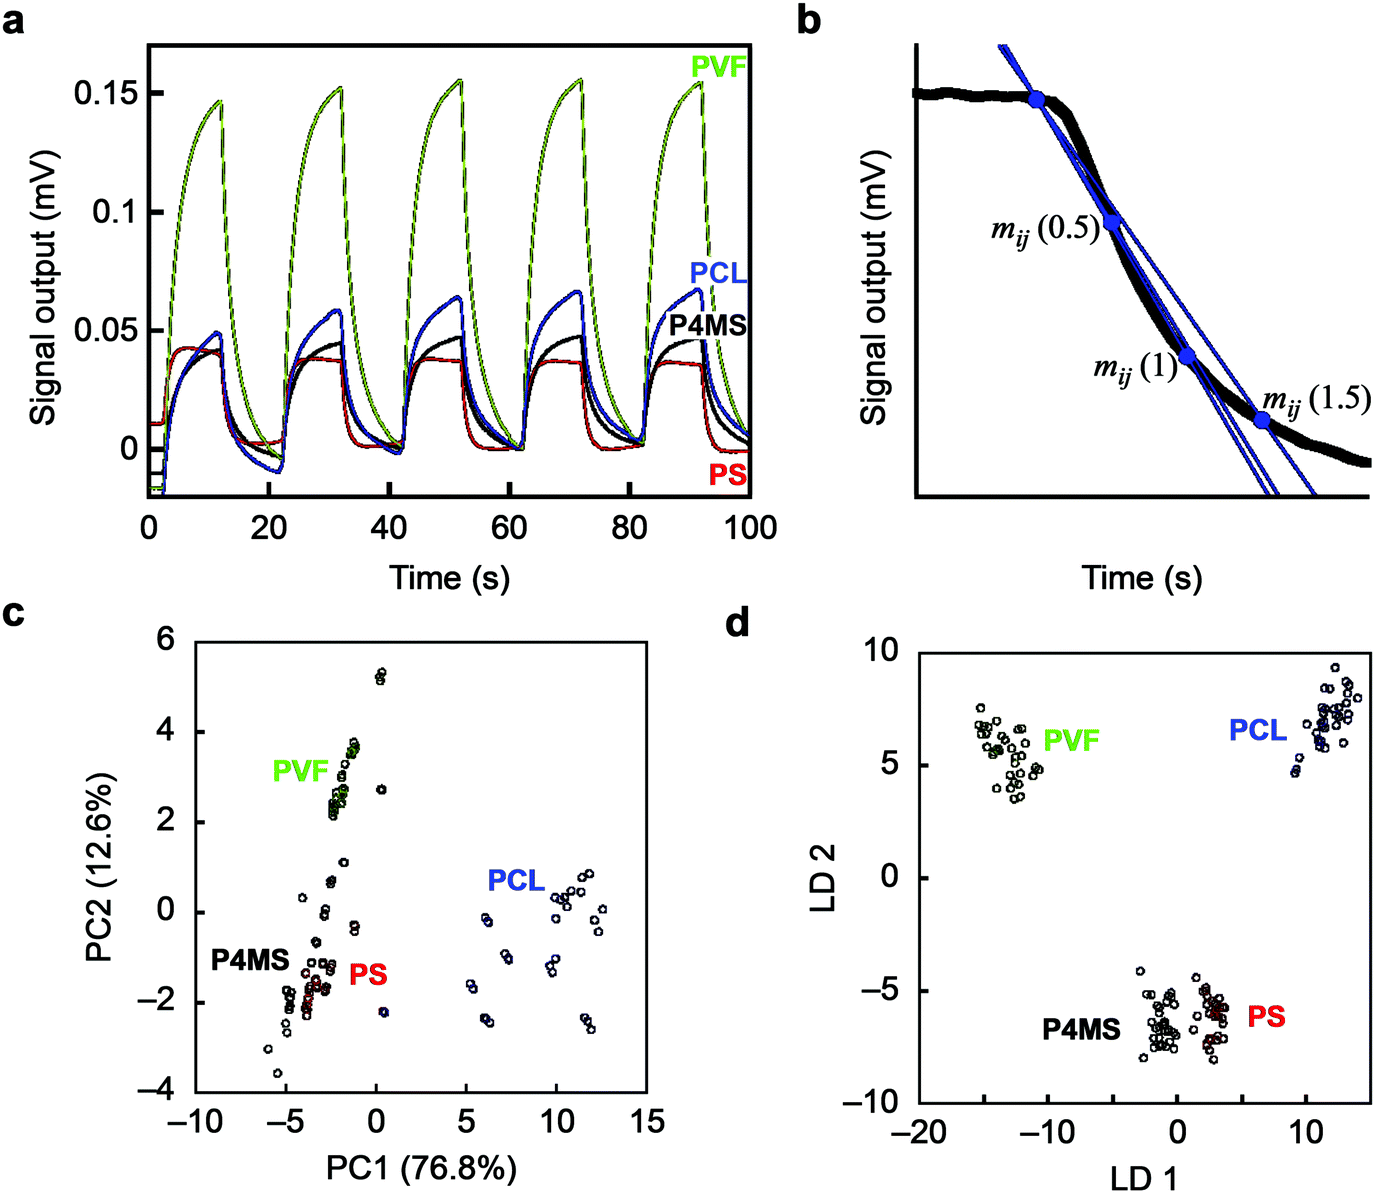 | ||
Fig. 1 Identification of polymers by pattern recognition using probe gases. (a) Typical signal responses of MSS. See also Fig. S2, ESI.† (b) Schematics of the methods for feature extraction from each normalized signal response. (c and d) PCA and LDA score plots of 4 polymers using 12 different probe gases. PS(350k), polystyrene, Mw = 350![[thin space (1/6-em)]](https://www.rsc.org/images/entities/char_2009.gif) 000 (red); P4MS, poly(4-methylstyrene) (black); PVF, poly(vinylidene fluoride) (green); PCL, polycaprolactone (blue). N = 11. 000 (red); P4MS, poly(4-methylstyrene) (black); PVF, poly(vinylidene fluoride) (green); PCL, polycaprolactone (blue). N = 11. | ||
We also developed machine learning models based on a SVM classifier with a non-linear kernel.25 The 36 feature sets (3 parameters from each probe gas) of 132 samples (33 samples from each polymer) were used in building an optimal SVM model and its validation. Eighty percent of the samples (105–106 samples) were used for the training dataset. After tuning the hyperparameters of a radial basis function (C and γ), the remaining 26–27 samples were used for validation of the SVM model. To calculate identification accuracy, 5-fold cross validation was adopted.26 All combinations of each probe gas were calculated to create SVM models. The number of trained SVM models was 4095 (= 212 − 1). The details of the SVM classifier can be found in the Experimental section. Identification accuracies depending on the combination of the probe gases are shown as a dot plot in Fig. 2a, and the calculated results of average accuracy obtained from the combinations with selected probe gases are shown in Fig. S4, ESI.† By the SVM analysis, the feature set from the 12 probe gases can clearly classify each polymer with 100% identification accuracy. Remarkably, almost a quarter of all combinations of the probe gases resulted in 100% identification accuracy with 2 to 12 kinds of probe gases. The usage rates of all the probe gases are summarized in Table 1. These results clearly indicate that the appropriate selection of probe gases depending on the target solid samples leads to highly accurate and efficient identification (Fig. 2b). For example, in the present case, the specific combinations of two probe gases (i.e. [ethyl acetate, ethanol], [ethyl acetate, toluene] and [ethyl acetate, chloroform]) achieved 100% identification accuracy, while another combination [ethyl acetate, propionic acid] resulted in the worst accuracy with 75.5 ± 14.1%. Based on these results, we conducted PCA again for visual recognition using the best and worst combinations of the two probe gases. As expected, most of the clusters were well-separated in the best combinations, while those in the worst combination densely overlapped, especially between PS and P4MS (Fig. 2c–f). It is assumed that high pattern recognition accuracy can be achieved by a combination of probe gases discriminating polar PCL from others and ones discriminating PS, P4MS and PVF from each other (Table 1; see also Fig. S5, ESI†). It should be noted that clear separation of clusters does not necessarily lead to high classification performance.27
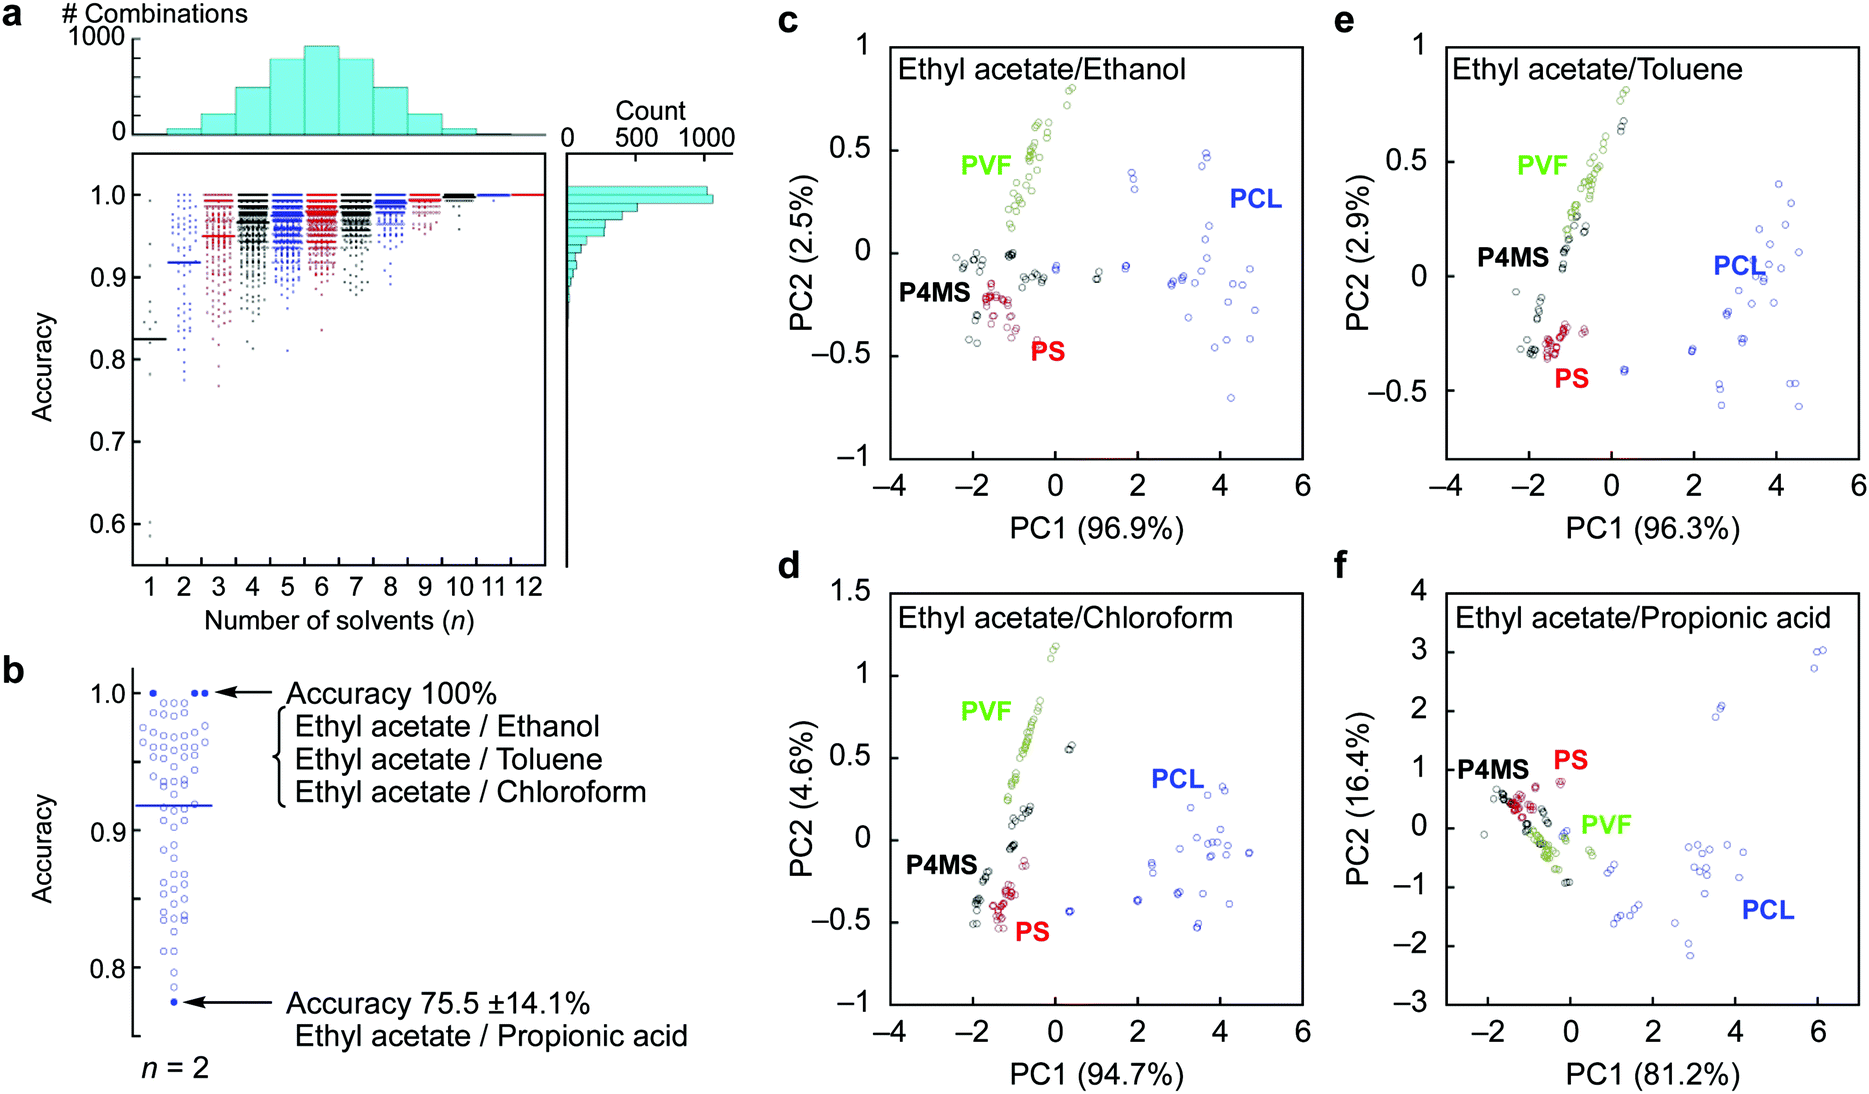 | ||
| Fig. 2 SVM classification for the identification of the molecular weights of polymers. (a) Dot plots of classification accuracy calculated by SVM with 5 × 2 cross validation as a function of numbers of combination of probe gases (n) used for the calculation. Histograms show the number of combinations (top) and classification accuracy (right). (b) Dot plots of classification accuracy with the combinations of 2 probe gases. The best and worst cases in accuracy are shown beside the plot. (c–f) PCA score plots for each combination of two probe gases, which result in the best or worst accuracy as follows: the best combinations ethyl acetate/ethanol (c), ethyl acetate/chloroform (d) and ethyl acetate/toluene (e); and the worst combination ethyl acetate/propionic acid (f). | ||
| Probe gas | Usage rate | Accuracy | ||
|---|---|---|---|---|
| Polymer (%) | Mol. weight (%) | Polymer (%) | Mol. weight (%) | |
| Water | 82.1 | 53.5 | 58.6 ± 6.3 | 65.4 ± 15.7 |
| Ethanol | 59.1 | 51.0 | 82.0 ± 7.7 | 78.4 ± 16.9 |
| 1-Hexanol | 34.6 | 51.9 | 78.2 ± 8.8 | 82.0 ± 10.8 |
| Hexanal | 56.1 | 62.2 | 91.4 ± 9.7 | 86.8 ± 12.0 |
| n-Heptane | 51.6 | 67.9 | 85.8 ± 8.3 | 89.1 ± 8.7 |
| Methylcyclohexane | 46.2 | 63.1 | 87.0 ± 3.2 | 78.3 ± 3.7 |
| Toluene | 58.5 | 27.2 | 84.5 ± 8.0 | 91.5 ± 3.9 |
| Ethyl acetate | 70.9 | 78.5 | 94.0 ± 3.8 | 80.7 ± 15.8 |
| Acetone | 52.8 | 97.4 | 83.7 ± 11.8 | 88.3 ± 6.6 |
| Chloroform | 65.6 | 14.7 | 99.3 ± 1.4 | 71.1 ± 13.8 |
| Aniline | 46.2 | 49.7 | 60.2 ± 8.8 | 77.9 ± 6.5 |
| Propionic acid | 60.4 | 53.8 | 84.5 ± 15.7 | 78.8 ± 10.5 |
| No. of 100% combinations | 1021 | 312 | ||
| Total no. of combinations | 4095 = (212 − 1) | |||
To evaluate further the applicability of the pattern recognition of solid materials, we demonstrated the identification of the molecular weights of polymers. Two additional polystyrenes with different molecular weights, PS(35k) and PS(280k), were also coated onto separate MSS channels in the same manner. Using these MSS channels, their responses to the probe gases were measured. The same feature sets were extracted and combined with the dataset of previously measured PS(350k) and P4MS. The PCA and LDA were conducted using the 12 probe gases. Although the PCA score plots resulted in some misclassification, especially between PS and P4MS, the LDA provided clear discrimination of polystyrenes including PS and P4MS in terms of molecular weight (Fig. 3). According to a previous study,13 a response of a nanomechanical sensor is strongly affected by the physical properties of a receptor layer, including Young's modulus. The Young's moduli of polystyrene thin films used in this study are reported to be in the range from 3.4 to 3.9 GPa.28 Thus, it is found that the current pattern recognition approach can discriminate materials with such a narrow range of Young's moduli. The SVM classification was also performed with all combinations of the 12 probe gases. As shown in Fig. 4 and Table 1, 312 combinations (7.6%) can identify the differences in molecular weight with 100% accuracy, while the largest feature set extracted from all 12 probe gases resulted in a lower accuracy of 95.0 ± 0.10% (see also Fig. S6, ESI†).27,29 It should be noted that a specific combination of two probe gases, i.e. [chloroform, aniline], achieved 100% accuracy (Fig. 4b). Furthermore, even one specific probe gas, i.e. toluene, achieved 91.5 ± 3.9% identification accuracy (Table 1), and most PCA score plots of each probe gas provide rough discrimination of the differences in molecular weights (Fig. S7, ESI†). These results indicate that the pattern recognition can also be effectively applied to solid materials to identify each analyte even with similar chemical and physical properties by choosing a couple of appropriate probe gases. As demonstrated in a previous study,15 these patterns should be correlatable with other material parameters, such as Young's moduli, leading to quantitative prediction of such parameters using machine learning-based regression analyses.
 | ||
| Fig. 3 Identification of the molecular weights of polymers. (Top left, top right, bottom left) PCA score plots of the 4 polymers coated on MSS using the 12 different probe gases. (Bottom right) LDA score plots of the polymers. PS(350k), polystyrene, Mw = 350000 (blue); P4MS, poly(4-methylstyrene), Mw = 72000 (black); PS(280k), polystyrene, Mw = 280000 (red); PS(35k), polystyrene, Mw = 35000 (green). | ||
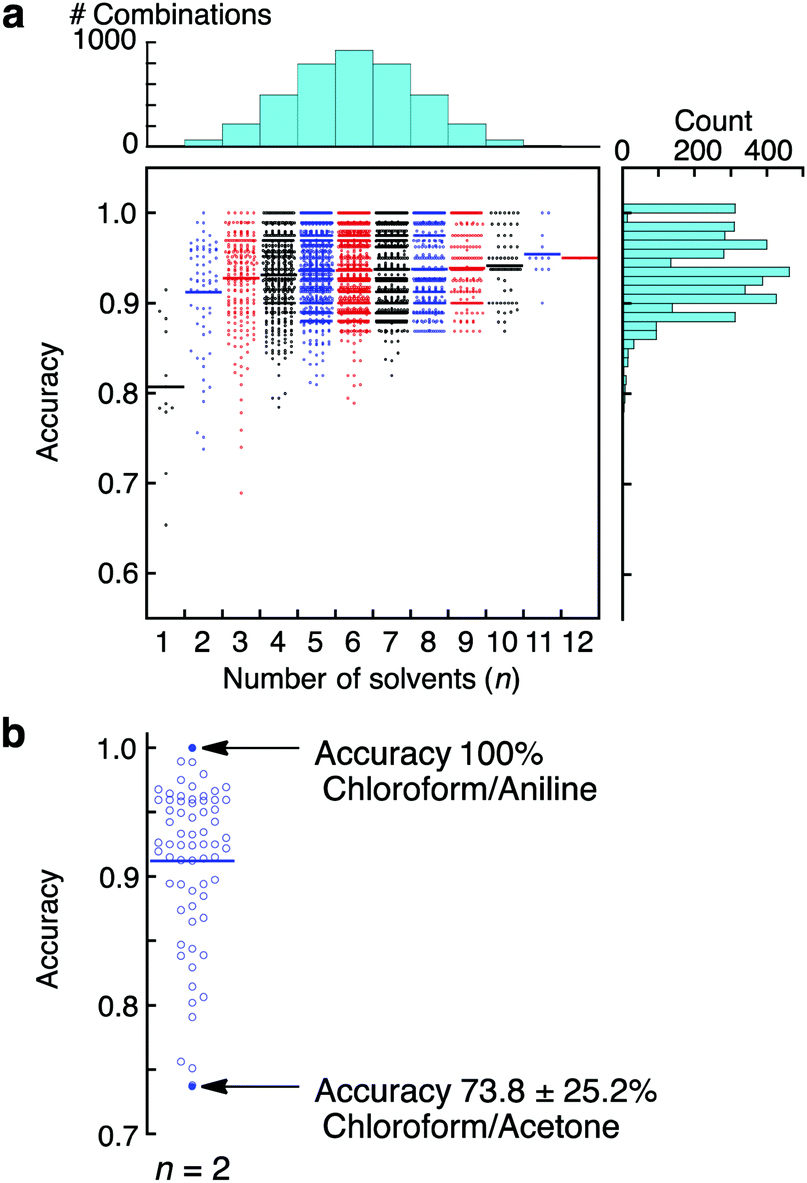 | ||
| Fig. 4 SVM classification for the identification of the molecular weights of polymers. (a) Dot plots of classification accuracy calculated by SVM with 5 × 2 cross validation as a function of the number of gases (n) used for the calculation. Histograms show the number of combinations (top) and classification accuracy (right). (b) Dot plots of classification accuracy with 2 probe gases. The best and worst cases in accuracy are shown beside the plot. | ||
This approach will also be effective in the industrial phase. In the industrial phase, for example, it is quite important to assess the quality of sensor products, especially the coating quality of receptor materials. As a proof-of-concept, we assessed the coating quality of the receptor layers of MSS through this pattern recognition-based approach. Sensing signals recorded from 11 different sensors are analysed by PCA, followed by a quality evaluation based on Mahalanobis distances.30–32 As shown in Fig. S8 and S9 in the ESI,† it is possible to quantitatively assess the coating quality of PVF and PCL, respectively. Thus, this approach will provide various possibilities in the industrial phase.
Conclusions
In this study, it has been demonstrated that solid specimens could be identified by pattern recognition, achieving 100% accuracy in the case of some specific combinations of probe gases. As proved by means of SVM as well as PCA and LDA, even slight differences in material properties such as molecular weights could also be discriminated through this approach. Since any kind of gaseous or volatile molecules can be potentially utilized as a probe for this pattern recognition-based solid material identification, this approach possesses unlimited possibilities to differentiate solid materials. The potential target solid materials of this concept include inorganic nanoparticles, functional organic materials and biomolecules such as peptides, proteins and nucleic acids. It should also be noted that this concept is not limited to nanomechanical sensors but can be expanded to a variety of chemical sensors. Moreover, this approach will also be effective in the industrial phase, including the assessment of receptor coatings on sensor products as demonstrated in this study. Therefore, the presented concept of the pattern recognition-based analysis of solid materials will open a new horizon for chemical sensors and materials science.Experimental
Materials
Polystyrene (Mw = 35000) (PS(35k)), polystyrene (Mw = 280000) (PS(280k)), polystyrene (Mw = 350000) (PS(350k)), polycaprolactone (PCL), poly(4-methylstyrene) (P4MS), and poly(vinylidene fluoride) (PVF) were purchased from Sigma Aldrich, and used in this study. N,N-Dimethylformamide (DMF) as a solvent to prepare polymer solutions for inkjet spotting was purchased from Wako Pure Chemical Industries. Ethanol, 1-hexanol, hexanal, n-heptane, methylcyclohexane, toluene, ethyl acetate, acetone, chloroform, aniline and propionic acid (analytical or higher grade) used as probe gases were purchased from Sigma-Aldrich, Tokyo Chemical Industry, and Wako Pure Chemical Industries. All chemicals were used as purchased. To obtain water vapour, MilliQ water was used (Merck MilliPore).
Experimental procedure
To identify each polymer material, we coated polymer layers onto an MSS chip by inkjet spotting. The detailed fabrication process of the MSS chip has been provided in previous reports.21,22 An inkjet spotter (LaboJet-500SP, MICROJET Corporation) equipped with a nozzle (IJHBS-300, MICROJET Corporation) was used. Each polymer was dissolved in DMF (1 mg mL−1), and the resulting solutions were deposited onto each channel of the MSS. The injection speed, volume of a droplet and number of inkjet shots were fixed at ∼5 m s−1, ∼300 pL, and 300 shots, respectively. A stage of the inkjet spotter was heated at 80 °C to dry DMF. Each polymer was coated at least 2 different channels to investigate the coating quality: PS(35k), N = 3; PS(280k), N = 2; PS(350k), N = 11; PCL, N = 11; P4MS, N = 11; PVF, N = 11.The coated MSS chips were mounted in a Teflon chamber, which was placed in an incubator (Incubator-1) with a controlled temperature of 25.0 ± 0.5 °C. The chamber was connected to a gas system consisting of two mass flow controllers (MFCs), a mixing chamber, a purging gas line and a vial for a solvent liquid in an incubator (Incubator-2) with a controlled temperature of 15.0 ± 0.5 °C. The vapour of each solvent was produced by bubbling of carrier gas. Pure nitrogen gas was used as carrier and purging gases. The total flow rate was kept at 100 mL min−1 during the experiments. The concentrations of the 12 different solvent vapours were controlled using MFC-1 at Pa/Po of 0.1, where Pa and Po stand for the solvent's partial vapour pressure and saturated vapour pressure, respectively.
Before measuring MSS signals, pure nitrogen gas was introduced into the MSS chamber for 1 min. Subsequently, MFC-1 (sampling line) was switched on/off every 10 s with a controlled total flow rate of 100 mL min−1 using MFC-2 for 5 cycles (Fig. S2, ESI,† for full signal responses). Data were measured with a bridge voltage of −0.5 V, and recorded with a sampling rate of 10 Hz. The data collection program was designed using LabVIEW (National Instruments Corporation).
Pattern recognition procedure
Principal component analysis (PCA) and linear discriminant analysis (LDA) were utilized for reducing the dimensionality of the datasets. By projecting the data onto a lower-dimensional space, one can visually recognize the coated materials according to the cluster separation. To identify each coated material and evaluate its accuracy, we developed classification models based on a support vector machine (SVM) with a radial basis function kernel. To assess the quality of sensor products, we used the Mahalanobis–Taguchi system (MTS). Feature sets were extracted from each decay curve of a normalized MSS signal measured with the 12 different gases (Fig. 1b). Three different slopes mij(tn) were extracted from the i-th channel with the j-th gas according to the following equation: mij(tn) = [Iij(t0) − Iij(t0 + tn)]/tn, where Iij(t) and t0 denote the signal output at time t and the time when the signal response starts to decay, respectively. In this study, we chose 3 time points for tn; tn = 0.5, 1, 1.5 (s). Three sets of parameters [mij(0.5), mij(1), mij(1.5)] were extracted from the last 3 signal responses from 40 to 100 (s) out of the 5 signal responses in each measurement, because the latter signal responses can provide more reproducible signal responses than the former ones, which exhibit initial fluctuations associated with mixing of sample gases and pre-adsorbed gases.PCA and LDA were adopted using scikit-learn packages for Python. PCA projects data onto lower dimensions so that the variance of the first principal component (PC1) becomes the largest. Successive principal components are determined to maximize the variance under the constraint that the (n + 1)-th principal component is orthogonal to the n-th component. In contrast to PCA, LDA projects data onto lower dimensions to maximize the cluster separation; LDA maximizes the distance between the classes and minimizes the variance in the same class. Classification models based on a non-linear SVM were developed using scikit-learn packages for Python. To optimize and evaluate the models, we employed 5 × 2 cross validation. The whole datasets were first split into 5 datasets, of which 4 datasets were used as training datasets, and the remaining 1 dataset was used as a test dataset. The training datasets were further split into 2 sub-datasets. Based on these sub-datasets, the hyperparameters of the SVM (i.e. C and γ) were optimized. This validation process was repeated for all the combinations of the 5 datasets for evaluating the classification accuracy of the models.
The MTS was adopted by scikit-learn packages for Python. To evaluate the Mahalanobis distance, the data were projected onto a lower-dimension space (PC1–2 plane) by PCA. Then, the Mahalanobis distances of each plot on the PC1–2 plane were calculated by MTS.
Conflicts of interest
There are no conflicts to declare.Acknowledgements
We thank Yuko Kameyama, Keiko Koda and Eri Sakon (WPI-MANA, NIMS) for coating of the receptor layers and data collection. This work was supported by the MSS alliance; JST CREST (JPMJCR1665); a Grant-in-Aid for Scientific Research (A), 18H04168, MEXT, Japan; a Grant-in-Aid for Young Scientists, 18K14133, MEXT, Japan; the Public/Private R&D Investment Strategic Expansion Program (PRISM), Cabinet Office, Japan; the Leading Initiative for Excellent Young Researchers, MEXT, Japan; the Center for Functional Sensor & Actuator (CFSN), NIMS; and the World Premier International Research Center Initiative (WPI) on Materials Nanoarchitectonics (MANA), NIMS.References
- K. J. Albert, N. S. Lewis, C. L. Schauer, G. A. Sotzing, S. E. Stitzel, T. P. Vaid and D. R. Walt, Chem. Rev., 2000, 100, 2595–2626 CrossRef CAS PubMed.
- U. Lange, N. V. Roznyatovskaya and V. M. Mirsky, Anal. Chim. Acta, 2008, 614, 1–26 CrossRef CAS PubMed.
- A. Lv, Y. Pan and L. Chi, Sensors, 2017, 17, 213 CrossRef.
- H. Bai and G. Shi, Sensors, 2007, 7, 267–307 CrossRef CAS.
- J. Gutiérrez and M. C. Horrillo, Talanta, 2014, 124, 95–105 CrossRef.
- A. Wilson, M. Baietto, A. D. Wilson and M. Baietto, Sensors, 2009, 9, 5099–5148 CrossRef CAS PubMed.
- A. D. Wilson, M. Baietto, A. D. Wilson and M. Baietto, Sensors, 2011, 11, 1105–1176 CrossRef CAS PubMed.
- A. D. Wilson, Proc. Technol., 2012, 1, 453–463 CrossRef.
- G. Konvalina and H. Haick, Acc. Chem. Res., 2014, 47, 66–76 CrossRef CAS PubMed.
- R. A. Potyrailo, Chem. Rev., 2016, 116, 11877–11923 CrossRef CAS PubMed.
- J.-W. Yoon and J.-H. Lee, Lab Chip, 2017, 17, 3537–3557 RSC.
- J. K. Gimzewski, C. Gerber, E. Meyer and R. R. Schlittler, Chem. Phys. Lett., 1994, 217, 589–594 CrossRef CAS.
- G. Yoshikawa, Appl. Phys. Lett., 2011, 98, 173502 CrossRef.
- K. Shiba, T. Sugiyama, T. Takei and G. Yoshikawa, Chem. Commun., 2015, 51, 15854–15857 RSC.
- G. Imamura, K. Shiba and G. Yoshikawa, Jpn. J. Appl. Phys., 2016, 55, 1102B1103 CrossRef.
- K. Shiba, R. Tamura, G. Imamura and G. Yoshikawa, Sci. Rep., 2017, 7, 3661 CrossRef PubMed.
- I. Osica, G. Imamura, K. Shiba, Q. Ji, L. K. Shrestha, J. P. Hill, K. J. Kurzydłowski, G. Yoshikawa and K. Ariga, ACS Appl. Mater. Interfaces, 2017, 9, 9945–9954 CrossRef CAS PubMed.
- H. T. Ngo, K. Minami, G. Imamura, K. Shiba and G. Yoshikawa, Sensors, 2018, 18, 1640 CrossRef.
- K. Minami, K. Shiba and G. Yoshikawa, Anal. Methods, 2018, 10, 3720–3726 RSC.
- K. Shiba, R. Tamura, T. Sugiyama, Y. Kameyama, K. Koda, E. Sakon, K. Minami, H. T. Ngo, G. Imamura, K. Tsuda and G. Yoshikawa, ACS Sens., 2018, 3, 1592–1600 CrossRef CAS PubMed.
- G. Yoshikawa, T. Akiyama, S. Gautsch, P. Vettiger and H. Rohrer, Nano Lett., 2011, 11, 1044–1048 CrossRef CAS PubMed.
- G. Yoshikawa, T. Akiyama, F. Loizeau, K. Shiba, S. Gautsch, T. Nakayama, P. Vettiger, N. F. de Rooij and M. Aono, Sensors, 2012, 12, 15873–15887 CrossRef PubMed.
- J. Yan, X. Guo, S. Duan, P. Jia, L. Wang, C. Peng, S. Zhang, J. Yan, X. Guo, S. Duan, P. Jia, L. Wang, C. Peng and S. Zhang, Sensors, 2015, 15, 27804–27831 CrossRef.
- S. M. Scott, D. James and Z. Ali, Microchim. Acta, 2007, 156, 183–207 CrossRef.
- V. N. Vapnik, Estimation of dependences based on empirical data; Empirical inference science: afterword of 2006, Springer, 2006 Search PubMed.
- C. M. Bishop, Pattern recognition and machine learning, Springer, 2006 Search PubMed.
- T. Nowotny, A. Z. Berna, R. Binions and S. Trowell, Sens. Actuators, B, 2013, 187, 471–480 CrossRef CAS.
- J. M. Torres, C. M. Stafford and B. D. Vogt, Polymer, 2010, 51, 4211–4217 CrossRef CAS.
- M. Pardo and G. Sberveglieri, Sens. Actuators, B, 2007, 123, 437–443 CrossRef CAS.
- P. C. Mahalanobis, Proc. Natl. Inst. Sci. India, 1936, 2, 49–55 Search PubMed.
- G. Taguchi and R. Jugulum, The Mahalanobis-Taguchi Strategy: A Pattern Technology System, John Wiley & Sons, Inc., 2007 Search PubMed.
- A. Adebanji and S. Nokoe, Effects of Mahalanobis Distance and Prior Probabilities: On the Performance of the Linear and Quadratic Discriminant Functions: A Monte Carlo Approach, LAMBERT Academic Publishing, 2011 Search PubMed.
Footnote |
| † Electronic supplementary information (ESI) available: Additional sensing signals, additional PCA and LDA analyses, and additional results of SVM and Mahalanobis distances. See DOI: 10.1039/c8mh01169a |
| This journal is © The Royal Society of Chemistry 2019 |